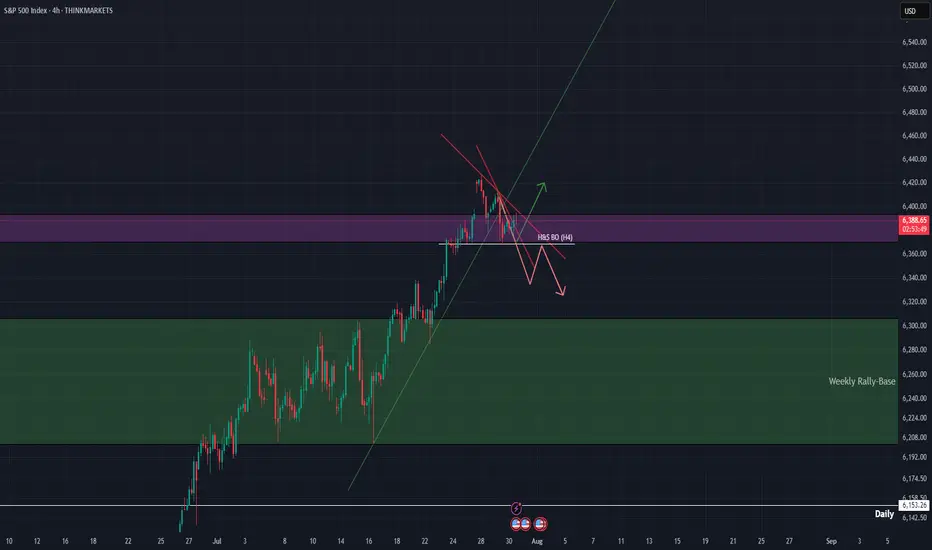
SPX500 AnalysisThis analysis is based on the 4-hour timeframe, reversal trading, and trend formation. I've posted a video explaining what I think is probable to happen and why.
Market indices
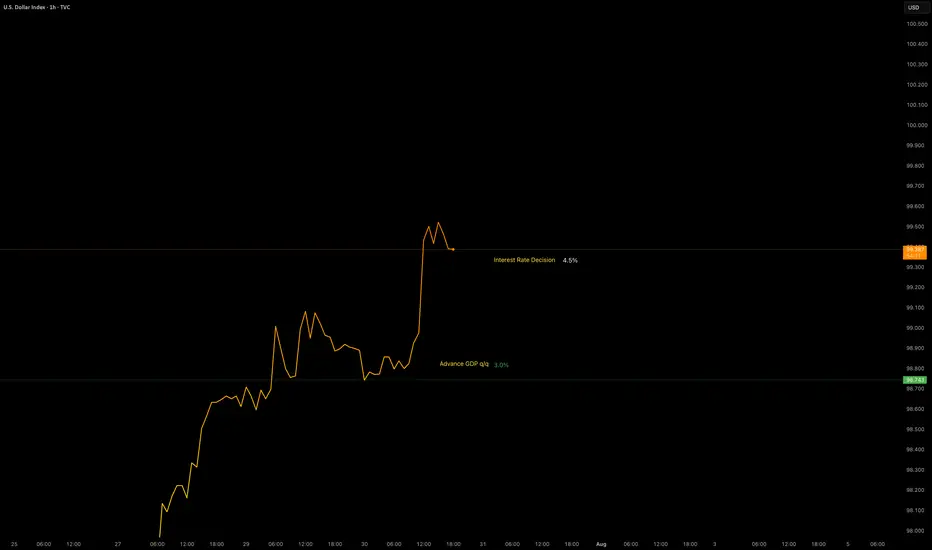
Data Release - Interest Rate DecisionJul 30 2025: Interest Rate Decision (4.5%)
Rates remain unchanged as expected.
OANDA:XAUUSD remains bearish with the help of GDP data.
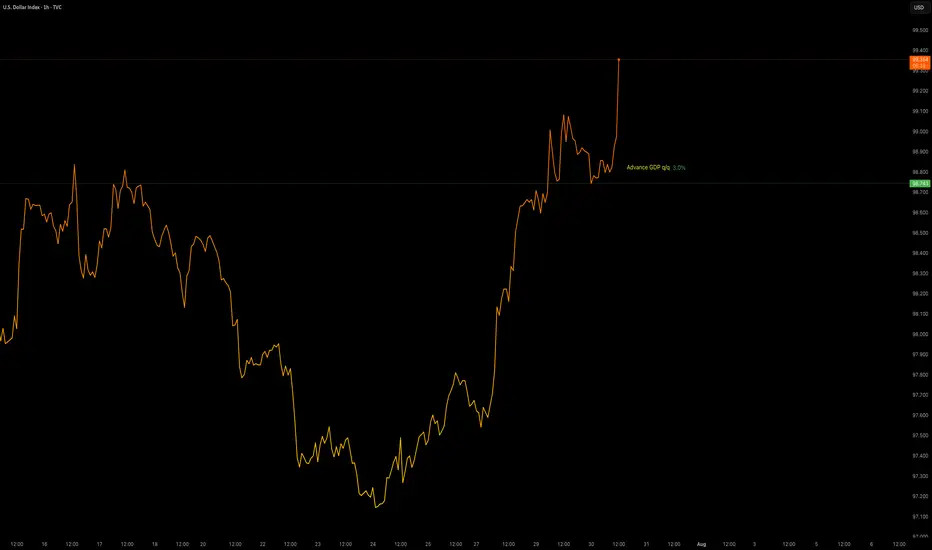
TVC:DXY remains bullish with the help of GDP data. No major changes in either pairs.
Volatility is increased.
DOLLAR INDEX DXYThe latest U.S. economic data released on July 30, 2025 shows:
ADP Non-Farm Employment Change: Actual increase of 104,000 jobs, significantly above the forecast of 77,000. This marks a strong rebound from the previous decline of -23,000 in June and indicates solid labor market momentum, particularly in services sectors like leisure/hospitality, financial activities, and trade/transportation. However, education and health services saw job losses. Wage growth remains steady at 4.4% year-over-year for job-stayers.
Advance GDP q/q Growth: Actual growth came in at 3.0%, beating the forecast of 2.5% and improving sharply from -0.5% previously. This suggests that the economy is expanding robustly in the second quarter
Advance GDP Price Index q/q (Inflation measure): Actual was 2.0%, slightly below the forecast of 2.2%, and down from 3.8% previously, indicating easing inflation pressures .
Interpretation of this data for Federal Reserve policy:
The stronger-than-expected job growth and GDP expansion signal a resilient economy, which may reduce the immediate likelihood of Fed rate cuts, as these indicators support sustained economic momentum.
The slightly softer inflation reading on the GDP Price Index suggests inflation pressures are continuing to moderate, which could offer some flexibility to the Fed.
Overall, the Fed is likely to view this data mix as supportive of a cautious, data-dependent approach, possibly maintaining current rates in the short term without rushing to cut, but monitoring to ensure inflation stays on a downward path.
If the Fed prioritizes strong growth and a resilient labor market, rate hikes or holds are more likely than cuts. If inflation remains subdued, it could permit a gradual easing down the line but probably not immediately.
Let me know if you want a detailed outlook on market reactions to this release or the potential Fed communication following today’s data.
#GOLD

29-07-2025This chart contains my analysis and key observations for today's trading session. All drawings and indicators reflect my current view of the market as of today. The purpose of this publication is to keep a record of my analysis and review it later for learning and improvement. No investment advice is provided.

Nasdaq Long 7.17.25At 9 AM, price bounced off of the PD high which signified that price wanted to distribute above the current week high, old day high. I entered at 10 AM off the 9 AM candle. Awesome trade and execution.

US500 (S&P): Trend in daily time frameThe color levels are very accurate levels of support and resistance in different time frames, and we have to wait for their reaction in these areas.
So, Please pay special attention to the very accurate trends, colored levels,
and you must know that SETUP is very sensitive.
Be careful
BEST
MT

NASDAQ Long 7.28.25I saw that price had hit the PD high and took the PD low (sunday) then closed at 9 AM as a bullish hammer. At 10 AM, I entered long at the 9 AM wick equilibrium. The trade hit the 75% BE and Final TP with a 1:1 RR.

Greed Alert: STOXX 50 Momentum Signals But Caution Needed🚨 STOXX50 RESISTANCE BREAKOUT PLAY! 💥 | THIEF TRADER STYLE 🔓📈
🧠 Thief Trader Master Plan: BULLISH ATTACK
🎯 Entry: Breakout above 5420 (Major RESISTANCE WALL 🧱)
🛑 Stop Loss: 5330 — Strict risk control, no funny business 😤
🚀 Target: 5560 — Smart money aims high 💰
👀 We spotted a strong momentum brewing — bulls are charging to break through the ceiling. Once 5420 cracks, it's game on.
🔥 Watch the levels, respect the trade, and let’s rob the market clean 💼💸
🧠 Market Sentiment Outlook
Retail Traders
🐂 Bullish: 55%
🐻 Bearish: 35%
😐 Neutral: 10%
Institutional Traders
🐂 Bullish: 60%
🐻 Bearish: 30%
😐 Neutral: 10%
😨😍 Fear & Greed Index
Score: 69/100 → Greed 🤠
Insight: Market tilts toward optimism — but tread carefully; overvaluation risks are real.
📈 Fundamental Strength Score
Score: 72/100
Drivers:
💰 Earnings Surge – AB InBev (+8.7%), Munich RE (+4.8%)
📉 Stable Eurozone Data
🚀 Momentum Building – STOXX 50 approaching all-time highs
🌍 Macro Economic Score
Score: 65/100
Factors:
⚖️ Tariff Delays – U.S. tariffs on Canada/Mexico pushed to April 2
📅 Eurozone PMI Preview
🌎 Tensions Rising – U.S.–Iran geopolitical friction
🔎 Key Highlights
🧠 Sentiment Check: Greedy mood – watch for pullbacks
💼 Earnings Season: Q2 winners driving index higher
⚠️ Volatility Triggers: Geopolitics + tariff policy
📉 Opportunity Alert: Fear score <20? Historically undervalued zone
📊 Technical Signal: STOXX 50 >125-day MA = uptrend confirmed
🧭 Always combine real-time data with sound technical and fundamental insights.
📌 Stay informed. Stay sharp. 🚀
💬 Drop your thoughts below.
❤️ SMASH that like button if this helped you.
👥 Support the Thief Trader team — we're in this to help you win.
📡 Stay sharp. Stay ruthless. Stay profitable.
— Thief Trader 🔐📊

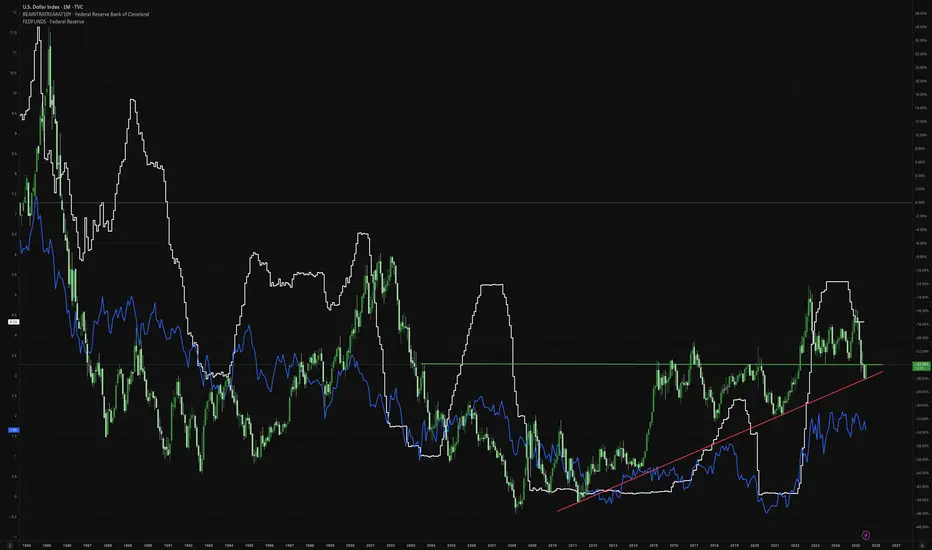
Just a bounce off or a real trend reversal?DXY sits on a major support zone. Price often delivers a reflex bounce at strong levels before continuing the prevailing trend, so a quick pop isn’t proof of a new bull run. DXY is closely linked to US real yields (10y TIPS): if real yields roll over as the Fed eases, USD strength likely fades; if real yields stay firm, a durable reversal is more plausible.
This post is for informational/educational purposes only and is not investment advice or a solicitation to buy/sell any security. Past performance is not indicative of future results. I may hold positions related to the instruments mentioned.
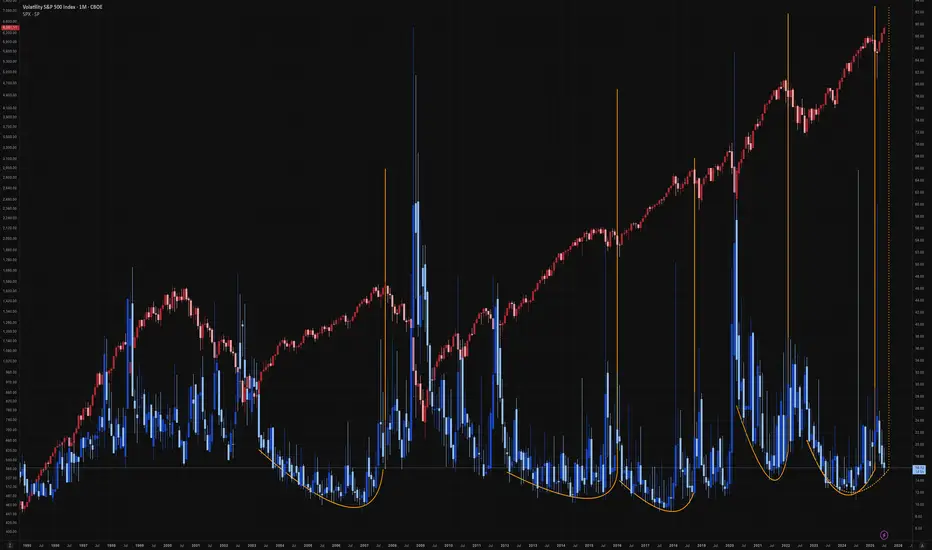
What will go down VIX or SPX?When SPX pushes fresh highs while the VIX floor makes higher lows, fragility rises.
This post is for informational/educational purposes only and is not investment advice or a solicitation to buy/sell any security. Past performance is not indicative of future results. I may hold positions related to the instruments mentioned.
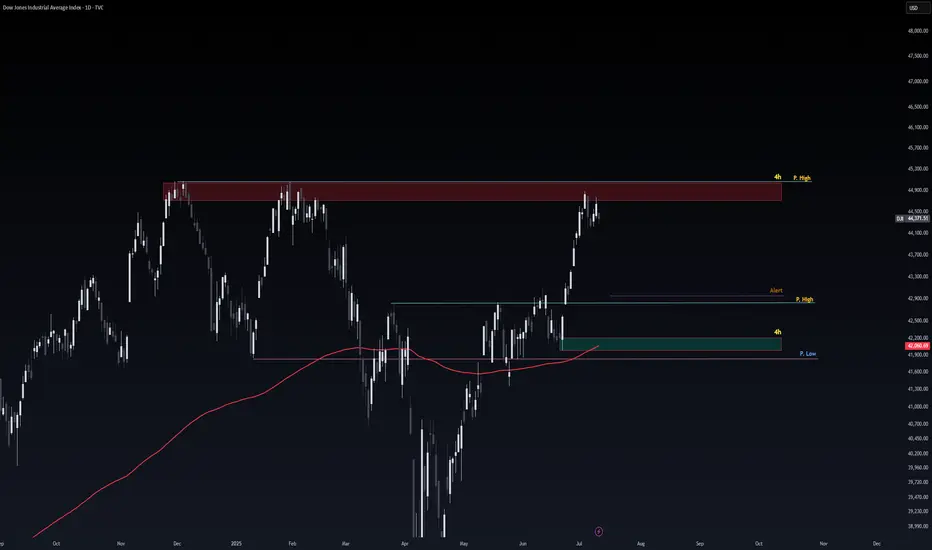
Safe Entry DJIObvious Movement I Guess.
P.High(Previous High) Act As good Support for price to Respect.
Note: 1- Potentional of Strong Buying Zone:
We have two scenarios must happen at The Mentioned Zone:
Scenarios One: strong buying volume with reversal Candle.
Scenarios Two: Fake Break-Out of The Buying Zone.
Both indicate buyers stepping in strongly. NEVER Join in unless one showed up.
2- How to Buy Stock (safe way):
On 1H TF when Marubozu/Doji Candle show up which indicate strong buyers stepping-in.
Buy on 0.5 Fibo Level of the Marubozu/Doji Candle, because price will always and always re-test the
US30 DOWN FOR WHILEWe have seen dramatic gain in most of the indices and US30 being one of them, and i have been tracking it for so long and i have come with this idea from my approach. As you can see on my screen i have labeled those levels and reset to mark up the the half cycle with the aid of the TDI divergence, the last push there is the level 3 moving exactly with the divergence which indicates that the bulls are getting weak and bears are about take over and push price to the downside, so am looking to join the bears 🐻to price down for a while.

DXY UPDATE FOR LONG as we forecast a long term this an update
The dollar index (DXY00) on Tuesday rose by +0.22% and posted a 5-week high. The dollar has carryover support from Monday following the EU-US trade deal that is seen as favoring the US. Also, expectations for the Fed to keep interest rates unchanged at the end of Wednesday's 2-day FOMC meeting are supportive of the dollar. The dollar extended its gains after the US Jun advance goods trade deficit unexpectedly shrank, a supportive factor for Q2 GDP, and after July consumer confidence rose more than expected.

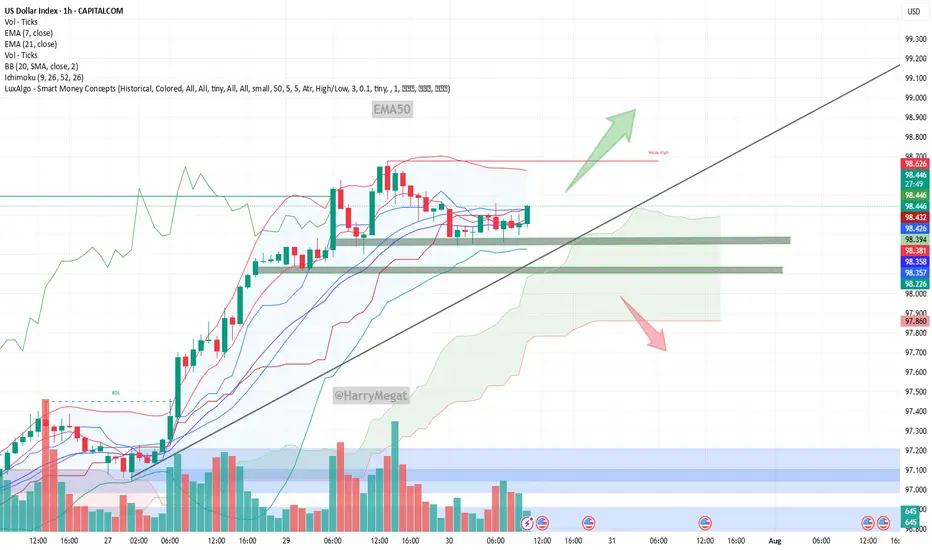
US Dollar Index (DXY) Chart Analysis – 1H TimeframeUS Dollar Index (DXY) Chart Analysis – 1H Timeframe
This chart shows the **US Dollar Index (DXY)** with key price zones, trendlines, and EMA indicators. Here's a detailed analysis:
**Key Observations:**
* **Price:** Currently trading near **98.41**
* **EMAs:**
* **EMA 7** = 98.373 (short-term trend)
* **EMA 21** = 98.356 (medium-term trend)
* **Trendline:** Uptrend line still intact, acting as dynamic support
* **Volume:** Steady, no strong breakout yet
* **Support Zones:** 98.20 – 98.35
* **Price Structure:** Consolidating above support and EMAs after a pullback from highs
**Bullish Scenario**
* If price **holds above EMAs and the green support zone (98.20–98.35)**
* **Breakout above 98.50** would confirm strength
* Targets:
→ **98.70**
→ **99.00+** if trendline support continues to hold
* EMAs are aligned bullishly (7 above 21) – good sign for continued upward trend
**Bearish Scenario**
* If price **breaks below 98.20 and closes under the trendline**
* Watch for rejection near 98.50 followed by strong red candle
* Downside targets:
→ **97.80**
→ **97.60**
* A breakdown below the ascending trendline = trend shift confirmation
**Conclusion**
* **Bias:** Bullish as long as DXY stays above 98.20 and trendline
* **Invalidation:** A break and close below 98.20 + trendline = bearish shift
Dow Jones Index Analysis (US30 / Dow Jones):🔹 The index broke below a key support zone yesterday and is now consolidating between 44,720 USD and 44,620 USD.
1️⃣ If bullish momentum leads to a break and close above 44,740 USD, the price may retest the 44,970 USD zone.
2️⃣ However, if the price breaks below 44,600 USD and holds, a decline toward 44,350 USD is likely.
⚠️ Disclaimer:
This analysis is not financial advice. It is recommended to monitor the markets and carefully analyze the data before making any investment decisions.

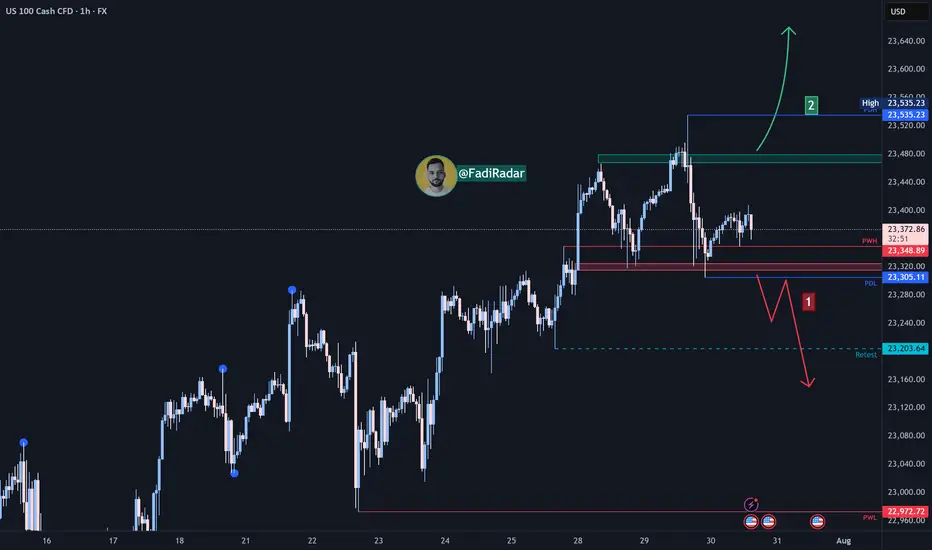
USNAS100 Correction in Play – Watching 23390 & 23440USNAS100
The price is undergoing a bearish correction while trading below 23440, with downside targets at 23300 and 23295, especially if a 1H candle closes below 23390.
A bullish scenario will be activated if price closes 1H above 23440, opening the path toward 23530 and potentially 23700.
At the moment, the market appears to be correcting toward 23295 before attempting a bullish rebound.
Support Levels: 23300 – 23210 – 23150
Resistance Levels: 23530 – 23700

Data Release - Advance GDP q/q (3.0%)Jul 30 2025: ADVANCE GDP q/q (3.0%)
OANDA:XAUUSD sees some downside pressure with positive GDP data.
TVC:DXY gaining strength.
Volatility is increased. This data will be used with Interest Rate Decision later in the day to provide a XAUUSD insight.
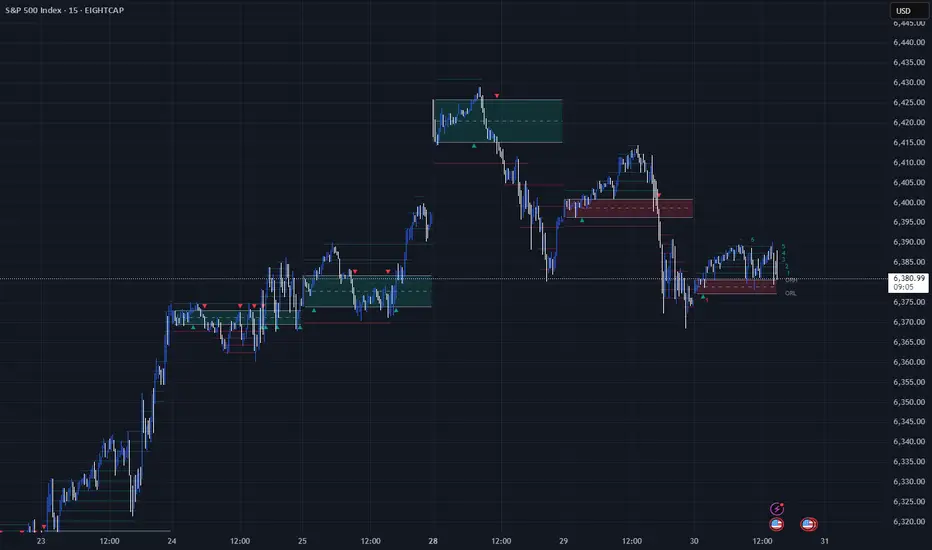
Unlocking the Power of ORB (Opening Range Breakout)Unlocking the Power of ORB (Opening Range Breakout): A Proven Strategy for Intraday Traders
In the fast-paced world of intraday trading, simplicity and structure can often outperform complexity. One such time-tested strategy is the Opening Range Breakout (ORB) — a method favored by both discretionary and system traders for its clarity and adaptability.
📌 What is ORB (Opening Range Breakout)?
ORB refers to the price range (high and low) formed during the first few minutes (typically 5, 15, or 30) after the market opens. Traders look for a breakout above or below this range, anticipating strong momentum in that direction.
🧠 Why ORB Works
Volume Surge: The opening minutes see high institutional activity, creating genuine demand/supply signals.
Market Psychology: ORB captures trader sentiment as news digests overnight and is priced in at the open.
Defined Risk: The high/low of the range becomes a natural stop-loss area, allowing clean setups.
✅ Entry and Exit Rules for the ORB Strategy
Having a consistent framework helps you avoid emotional decisions. Here’s how you can structure your trades using ORB:
🔹 Entry Criteria:
Timeframe: Define your ORB window — e.g., first 15-minute candle.
Bullish Breakout Entry:
Enter long when price closes above the ORB high with volume confirmation.
Bearish Breakdown Entry:
Enter short when price closes below the ORB low with volume confirmation.
⚠️ Avoid entering on the first breakout candle. Wait for a close and retest, or a strong momentum candle for higher confidence.
🔹 Stop-Loss Placement:
For Long Trades: Place SL just below ORB low
For Short Trades: Place SL just above ORB high
🔹 Target/Exit Options:
Fixed RR Target: Aim for 1.5–2x your risk as initial target.
Mid/Outer Bands: Use indicator-drawn breakout bands (like those in LuxAlgo script) as profit zones.
Time-based Exit: Close position by end of session if price stalls or consolidates.
Trailing Exit: Trail your stop behind higher lows (long) or lower highs (short) after breakout.
📊 ORB in Action
You can explore this ready-to-use TradingView indicator to visualize ORB levels in real-time:
🔍 Indicator: Opening Range with Breakouts & Targets (by @LuxAlgo) Thanks to @LuxAlgo team to make this indicator available.
🛠️ Highlights:
Automatically marks the opening range
Plots breakout zones and targets
Ideal for intraday strategies
Works across indices, forex, and crypto
📓 Integrating ORB into Your Trading Journal App
If you're journaling ORB trades, consider logging:
✅ Symbol & timeframe
✅ ORB range (high/low)
✅ Breakout direction (long/short)
✅ Entry time & price
✅ Exit reason (target hit, SL hit, time-based exit)
✅ Notes: market sentiment, news drivers, volume confirmation
Over time, this data will help you:
🔍 Identify which assets respect ORB best
📈 Tune your RR ratio and stop placements
🧠 Reduce decision fatigue by automating setups
🧪 Want to Automate It?
Our trading journal app is ready with 🧠 AI-based journaling for feedback and refinement
🎯 Final Thoughts
ORB is a classic — not because it’s flashy, but because it offers structure, risk control, and repeatability. Whether you're a price action purist or using smart indicators, ORB can provide a disciplined edge — especially when integrated into a journaling and feedback loop.
📌 Start small. Track results. Tune your edge.
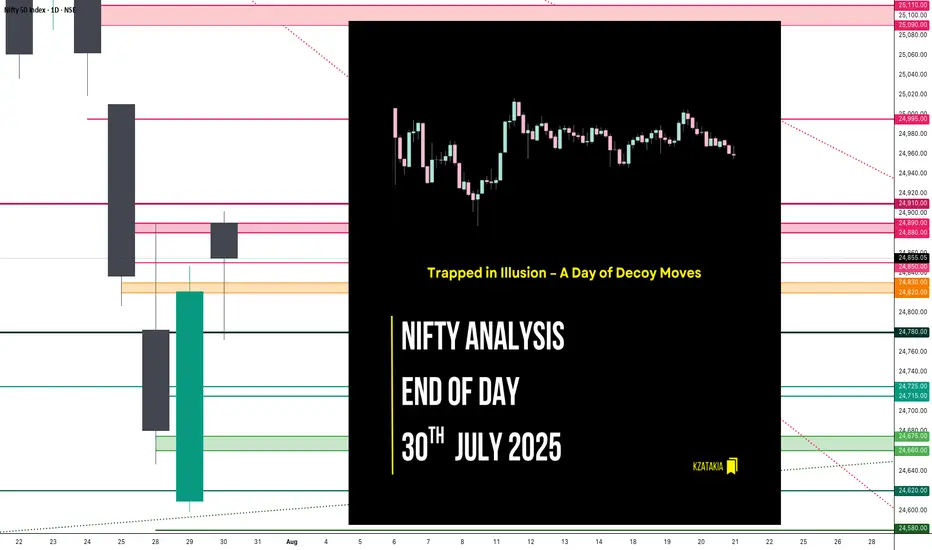
Nifty Analysis EOD – July 30, 2025 – Wednesday🟢 Nifty Analysis EOD – July 30, 2025 – Wednesday 🔴
Trapped in Illusion – A Day of Decoy Moves
Nifty moved 130 points today, falling short of the 2-week average range of 196 points. It formed its IB by 11:40 AM, marking the day's high and low early. For the rest of the session, it hovered between the IB high and the previous day high, eventually closing near the mean.
Despite a close below the open, Nifty managed a green close vs. the previous day—making it a classic "moboroshi candle" day, where visuals deceive sentiment.
📉 Intraday 5 Min Time Frame Chart
🪜 Intraday Walk
IB formed by 11:40 AM
False breakout on both sides trapped traders badly
Nifty stayed stuck between IB high and PDH
Closed slightly above the previous close, but below open
Eyes on breakout of 24,910 for targets of 24,995 and 25,090–25,110
🔄 Trend & Zone Update
📈 Resistance Zone Shifted To: 25,110 ~ 25,090
📉 Support Zone Shifted To: 24,520 ~ 24,480
🕯 Daily Time Frame Chart with Intraday Levels
🕯️ Daily Candle Breakdown
Candle Type: Small Red Hammer‑Like Candle (Decoy / Moboroshi)
Today’s OHLC:
🟢 Open: 24,890.40
🔺 High: 24,902.30
🔻 Low: 24,771.95
🔴 Close: 24,855.05
📈 Change: +33.95 (+0.14%)
📌 Candle Structure:
Real Body: 35.35 pts (Small bearish body)
Upper Wick: 11.90 pts (Very small)
Lower Wick: 83.10 pts (Long)
📌 Key Observations:
Buyers stepped in near 24,770 zone
Closed near open but slightly lower → mild net selling
Long lower wick indicates dip buying support
📌 Implication:
Buyers defended 24,770–24,780 zone
A reclaim of 24,900–24,920 may resume bullish move
A close below 24,770 weakens support
🛡 5 Min Intraday Chart
🛡️ Gladiator Strategy Update
ATR: 195.72
IB Range: 78.15 → Medium
Market Structure: Balanced
💥 Trades Triggered:
🕙 10:25 AM – Short Entry → SL Hit
📌 Trade Summary:
False IB breakouts on both sides led to a stop loss hit—typical trap in a tight consolidation phase.
📌 Support & Resistance Levels
📈 Resistance Zones:
24,880 ~ 24,890
24,910
24,995
25,090 ~ 25,110
📉 Support Zones:
24,830 ~ 24,820
24,780
24,725 ~ 24,715
24,660 ~ 24,650
🔮 What’s Next? / Bias Direction
Awaiting breakout above 24,910 for potential targets of 24,995 and 25,090–25,110. Consolidation may reward patient breakout players in upcoming sessions.
🧠 Final Thoughts
“Structure is key. When levels work, respect them. When they break, adapt.”
Today's range was narrow, but traps show signs of buildup. Be ready when the market unwinds.
✏️ Disclaimer
This is just my personal viewpoint. Always consult your financial advisor before taking any action.
Nasdaq Index Analysis (US100 / NASDAQ):The Nasdaq index is currently sweeping liquidity above the resistance zone and pulling back.
1️⃣ The more likely scenario is a break and close below 23,330 USD, which may lead to a decline toward 23,200 USD, followed by 23,000 USD.
2️⃣ However, if the price holds above 23,480 USD, a continuation of the uptrend is expected, potentially forming a new high.
⚠️ Disclaimer:
This analysis is not financial advice. It is recommended to monitor the markets and carefully analyze the data before making any investment decisions.
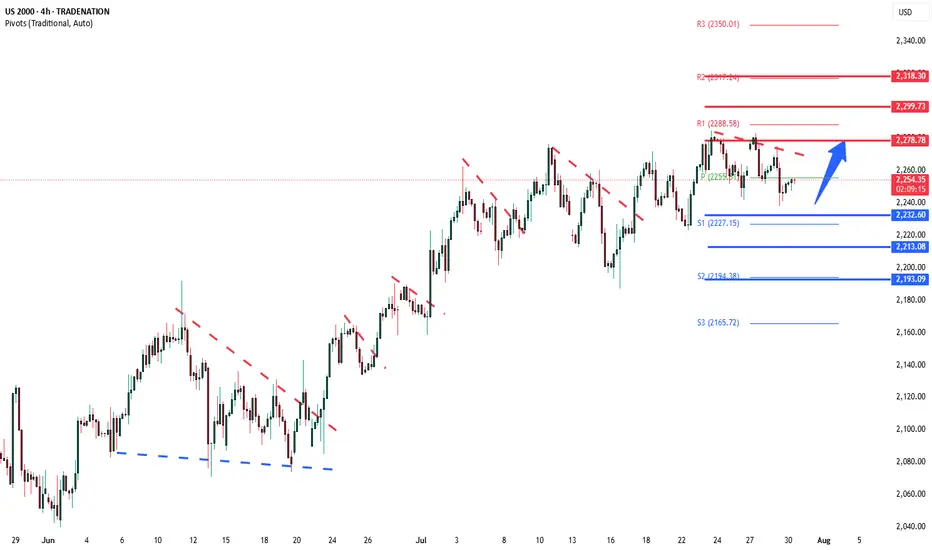
Russell2000 sideways consolidation supported at 2232Key Support and Resistance Levels
Resistance Level 1: 2278
Resistance Level 2: 2300
Resistance Level 3: 2318
Support Level 1: 2232
Support Level 2: 2213
Support Level 3: 2193
This communication is for informational purposes only and should not be viewed as any form of recommendation as to a particular course of action or as investment advice. It is not intended as an offer or solicitation for the purchase or sale of any financial instrument or as an official confirmation of any transaction. Opinions, estimates and assumptions expressed herein are made as of the date of this communication and are subject to change without notice. This communication has been prepared based upon information, including market prices, data and other information, believed to be reliable; however, Trade Nation does not warrant its completeness or accuracy. All market prices and market data contained in or attached to this communication are indicative and subject to change without notice.
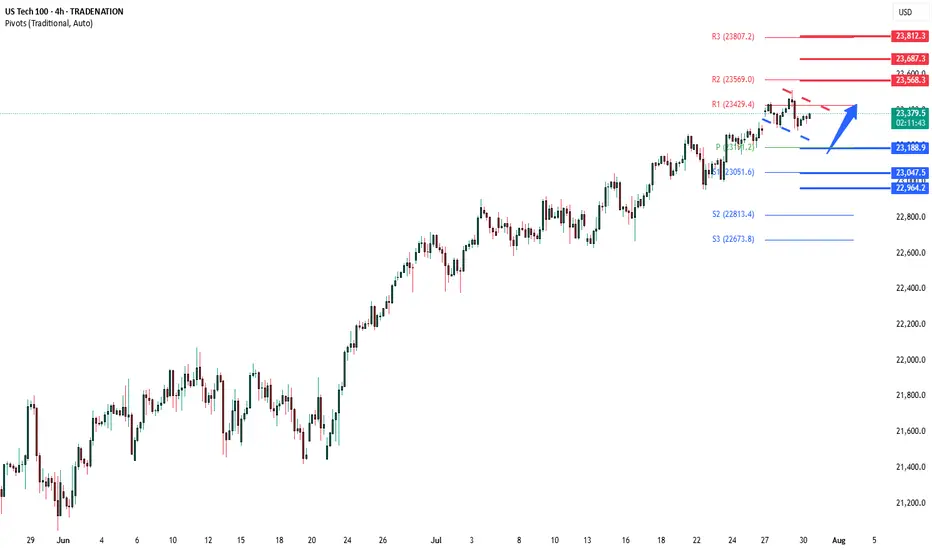
NSDQ100 important support at 23188US equities pulled back, breaking a six-day winning streak for the S&P 500 (-0.30%) as sentiment cooled ahead of key earnings and the Federal Reserve’s rate decision. The Nasdaq 100 (NDX) was weighed down by weakness in megacap tech stocks—the Mag-7 fell -0.68%, with Meta declining -2.46% and Microsoft earnings due after the close.
Post-earnings disappointments also pressured tech-related sentiment. PayPal slumped -8.66% on soft volume growth, despite unveiling a new crypto merchant feature, and UnitedHealth fell -7.46% on weaker sales. These sharp declines indicate heightened sensitivity to earnings misses in a market priced for perfection.
Meanwhile, market volatility could rise amid geopolitical jitters. A massive magnitude-8.8 earthquake in Russia’s Far East triggered tsunami alerts across the Pacific, briefly affecting Hawaii, California, and Shanghai. While many warnings were later downgraded, the event injected caution into markets.
On the macro front, investors are bracing for the Fed’s rate decision later today. The central bank is expected to hold rates steady, but traders are watching closely for guidance on future cuts—particularly in light of Trump’s renewed pressure for easing and ongoing global trade uncertainty, including tariff threats toward India.
Conclusion for Nasdaq 100 Trading:
With sentiment fragile and earnings risk front and center, traders in the Nasdaq 100 should expect near-term volatility, especially around Microsoft and Meta's earnings reports. The tech sector's leadership is under pressure, and any disappointing results could drag the index lower. Watch the Fed’s tone closely—a neutral or hawkish stance could further weigh on rate-sensitive tech. Cautious positioning or selective hedging may be warranted, particularly as geopolitical risks and trade policy uncertainty resurface.
Key Support and Resistance Levels
Resistance Level 1: 23568
Resistance Level 2: 23687
Resistance Level 3: 23812
Support Level 1: 23188
Support Level 2: 23047
Support Level 3: 22965
This communication is for informational purposes only and should not be viewed as any form of recommendation as to a particular course of action or as investment advice. It is not intended as an offer or solicitation for the purchase or sale of any financial instrument or as an official confirmation of any transaction. Opinions, estimates and assumptions expressed herein are made as of the date of this communication and are subject to change without notice. This communication has been prepared based upon information, including market prices, data and other information, believed to be reliable; however, Trade Nation does not warrant its completeness or accuracy. All market prices and market data contained in or attached to this communication are indicative and subject to change without notice.
Good turnaround by market as expected from the channel bottom.We had given a message that the market was nearing the bottom and there can be a turnaround sooner than later and market turned around today. This bounce can be currently seen as a technical bounce but it can become a full fledged fightback by bulls if it crosses key resistance levels of Mother line, Father line and Mid-channel resistance. These are the 3 key resistances in front of us currently. All eyes on the important trade deal announcements and with US and China which are on going any news on that from can disrupt the market proceedings in either way. Support and resistance levels for Nifty are as under:
Key Nifty Resistances: 24849 (Trend line resistance), 24922 (Motherline Resistance of hourly chart), 25028, 25070 (Father line resistance), 25189 (Mid-channel resistance), 25243 (Very important resistance for Bulls to conquer). Above 25243 Bulls can gain control of Nifty.
Key Support levels: 25741, 25627 (Channel bottom Support), 24519.
Disclaimer: The above information is provided for educational purpose, analysis and paper trading only. Please don't treat this as a buy or sell recommendation for the stock or index. The Techno-Funda analysis is based on data that is more than 3 months old. Supports and Resistances are determined by historic past peaks and Valley in the chart. Many other indicators and patterns like EMA, RSI, MACD, Volumes, Fibonacci, parallel channel etc. use historic data which is 3 months or older cyclical points. There is no guarantee they will work in future as markets are highly volatile and swings in prices are also due to macro and micro factors based on actions taken by the company as well as region and global events. Equity investment is subject to risks. I or my clients or family members might have positions in the stocks that we mention in our educational posts. We will not be responsible for any Profit or loss that may occur due to any financial decision taken based on any data provided in this message. Do consult your investment advisor before taking any financial decisions. Stop losses should be an important part of any investment in equity.
