Trading breakouts in summer: Japan’s index pushes higherSummer breakouts are tricky with low market participation, but Japan’s stock index just cleared a major level. Whether it’s a rectangle or inverse head and shoulders, the breakout looks valid. We explore how to manage risk, trim stop losses, and aim for a solid reward ratio. Will this push continue?
This content is not directed to residents of the EU or UK. Any opinions, news, research, analyses, prices or other information contained on this website is provided as general market commentary and does not constitute investment advice. ThinkMarkets will not accept liability for any loss or damage including, without limitation, to any loss of profit which may arise directly or indirectly from use of or reliance on such information.
Market indices

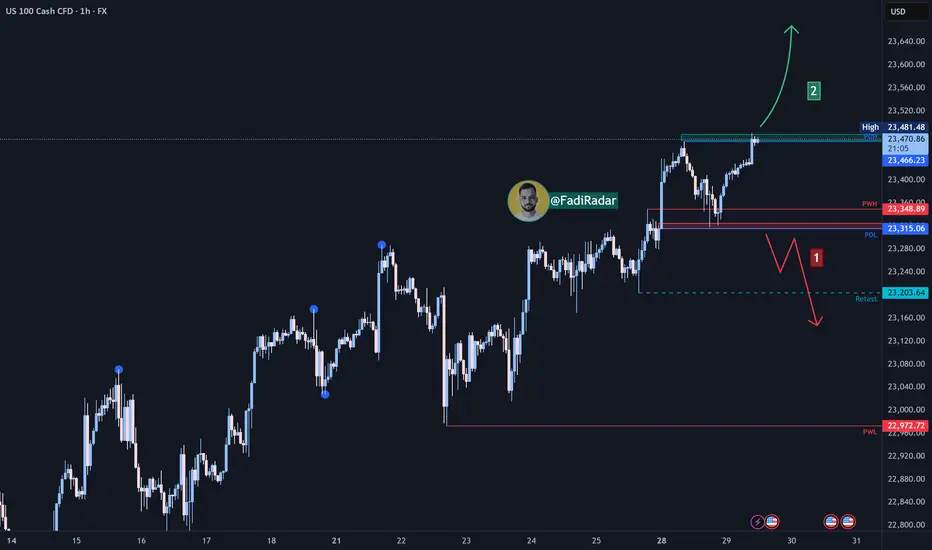
Nasdaq Index Analysis (US100 / NASDAQ):The Nasdaq index continues its medium- to long-term bullish trend, recently reaching a new high at 23,477 USD.
1️⃣ A break and close below 23,330 USD could trigger a pullback toward 23,200 USD, followed by 23,000 USD.
2️⃣ However, if the price holds above 23,480 USD, a continuation of the uptrend is expected, potentially forming a new high.
⚠️ Disclaimer:
This analysis is not financial advice. It is recommended to monitor the markets and carefully analyze the data before making any investment decisions.
SPX500 Correction Before Rally? Key Levels in FocusSPX500 Correction Before Rally? Key Levels in FocusSPX500 OVERVIEW
Fundamental Context:
The U.S. and EU have averted a tariff standoff. The agreement reduces the baseline tariff on most European imports to 15%, down from the previously threatened 30% by the Trump administration. In return, the EU has committed to investing approximately $600 billion in the U.S.
Additionally, U.S.–China trade talks are ongoing in Stockholm, with reports suggesting a possible 90-day extension to the tariff deadline.
Technical Outlook:
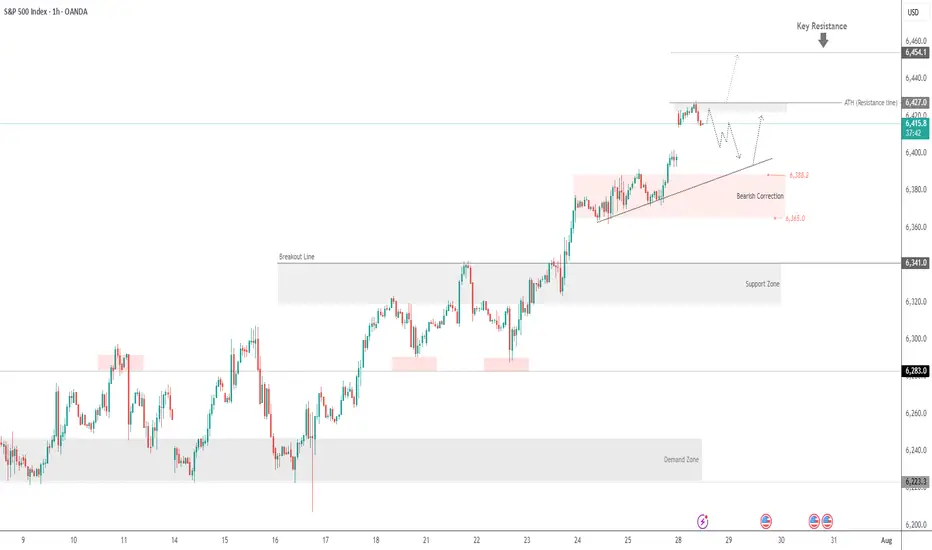
SPX500 maintains a bullish bias due to easing trade tensions. However, as long as the price trades below 6421, a short-term correction toward 6397 and 6388 is likely. A rebound is expected if the price stabilizes above 6388.
🔺 Bullish Continuation will be confirmed if a 1H candle closes above 6427, potentially targeting 6454 and 6470.
Key Levels
• Support: 6397 – 6388 – 6365
• Resistance: 6454 – 6470
Nasdaq 100 Index Hits New Highs Ahead of Big Tech EarningsNasdaq 100 Index Hits New Highs Ahead of Big Tech Earnings
Earlier, we noted signs of optimism in the Nasdaq 100 index as the market anticipated earnings reports from major tech firms.
Now, companies such as Alphabet (GOOGL) and Tesla (TSLA) have already released their results (we previously covered their charts → here and here). Up next are the most highly anticipated earnings reports: this week, tech giants including Microsoft (MSFT), Amazon (AMZN), Meta Platforms (META), and Apple (AAPL) are set to publish their results. The combined market capitalisation of these four companies exceeds $11 trillion, and their reports could have a significant impact on a stock market that is already showing strong bullish sentiment:
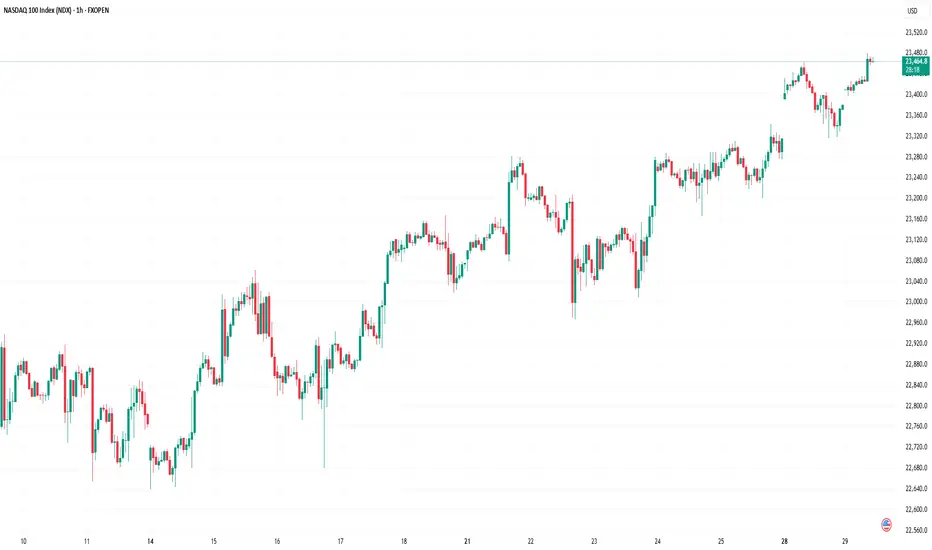
→ The Nasdaq 100 index has climbed to an all-time high, surpassing the 23,400 mark.
→ The signing of trade agreements between the US and Europe (and earlier, Japan) has eased concerns about the negative impact of tariff barriers.
Technical Analysis of Nasdaq 100
The chart supports growing signs of optimism: earlier in July, the price remained within a rising channel (marked in blue). However, towards the end of the month, price action has begun to follow a steeper upward trajectory (marked in purple).
What could happen next? Much will depend on the earnings results and forward guidance from these tech giants.
On the one hand, continued enthusiasm around AI adoption could accelerate further growth. The stronger the optimism, the more fuel it may add to discussions around a potential bubble — with some analysts already drawing parallels to the dot-com era of the early 2000s.
On the other hand, earnings could temper market excitement and prompt a correction. For example, the index may retreat to the support level around 23,020, which is reinforced by the lower boundary of the blue trend channel.
This article represents the opinion of the Companies operating under the FXOpen brand only. It is not to be construed as an offer, solicitation, or recommendation with respect to products and services provided by the Companies operating under the FXOpen brand, nor is it to be considered financial advice.
US Dollar Index (DXY) Reaches One-Month HighUS Dollar Index (DXY) Reaches One-Month High
The US Dollar Index (DXY) has risen to its highest level since early July. According to media reports, the bullish sentiment in the market is driven by the following factors:
→ Optimism around US trade agreements. A new trade deal with the EU — which includes a 15% tariff on European goods — is being perceived by the market as favourable for the United States.
→ Confidence in the resilience of the US economy. Strong Q2 corporate earnings have acted as an additional bullish catalyst. Investors may have started covering short positions against the dollar, viewing concerns over a US slowdown as overstated.
→ Expectations that the Federal Reserve will keep interest rates on hold.
From a technical standpoint, today’s DXY chart reflects strengthening bullish momentum.
Technical Analysis of the DXY Chart
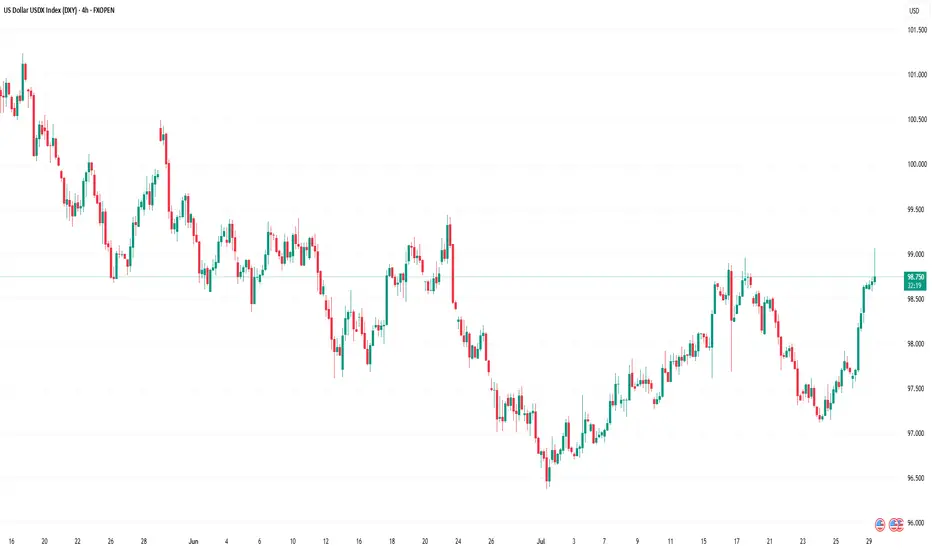
Two U-shaped formations (A and B) that developed over the summer have created a bullish сup and рandle pattern — a formation that suggests waning bearish pressure, as evidenced by the shallower second dip.
This setup points to the potential for a bullish breakout above the trendline (marked in red) that has defined the downward movement in the DXY throughout the first half of 2025.
As previously analysed, there are signs that the dollar index may have found a base following a period of decline. This could indicate a shift in market sentiment and the possible end of the recent bearish phase.
This article represents the opinion of the Companies operating under the FXOpen brand only. It is not to be construed as an offer, solicitation, or recommendation with respect to products and services provided by the Companies operating under the FXOpen brand, nor is it to be considered financial advice.
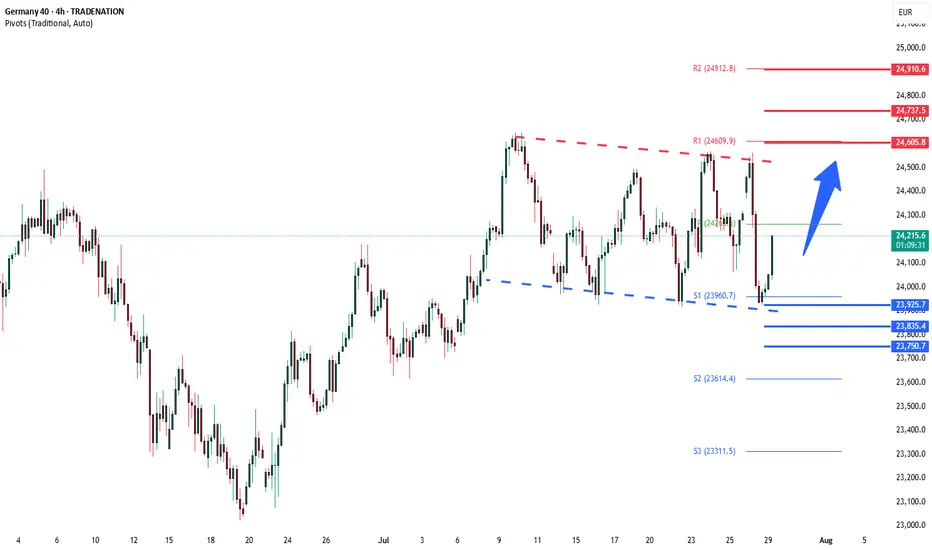
DAX oversold rally support at 23925The DAX remains in a bullish trend, with recent price action showing signs of a corrective pullback within the broader uptrend.
Support Zone: 23925 – a key level from previous consolidation. Price is currently testing or approaching this level.
A bullish rebound from 23925 would confirm ongoing upside momentum, with potential targets at:
24605 – initial resistance
24740 – psychological and structural level
24910 – extended resistance on the longer-term chart
Bearish Scenario:
A confirmed break and daily close below 23925 would weaken the bullish outlook and suggest deeper downside risk toward:
23835 – minor support
23750 – stronger support and potential demand zone
Outlook:
Bullish bias remains intact while the DAX holds above 23925. A sustained break below this level could shift momentum to the downside in the short term.
This communication is for informational purposes only and should not be viewed as any form of recommendation as to a particular course of action or as investment advice. It is not intended as an offer or solicitation for the purchase or sale of any financial instrument or as an official confirmation of any transaction. Opinions, estimates and assumptions expressed herein are made as of the date of this communication and are subject to change without notice. This communication has been prepared based upon information, including market prices, data and other information, believed to be reliable; however, Trade Nation does not warrant its completeness or accuracy. All market prices and market data contained in or attached to this communication are indicative and subject to change without notice.
DOLLAR INDEX U.S. Dollar Index (DXY) and US 10-Year Treasury Yield
Dollar Index (DXY) — will reclaim 103-102 level if it crosses 100 mark currently is at 98.34 and faces immediate supply roof ,a make or break situation awaits dollar buyers .
Over the past month, the Dollar Index has gained about 2%, although it is still down over 5% compared to a year ago. The recent uptick follows a period of volatility and selling, with investors recalibrating expectations after the resolution of trade risk premiums and recent U.S.–EU trade deals.
US 10-Year Treasury Yield keep rising after its drop from 4.193% in early july to 4.5% on 17th
Yield on the US 10-year Treasury note is currently about 4.42% , modestly higher than last week and unchanged from the previous session.
Current levels reflect ongoing uncertainty regarding future Federal Reserve policy moves, cautious optimism regarding U.S. economic strength, and some abatement of safe-haven flows after recent global trade developments.
Relationship & Market Synopsis
DXY and the 10-year yield typically have a positive correlation: When Treasury yields rise, the dollar often follows, as higher yields make dollar-denominated assets more attractive to global investors. Conversely, falling yields can weigh on the dollar. However, in 2025, there have been periods of divergence due to external shocks and policy uncertainty.
Current setup: Both DXY and the 10Y yield are rising modestly, signaling a shift to a more constructive tone for the U.S. dollar as risk sentiment stabilizes and investors scale back some safe-haven trades. Recent U.S. economic resilience and fading tariff fears have reduced the need for defensive flows, supporting both yields and the dollar.
Forward outlook: Market consensus expects limited further upside for Treasury yields unless there are strong surprises in U.S. data or Federal Reserve communication. The DXY is projected to stabilize near current levels or drift higher on persistent U.S. economic momentum.
Summary:
Both the Dollar Index and US 10-year Treasury yield are modestly higher as of July 29, 2025. Their positive price action reflects improving US growth prospects, reduced global risk premiums, and recalibrated market expectations on Fed policy. While their relationship is generally positive, periods of divergence have occurred in 2025 due to trade, policy, and economic shocks. Currently, both are showing moderate gains as investor sentiment stabilize

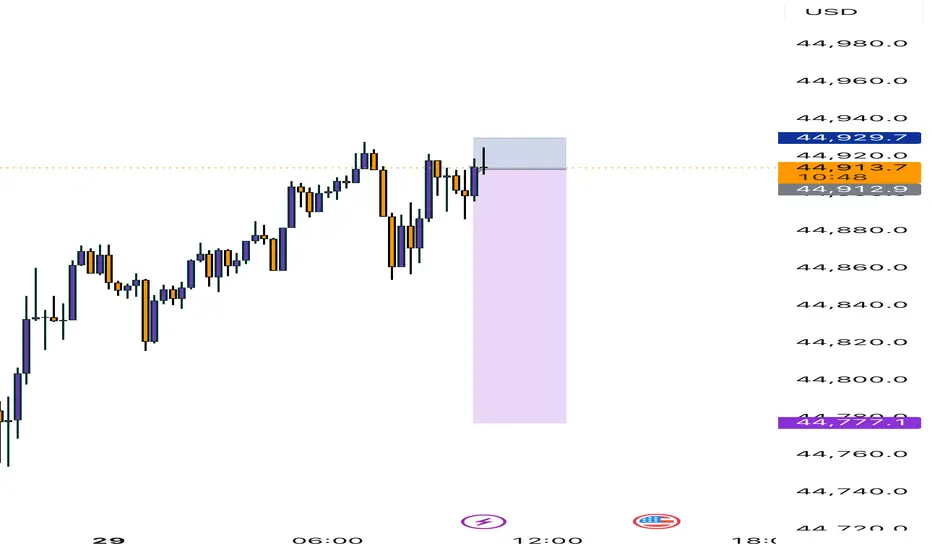
US30 Technical Breakdown – 07/29/2025📍 US30 Technical Breakdown – 07/29/2025
US30 is consolidating after last week's bullish breakout. It failed to hold above 45,100, rolled over, and is now ranging between 44,725 support and 45,000 resistance.
Currently sitting at 44,900, price is coiling just below key resistance. The market is waiting for a catalyst—either to reclaim 45,000 or dump back into the 44,700s.
📊 Current Market Behavior:
🔄 Sideways consolidation
📉 Lower highs forming below 45,100
🧱 Strong support building at 44,725
⚠️ No strong momentum yet – patience is key
📌 Key Levels:
🔹 Resistance Zones:
45,000 → Intraday ceiling
45,100–45,160 → Recent high/rejection area
45,250 → Breakout expansion level
🔹 Support Zones:
44,725–44,700 → Crucial support for bulls
44,600 → Mid-range support
44,171 → Demand floor
🧠 Bias:
🔄 Neutral to Slightly Bearish Intraday
Price stuck between 45,000 resistance and 44,700 support
Bears in control unless we break & hold above 45,000
Look for signs of momentum at open
Option Chain AnalysisTable of Contents
Introduction to Option Chain
What Is an Option Chain?
Key Components of an Option Chain
Call vs. Put Options in the Chain
How to Read an Option Chain
Open Interest (OI) Analysis
Implied Volatility (IV) Analysis
Strike Price Selection
Support and Resistance Levels from Option Chain
Option Chain for Intraday & Swing Trading
1. Introduction to Option Chain
In the world of options trading, success is not just about buying calls or puts randomly—it’s about understanding market data. One of the most important tools for analyzing this data is the Option Chain. Whether you're a beginner or an advanced trader, mastering option chain analysis can help you identify market sentiment, key levels, and trading opportunities.
2. What Is an Option Chain?
An Option Chain, also known as an Options Matrix, is a tabular representation of all available option contracts (both Call and Put) for a particular underlying asset—like Nifty, Bank Nifty, Reliance, TCS, etc.—for a specific expiry date.
It shows:
Strike prices
Premiums (Prices)
Open interest (OI)
Volume
Implied volatility (IV)
Bid/ask prices
Think of it like a menu card for options, showing all the possible trades you can take, and key stats about each.
3. Key Components of an Option Chain
✅ Strike Price:
The price at which you can buy (Call) or sell (Put) the underlying asset.
✅ Premium (LTP):
The last traded price (LTP) of the option.
✅ Open Interest (OI):
The number of open contracts for a strike price. Indicates trader interest.
✅ Change in OI:
The change in open positions compared to the previous day.
✅ Volume:
The number of contracts traded in the current session.
✅ Implied Volatility (IV):
Market's expected volatility of the underlying asset.
4. Call vs. Put Options in the Chain
In every option chain, you’ll see two sections:
Call Options (Left side) Put Options (Right side)
Bullish expectation Bearish expectation
Buy if expecting upside Buy if expecting downside
Sell if expecting sideways/down Sell if expecting sideways/up
Usually, the middle column contains strike prices, with Call data on the left and Put data on the right.
5. How to Read an Option Chain
Let’s take an example:
Assume Nifty is trading at 22,200. You look at the Nifty option chain.
You’ll see multiple rows of strike prices (e.g., 22,000, 22,100, 22,200…) and for each, data like LTP, OI, IV.
Look for:
ATM (At-the-money): Closest strike to the current price (22,200).
ITM (In-the-money): For calls, strikes < spot; for puts, strikes > spot.
OTM (Out-of-the-money): For calls, strikes > spot; for puts, strikes < spot.
Example:
22,200 is ATM.
22,100 Call is ITM.
22,300 Call is OTM.
6. Open Interest (OI) Analysis
OI is one of the most powerful indicators in option chain analysis. It shows where traders are placing their bets.
✔️ What to Look For:
High OI = Strong interest at that strike.
Increase in OI = New positions being added.
Decrease in OI = Positions being closed.
✔️ Interpretations:
High OI in Call → Resistance level.
High OI in Put → Support level.
Let’s say:
22,500 Call has 30 lakh OI → Strong resistance.
22,000 Put has 35 lakh OI → Strong support.
This gives you the trading range of Nifty: 22,000 to 22,500.
7. Implied Volatility (IV) Analysis
IV represents the market's future expectations of volatility. Higher IV means higher premiums.
✔️ Why IV Matters:
When IV is high, options are expensive.
When IV is low, options are cheaper.
✔️ Practical Use:
Sell options when IV is very high (premium is inflated).
Buy options when IV is low (premium is cheap).
8. Strike Price Selection
Choosing the right strike is key for successful trading.
✔️ For Buying Options:
Buy slightly ITM for better delta and time value.
ATM works for short-term, fast movements.
✔️ For Selling Options:
Sell OTM options with high OI and low IV.
✔️ Tip:
Always check the OI and IV before choosing a strike. Avoid illiquid strikes (with low OI or volume).
9. Support and Resistance Levels from Option Chain
You can spot support and resistance based on OI data.
✔️ Support:
Strike where Put OI is highest.
E.g., 22,000 Put with highest OI = Support zone.
✔️ Resistance:
Strike where Call OI is highest.
E.g., 22,500 Call with highest OI = Resistance zone.
This helps you create a trading range.
10. Option Chain for Intraday & Swing Trading
✅ Intraday Trading:
Watch change in OI during live market.
Spike in Call OI → Possible resistance forming.
Spike in Put OI → Possible support forming.
✅ Swing Trading:
Analyze overall OI trend.
Look at monthly expiry data.
Identify positional buildup or unwinding.
Options Trading Strategies: From Simple to AdvancedPart 1: The Basics of Options
Before diving into strategies, let’s review the two core types of options:
1. Call Option (CE)
Gives the buyer the right (but not the obligation) to buy an underlying asset at a predetermined price (strike price) within a specific time period.
Bullish in nature.
2. Put Option (PE)
Gives the buyer the right (but not the obligation) to sell an underlying asset at a predetermined price within a specific time period.
Bearish in nature.
Each option has a premium (price you pay to buy the option), and that’s the maximum loss a buyer can face. Sellers (or writers), on the other hand, receive the premium but take on higher risk.
Part 2: Simple Options Strategies
These are basic strategies suitable for new traders.
1. Buying a Call Option (Long Call)
When to Use: If you expect the stock/index to rise significantly.
Risk: Limited to the premium paid.
Reward: Unlimited potential profit.
Example:
Stock XYZ is trading at ₹100. You buy a 105 Call Option at ₹2 premium.
If stock moves to ₹115:
Intrinsic Value = ₹10
Profit = ₹10 - ₹2 = ₹8 per share
Why It’s Good: Cheap entry, high upside.
2. Buying a Put Option (Long Put)
When to Use: If you expect the stock/index to fall.
Risk: Limited to the premium paid.
Reward: High if stock crashes.
Example:
You buy a 95 PE when stock is at ₹100, and premium is ₹3.
If stock falls to ₹85:
Intrinsic Value = ₹10
Profit = ₹10 - ₹3 = ₹7 per share
Why It’s Good: Good for bearish bets or portfolio hedging.
3. Covered Call
When to Use: You own the stock and expect neutral to moderately bullish movement.
Risk: Limited upside potential.
Reward: Premium + stock movement (if not called away).
Example:
You own 100 shares of XYZ @ ₹100.
You sell 110 CE for ₹5.
If stock rises to ₹110, you sell at that level and keep ₹5 premium.
If it stays below ₹110, you keep the shares + premium.
Why It’s Good: Generates income from stocks you hold.
4. Protective Put
When to Use: You own a stock and want downside protection.
Risk: Limited downside.
Reward: Unlimited upside.
Example:
Own 100 shares of XYZ @ ₹100.
Buy a 95 PE at ₹3.
If stock drops to ₹85, your put becomes worth ₹10, offsetting losses.
Why It’s Good: Acts like insurance on your holdings.
Part 3: Intermediate Strategies
Once you’re comfortable with buying/selling calls and puts, it’s time to explore neutral and range-bound strategies.
5. Bull Call Spread
When to Use: You expect a moderate rise in the stock/index.
Risk: Limited.
Reward: Limited.
Structure:
Buy 100 CE at ₹5
Sell 110 CE at ₹2
Net Cost: ₹3
Max Profit: ₹10 - ₹3 = ₹7
Max Loss: ₹3
Why It’s Good: Lower cost than buying a call outright.
Part 4: Risk Management Tips
Never deploy a strategy you don’t understand.
Use stop-loss and position sizing to avoid blowing up capital.
Be aware of Greeks (Delta, Theta, Vega) — they drive profits/losses.
Avoid naked options selling unless you have enough margin and experience.
Always review IV (Implied Volatility) before placing straddles or condors.
Understand expiry effects — options lose value faster as expiry nears.
Part 5: Real-Life Example
Let’s say Nifty is trading at 22,000. You expect no major movement till expiry. You execute an Iron Condor:
Sell 22100 CE at ₹100
Buy 22300 CE at ₹40
Sell 21900 PE at ₹90
Buy 21700 PE at ₹30
Net Credit = ₹100 - ₹40 + ₹90 - ₹30 = ₹120
Max Loss = Spread width (200) - Net Credit = ₹80
If Nifty stays between 21900 and 22100 — all options expire worthless and you earn full ₹120.
Conclusion
Options trading is like a chess game — it's not only about direction, but also timing, volatility, and strategy structure. Simple strategies like buying calls and puts are perfect for starters, but intermediate and advanced strategies allow you to profit in any kind of market — bullish, bearish, or neutral.
The key lies in choosing the right strategy for the right market condition, managing risks, and being patient.
Whether you're hedging your portfolio, generating income, or speculating on big market moves, options provide the tools — but it’s your responsibility to use them wisely.
If you’d like charts, payoff diagrams, or examples using live data (like Bank Nifty or stocks), let me know and I can include those too!
Basics of Options: Calls and PutsWhat are Options?
An option is a financial contract that gives the buyer the right, but not the obligation, to buy or sell an underlying asset (like a stock or index) at a specific price, on or before a specific date.
Think of it like booking a movie ticket. You reserve the right to watch a movie at a particular time and seat. But if you don’t go, it’s your choice. You lose the ticket price (premium), but you're not forced to go. Options work similarly.
Options are of two basic types:
Call Option
Put Option
Let’s break both down in detail.
1. What is a Call Option?
A Call Option gives the buyer the right (but not the obligation) to buy the underlying asset at a pre-decided price (called the strike price) on or before a certain date (called the expiry date).
When do traders buy a Call Option?
When they believe the price of the underlying stock or index will go up in the future.
Example of Call Option (Simple Case)
Let’s say you are bullish on Reliance Industries stock, which is currently trading at ₹2,500.
You buy a Call Option with:
Strike Price: ₹2,550
Premium Paid: ₹30 per share
Lot Size: 250 shares
Expiry: Monthly expiry (say end of the month)
You believe Reliance will go up beyond ₹2,550 soon. If it goes to ₹2,600 before expiry:
Your profit per share = ₹2,600 (market price) - ₹2,550 (strike price) = ₹50
Net Profit = ₹50 - ₹30 (premium) = ₹20 per share
Total Profit = ₹20 x 250 = ₹5,000
But if Reliance stays below ₹2,550, say at ₹2,500 on expiry, you won’t exercise the option. You lose only the premium (₹30 x 250 = ₹7,500).
Key Terminologies in Call Options
In the Money (ITM): When the stock price is above the strike price.
At the Money (ATM): When the stock price is equal to the strike price.
Out of the Money (OTM): When the stock price is below the strike price.
2. What is a Put Option?
A Put Option gives the buyer the right (but not the obligation) to sell the underlying asset at a pre-decided price (strike price) on or before the expiry.
When do traders buy a Put Option?
When they believe the price of the underlying stock or index will fall in the future.
Example of Put Option (Simple Case)
Assume HDFC Bank is trading at ₹1,600. You are bearish and expect it to fall.
You buy a Put Option with:
Strike Price: ₹1,580
Premium: ₹20 per share
Lot Size: 500 shares
Expiry: Monthly
If HDFC Bank falls to ₹1,520:
You can sell at ₹1,580 even though market price is ₹1,520
Gross profit per share = ₹60
Net profit = ₹60 - ₹20 = ₹40 per share
Total profit = ₹40 x 500 = ₹20,000
If HDFC stays above ₹1,580, your put expires worthless. You lose only the premium (₹10,000).
Key Terminologies in Put Options
In the Money (ITM): Stock price below strike price.
At the Money (ATM): Stock price = strike price.
Out of the Money (OTM): Stock price above strike price.
Who are the Two Parties in an Option Contract?
1. Option Buyer (Holder)
Pays the premium
Has rights, but not obligations
Can exercise the option if profitable
Loss is limited to the premium paid
2. Option Seller (Writer)
Receives the premium
Has obligation to fulfill the contract if the buyer exercises
Risk is unlimited for call writers and limited for put writers (if stock price becomes zero)
Profit is limited to the premium received
Difference between Call and Put Options (Summary Table)
Feature Call Option Put Option
Buyer’s Expectation Bullish (price will go up) Bearish (price will go down)
Right Buy at strike price Sell at strike price
Profit Potential Unlimited Limited (until price reaches zero)
Risk (for buyer) Limited to premium Limited to premium
Seller’s Role Sells call & hopes price won’t rise Sells put & hopes price won’t fall
Premium and What Influences It?
The premium is the price you pay to buy an option. This is influenced by:
Intrinsic Value: Difference between market price and strike price
Time Value: More days to expiry = higher premium
Volatility: Higher the volatility = higher the premium
Interest Rates and Dividends
What is Strike Price and Expiry?
Strike Price: The price at which you can buy (call) or sell (put) the underlying stock
Expiry: The last date till which the option is valid. In India:
Weekly expiry for Nifty, Bank Nifty, and FINNIFTY
Monthly expiry for stocks
NextGenTraders81 NAS short swingI have my sell limit set at 23,500 as there is alot of sell limits set there, also at 23,550 hence the SL is above that zone.
I am pretty sure the position will be set on BE before it tries to return to these highs, how long it will take to hit TP, who knows.. a correction within the channel is due after numerous ATHs.
If you will follow, take partials on the way !
Good luck :)

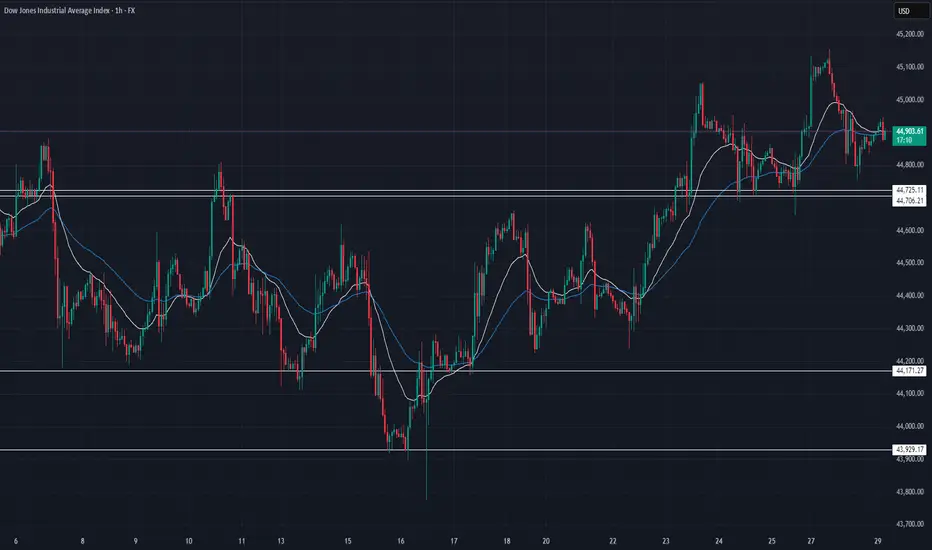
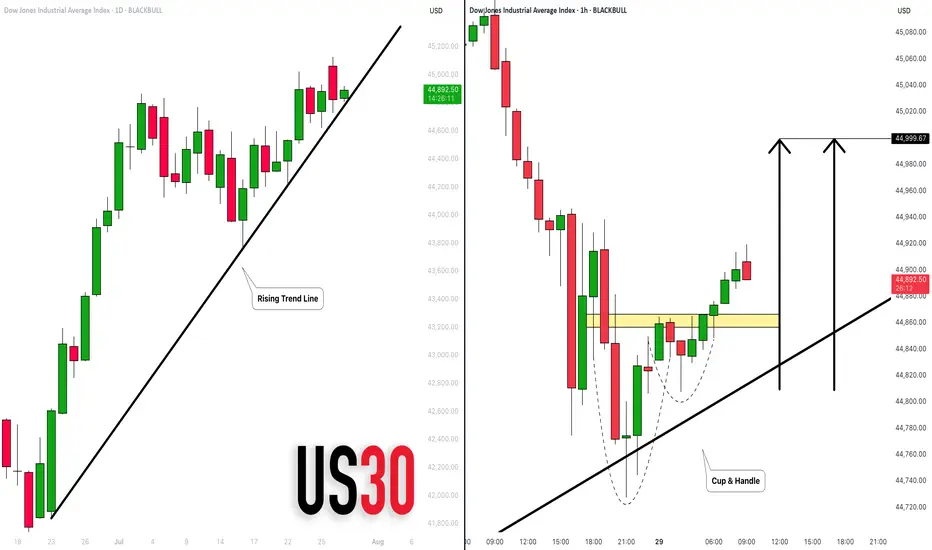
DOW JONES INDEX (US30): Bullish Move From Trend Line
There is a high probability that US30 will continue rising today,
following a test of a solid rising trend line on a daily.
As a confirmation, I see a cup & handle on that after its test
on an hourly time frame.
Goal - 45000
❤️Please, support my work with like, thank you!❤️
US30 DOW JONESwe are stopping losses tiks above previous high, Shorting chasing the last low 1:1, 1:2

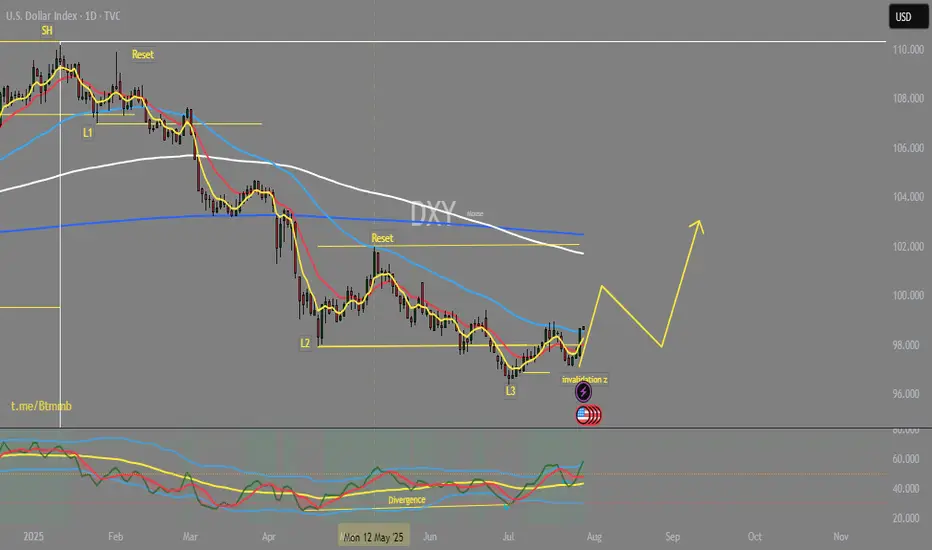
DOLLAR RECOVERYIt is been so down from begin of this year almost and now it is a time for the bulls to catch some breath. The cycle show that we are in the reset phase after the three levels down, which is gonna last until August 15 where we expect another fall.
US30 Forecast: Target Locked, Buy Zones in Sight!Good morning friends ☀️
I've prepared a fresh analysis for US30 (Dow Jones).
My current target is 45,470. Even if the price dips to 45,050 or 44,800, I fully expect it to reach that 45,470 mark.
These levels represent strong buying zones and powerful retest regions—don’t forget that.
Every like from you is my biggest source of motivation to keep posting these insights. 💬📊
Big thanks to everyone supporting with a thumbs-up.

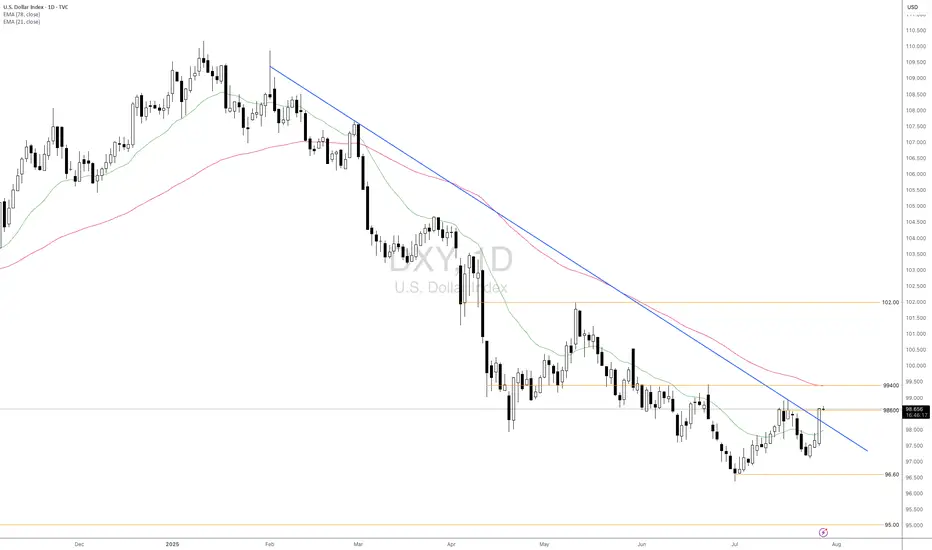
Will DXY Get Supported With Fresh US-EU Trade Agreement?Macro approach:
- The US dollar index has traded mixed since last week, pressured by lingering trade uncertainty and cautious market sentiment ahead of major economic events.
- Dovish Fed expectations and subdued US inflation continued to weigh on the greenback, while news of a fresh US-EU trade agreement and upcoming talks with China contributed to two-way price action.
- Economic data reflected a resilient labor market but flagged moderating US growth, with investors closely watching forthcoming GDP figures and the Fed's policy stance.
- The US dollar index may remain range-bound as markets await catalysts, including the Fed meeting, the 2Q GDP release, and key labor market data.
Technical approach:
- DXY surged and closed above the descending trendline and the resistance at around 98600, indicating an early signal of a shift in the market trend.
- If DXY maintains above 98600, it may retest the following resistance at 99400, confluence with EMA78.
- On the contrary, closing below the descending trendline and EMA21 may prompt a retest of the swing low at 96.60.
Analysis by: Dat Tong, Senior Financial Markets Strategist at Exness
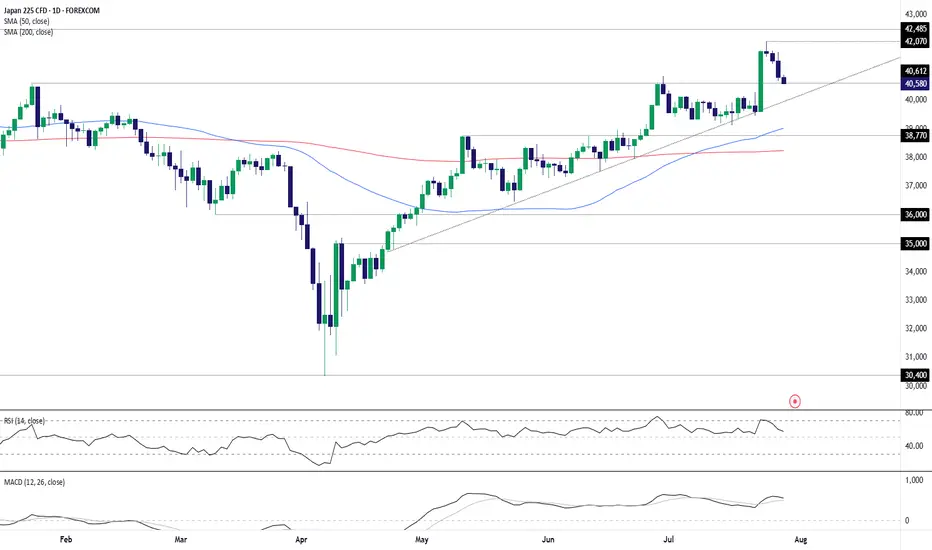
Japan 225 Unwind Pauses at Known SupportThe Japan 225 contract has spent the past three sessions partially unwinding the sharp rally sparked by Japan’s trade agreement with the United States last week, leaving price resting on a known support level. Near-term price action may determine whether bullish or bearish setups hold the upper hand.
If price holds 40162, longs could be established above with a stop beneath for protection, targeting a move back to last week’s high of 42070. Alternatively, a break and hold beneath 40162 would flip the setup, allowing shorts to be established below with a stop above for protection. Uptrend support sits today at 40000, making that an obvious target.
Momentum indicators remain mildly bullish despite the pullback, favouring upside over downside. However, with this setup, price action should carry more weight.
Good luck!
DS
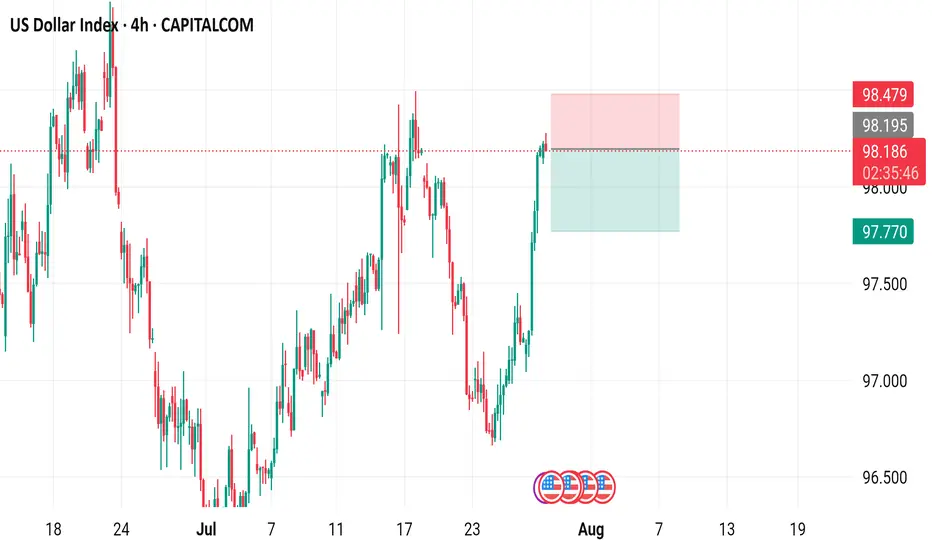
US Dollar Index (DXY) - 4 Hour Chart4-hour chart from CAPITALCOM displays the recent performance of the US Dollar Index (DXY), showing a current value of 98.190 with a slight decline of 0.009 (-0.01%). The chart highlights key price levels, including a recent sell signal at 98.189 and a buy signal at 98.243, with a resistance zone marked between 98.195 and 98.479. The index has experienced fluctuations, with notable drops and recoveries, and is currently trending near the 98.190 level as of July 29, 2025.
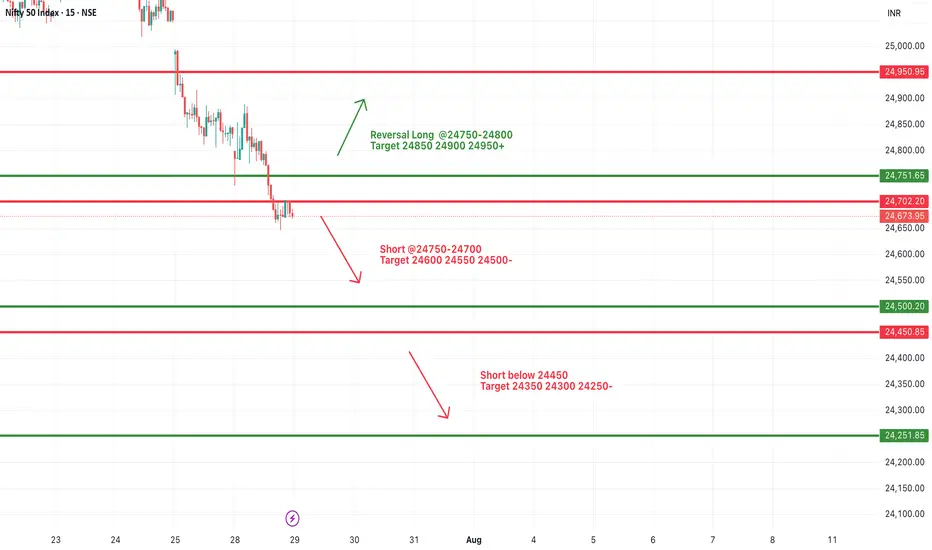
#NIFTY Intraday Support and Resistance Levels - 29/07/2025Nifty is expected to open with a gap-down today, continuing its bearish momentum seen in recent sessions. The index is now trading well below the key resistance zone of 24,750–24,800, with a visible weakness on the chart.
A short opportunity may arise if Nifty stays below the 24,750–24,700 zone. Any pullback toward this level may face selling pressure, and fresh shorts can be considered with downside targets of 24,600, 24,550, and 24,500-.
If the index breaks below the 24,450 level, the selling momentum may intensify, targeting 24,350, 24,300, and 24,250- levels intraday. This level marks a critical support, and traders should closely monitor price action here.
On the other hand, a reversal can only be expected if Nifty reclaims the 24,750–24,800 zone with strength. In that case, a bounce toward 24,850, 24,900, and 24,950+ is possible, but the reversal is only valid if strong bullish price action sustains above 24,800.
[INTRADAY] #BANKNIFTY PE & CE Levels(29/07/2025)Bank Nifty is expected to open with a gap-down, continuing its downside pressure from the previous sessions. The index is now hovering near an important support zone around 56,050–55,950.
If Bank Nifty sustains above the 56,050–56,100 zone after the gap-down open, a reversal rally can be seen with potential upside targets of 56,250, 56,350, and 56,450+. This zone may offer a low-risk long opportunity, provided price action confirms strength.
However, if Bank Nifty remains below 56,050 and especially breaches 55,950, fresh short positions can be initiated with downside targets of 55,750, 55,650, and 55,550-. A close below this support zone can accelerate the selling momentum further.
The market remains in a bearish tone unless a clear reversal structure forms above 56,050.

IS A HIGHER LOW SECURED ON THE DXY? LET'S FIND OUTIn this weekend analysis, I am still paying attention to the higher time frame downtrend on the dollar index while acknowledging the higher low support on the daily chart forming an inverse Head and Shoulders pattern. On the 4H and lower timeframes we have a strong ceiling made up of the 200SMA and 50SMA resistance level and need to break through from the 20SMA Line in the sand support. This weeks trade plan and thesis is for price to hold above the 20 SMA on the 4H timeframe expecting a potential dip to the zone of 97.128 (liquidity zone) and then bounce up to a weekly target of 97.7. This Thesis is INVALIDATED if a candle opens and closes below 97.015. I wish everyone a great trading week. Thank for supporting my publications and trade ideas. Cheers!!!
