Nifty Analysis EOD – July 28, 2025 – Monday 🟢 Nifty Analysis EOD – July 28, 2025 – Monday 🔴
⚡️ Bears Bite Back After a Hopeful Morning Surge
📊 Nifty Summary
Nifty opened with a minor gap-down of 32 points and slipped an additional 67 points in the first 3 minutes, testing the critical support zone of 24,755 ~ 24,729. After marking a day low at 24,732.70, it witnessed a sharp recovery breaching key levels — CDO, Gap, PDC — and touched the CPR BC level. Rejection from there caused a retracement to the mean, followed by another successful attempt breaching CPR BC and IB High. However, it couldn’t sustain above, as profit booking and pressure from a higher time frame bearish trendline dragged the index below the CPR zone and even past the PDL.
Support at 24,780 offered brief relief, but a bearish triangle formed between the HTF trendline and that support and The breakdown at 12:40 led to a clean move, with the pattern target achieved.
🕯 5 Min Time Frame Chart with Intraday Levels
🔁 Trend & Zone Update
📍 Resistance Zone Shifted To: 25,100 ~ 25,120
📍 Support Zone Shifted To: 24,520 ~ 24,480
🧭 What If Plans – 29th July Outlook
🅰️ Plan A (Contra Long Setup)
If market opens inside the previous day range and finds support at 24,700 ~ 24,729,
→ Potential targets: 24,780, 24,815, 24,840
🅱️ Plan B (Trend is Friend – Short Continuation)
If market opens inside range and faces resistance around 24,830 ~ 24,815,
→ Aim for: 24,780, 24,720, 24,640, 24,580
🔄 On-the-Go Plan
If market Gaps Up/Down outside previous day’s range,
→ Wait for IB formation and act based on structure & S/R levels.
🕯 Daily Time Frame Chart with Intraday Levels
🕯 Daily Candle Breakdown
Open: 24,782.45
High: 24,889.20
Low: 24,646.60
Close: 24,680.90
Change: −156.10 (−0.63%)
🕯 Candle Structure Breakdown:
Real Body: 101.55 pts (Red candle, bearish)
Upper Wick: 106.75 pts (Long — rejection from highs)
Lower Wick: 34.30 pts (Defended slightly)
🕯 Interpretation:
Tried to rally above 24,880 but faced aggressive selling. Closed well below open, forming a bearish rejection candle resembling a shooting star. Bears clearly took control after the intraday bounce attempt.
🕯 Key Insight:
Selling pressure visible from 24,880–24,900 zone.
Close below 24,700 keeps bearish tone intact.
Next Support: 24,650–24,620.
Bulls' challenge: Reclaim and close above 24,850.
🛡 5 Min Intraday Chart
⚔️ Gladiator Strategy Update
ATR: 197.91
IB Range: 122 → Medium
Market Structure: Imbalanced
Trades Triggered:
09:27 – Long Entry → 🎯 Target Hit (1:1.5 R:R)
12:40 – Short Entry → 🎯 Target Hit (1:2.5 R:R)
🧱 Support & Resistance Levels
Resistance Zones:
📍 24,729
📍 24,780
📍 24,815 ~ 24,830
📍 24,850
📍 24,920
Support Zones:
📍 24,640
📍 24,580
📍 24,520 ~ 24,480
💭 Final Thoughts
🧠 “Every breakout starts with hesitation — but not every hesitation leads to a breakout.”
Today’s structure showed strong indecision, but sellers used it to dominate.
Monday’s triangle breakdown proved that structure plus patience = power. Keep your bias flexible and trust your levels.
✏️ Disclaimer
This is just my personal viewpoint. Always consult your financial advisor before taking any action.
Market indices

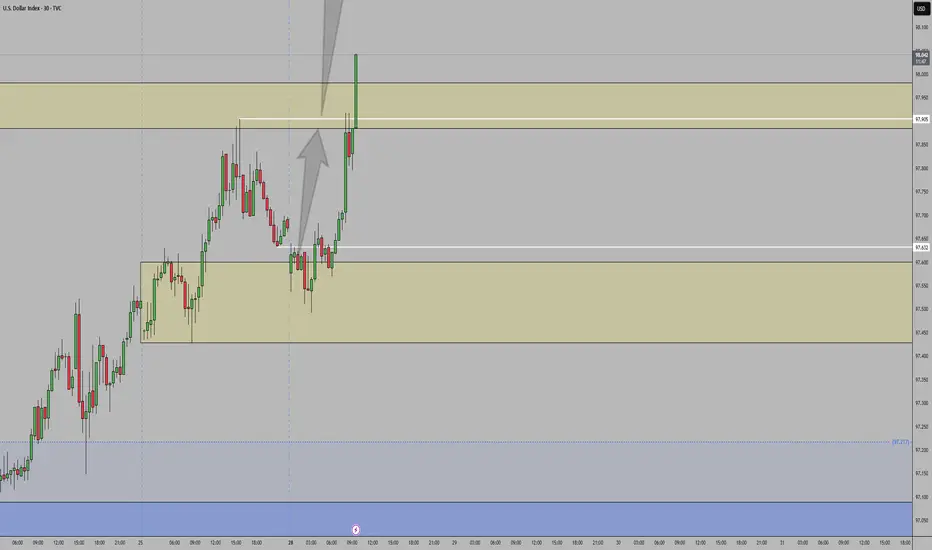
DXY bullishDXY is in the early stage of a bull market, so no one want dollars but in my view but the trend is your friend.
This could be a impulsive 5 of 5 or a B of ABC but both are bullish, another view is that the EURO have been a bad day when the US and EU reach tariff agreement??
The lagging indicators are changing or I hope, but this bullish trend for the Dollar could continue for weeks...

US30 5M DEMAND SETUPPrice was in a clear bullish trend, consistently printing higher highs. Two demand zones were formed, followed by a clean break of structure. I anticipated a reaction at the most recent demand zone and entered on a strong rejection candle, leaving the wick in zone. Execution was on the break of candle with initial targets set at recent highs. However, unexpected momentum drove price beyond target, allowing me to secure a solid 1:2 R:R. Trade managed with discipline and am satisfied with the outcome.

the second confirmationThe modified RSI displayed in the SS indicates that the Nifty's downward trend should be halted for the time being, as it hit the lower ceiling of the Bollinger band today. This could cause the RSI oscillator to move sideways or undergo a correction, which would help it avoid breaking this bollinger band lower ceiling as showed in the SS.
DAX / GER - ANOTHER ROUND OF ENTRY LONGTeam, we have successfully short DAX.GER earlier today with more than 300 points. both target hit
However the market has exceeding the dropping. We decide to go LONG
at the price range 23964-23945
With STOP LOSS at 23865-82
Once the trade hit above 21030-45 - BRING STOP LOSS TO BE
Target 1 at 21080-24115 = please take 50-70% volume target
30% Target remaining at 24165-24196

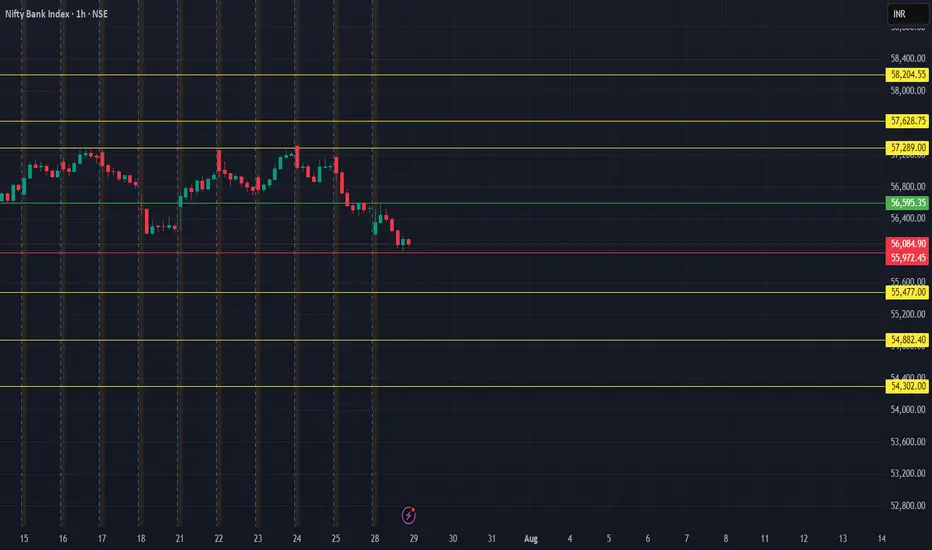
Bank Nifty view - August 2025Bank Nifty is trading around a crucial decision zone as we enter August 2025. The index is currently oscillating near significant technical levels that could dictate the next major directional move. Here’s a detailed outlook based on the latest key levels:
Bearish Scenario
Bank Nifty will turn distinctly bearish if it sustains below 56,040, especially if confirmed by persistent price action and volume. This breakdown could trigger accelerated selling and open up the following downside targets:
First Support Target - 55,475
If the index remains under 56,040, expect initial support around 55,475. This is the first area where some short covering or intraday bounce is possible. However, failure to hold here may invite further downside pressure.
Second Support Target - 54,885
A break below 55,475 paves the way towards the next meaningful support at 54,885. Watch for momentum and volume cues at this level; a lack of buying interest can result in a steeper fall.
Final Support Target - 54,302
Should the selling persist unabated, Bank Nifty could test the final support at 54,302. A close below this level could confirm a deeper corrective move, signaling increased bearish sentiment and potentially inviting broader market weakness.
Bullish Scenario
Bank Nifty would flip decisively bullish on a sustained move above 56,600. This breakout could attract fresh buying interest and propel the index toward the following upside targets:
First Resistance Target - 57,280
A breakout above 56,600 should see the index quickly challenging 57,280. Monitor price behaviour here for signs of continuation or profit booking.
Second Resistance Target - 57,630
Further strength above 57,280 could carry Bank Nifty to 57,630. This level represents short-term resistance and could see volatile swings.
Final Resistance Target - 58,205
Sustained bullish momentum may take the index to 58,205. Watch for signs of exhaustion or reversal as this is a critical resistance zone.
Risk Management:
Adopt a tight trailing stop-loss (TSL) to protect profits, as volatility can cause sharp pullbacks. Remain nimble and prepare to cover positions promptly.
This analysis is intended purely for educational purposes and should not be considered as financial advice.
KSE-100 INDEX TECHNICAL ANALYSIS | 28 JULY 2025KSE-100 INDEX TECHNICAL ANALYSIS | 28 JULY 2025
The KSE-100 index has completed its pullback by trading above the bearish pullback channel (marked light below). It is now taking support from the trend line (dotted blue color line) and facing resistance from the inclined resistance line (dotted red color line). The market opened with a gap up, filled the gap, and took support from the trend line. We expect the index to continue its upward journey, breaking out of the triangle formation formed by the support and resistance lines. We maintain our stance that the index is powerfully bullish and will continue to achieve previously mentioned targets.

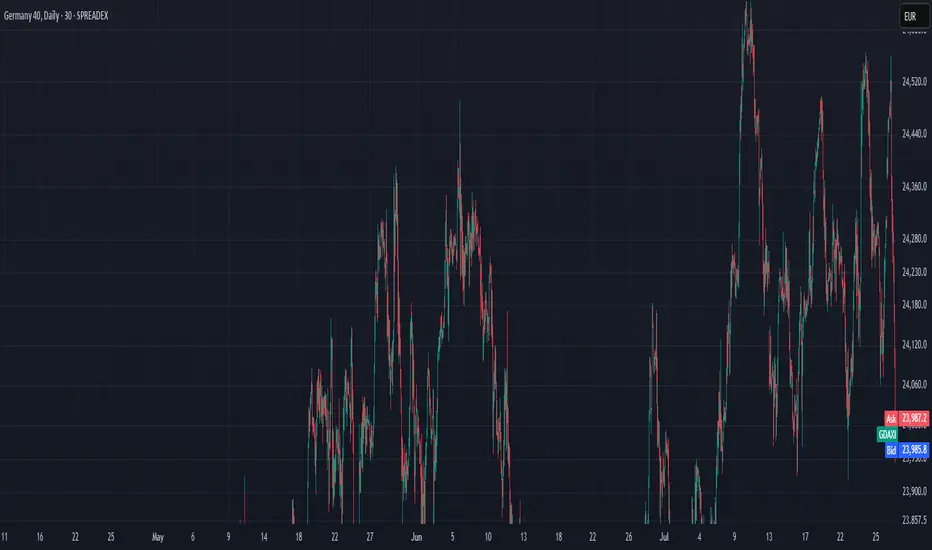
Technical Analysis WeeklyGermany 40 remains in a bullish trend and is currently in a pullback phase. It trades at 24,308, almost identical to its VWAP of 24,307.5. The RSI at 54 suggests a pause in momentum. Support is found at 23,786 and resistance at 24,650.
UK 100 is in an impulsive bullish phase, breaking above previous highs with price at 9,145 well above the VWAP at 8,970. The RSI is at 73, indicating strong buying pressure. Support is at 8,748 and resistance is at 9,101.
Wall Street continues its bullish trend, pausing near recent highs. The price is at 44,880, above its VWAP of 44,445. RSI at 63 confirms steady bullish momentum. Support sits at 43,921 and resistance at 44,880.
Brent Crude remains in a broad neutral trend with short-term range-bound action. Price is at 6,768, just under VWAP of 6,866. RSI at 45 reflects a lack of directional conviction. Support is at 6,717 and resistance at 7,015.
Gold continues to trade sideways within a broad range. It trades at 3,337, nearly equal to its VWAP. The RSI at 47 suggests balance. Support is found at 3,290 and resistance at 3,407.
EUR/USD holds a bullish trend while undergoing a correction. It trades at 1.1740, close to its VWAP at 1.1699. The RSI at 59 shows mild positive momentum. Support is at 1.1585 and resistance at 1.1814.
GBP/USD is in a bullish trend but under corrective pressure and seemingly turning rangebound. The price is 1.3433, slightly below the VWAP of 1.3511. RSI is at 42, hinting at waning momentum. Support is 1.3336, resistance at 1.3687.
USD/JPY continues in a neutral trend but could be about to break higher, currently ranging around 147.66 and VWAP at 147.00. RSI at 57 shows a modest bullish bias after having pulled back from overbought territory. Support is at 144.54 and resistance at 149.46.
"We are going higher than 45,135.78The Dow Jones has the potential to start an upward move from the 44,811.77 and 44,732 levels, aiming for 45,135.78." CMCMARKETS:US30

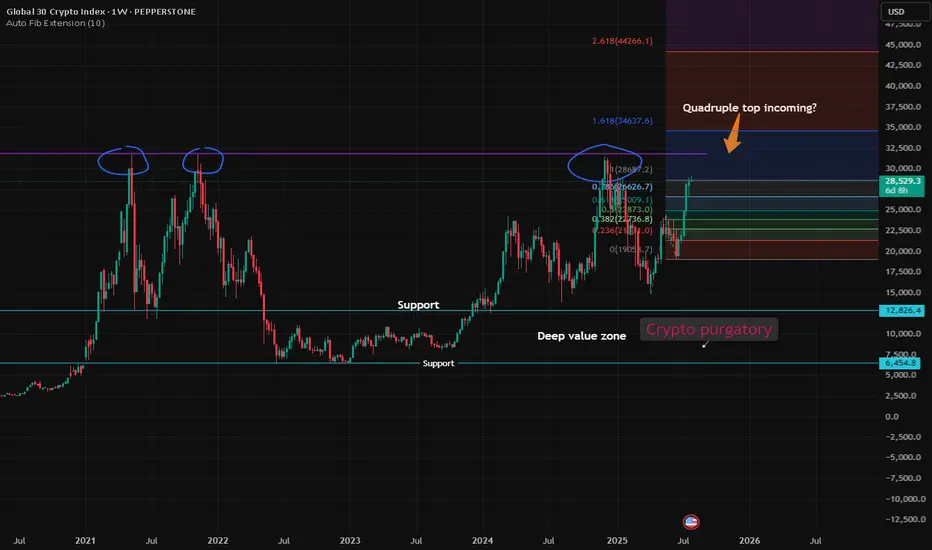
Crypto30 Ascension and purgatory, Tops and bottom.The idea is that crypto has been trading in one great rectangle pattern—
it’s all a giant range.
When the top is in, many tokens or vaporware retrace to zero, while others retain some value.
There’s the possibility of a cyclical quadruple top in the near term.
Once the top is confirmed, it’s back to purgatory, where scams, vaporware, and low-adoption projects get discarded before the next ascension.
This is what I’m looking at to gauge when to take profits
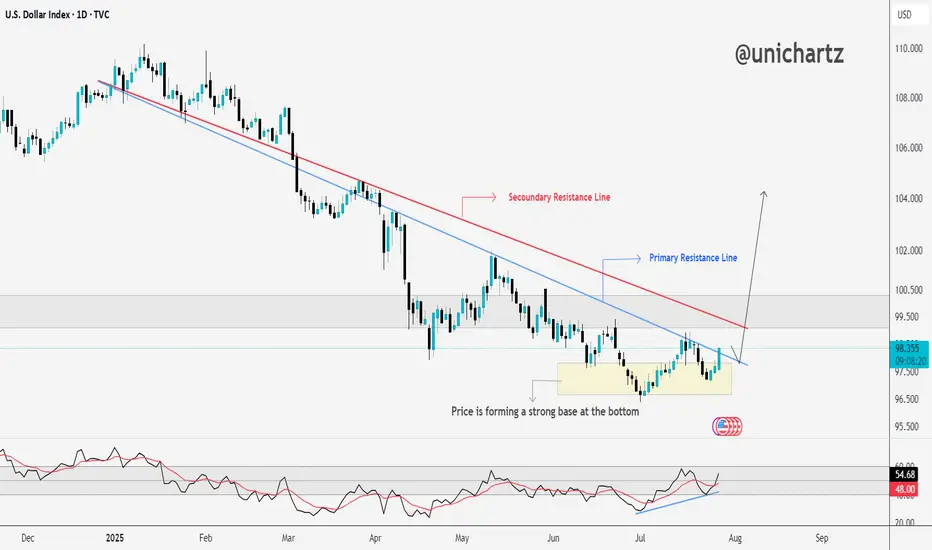
DXY Approaching Key Resistance — Trend Reversal Ahead?The DXY is forming a strong base at the bottom, showing clear signs of accumulation after a long downtrend.
Price has started pushing upward and is now approaching the secondary resistance line. A breakout here could open the path toward the primary resistance zone, which has capped rallies in the past.
The RSI is also trending higher, supporting this potential move.
If bulls clear the red resistance line, momentum could accelerate quickly.
DYOR, NFA
Bulls and Bears zone for 07-28-2025Last week 4 out of 5 sessions S&P 500 made new ATH. However they were all trading within a tight range.
Level to watch: 6434---6436

DXY - trade - market structure DXY - trade - market structure , easy setup, clean setup , good probability, if this happen is a big win, use risk and trade managment
Getting ready for new highs Price tested the 45000 resistance which is the final resistance before new highs, it is now going down to test the trend line support of the uptrend channel
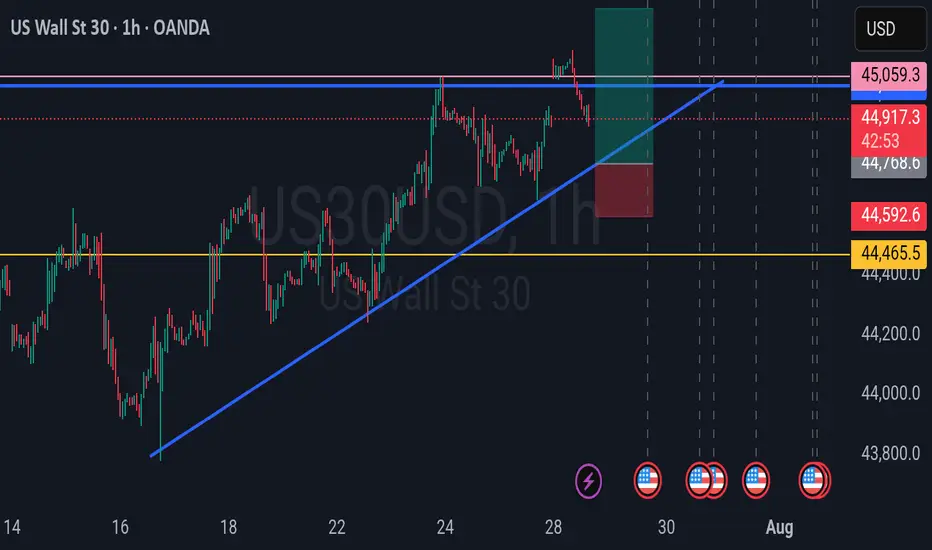
US30 Weekly Forecast – Bullish Bounce or Breakdown?Hope everyone had a great weekend!
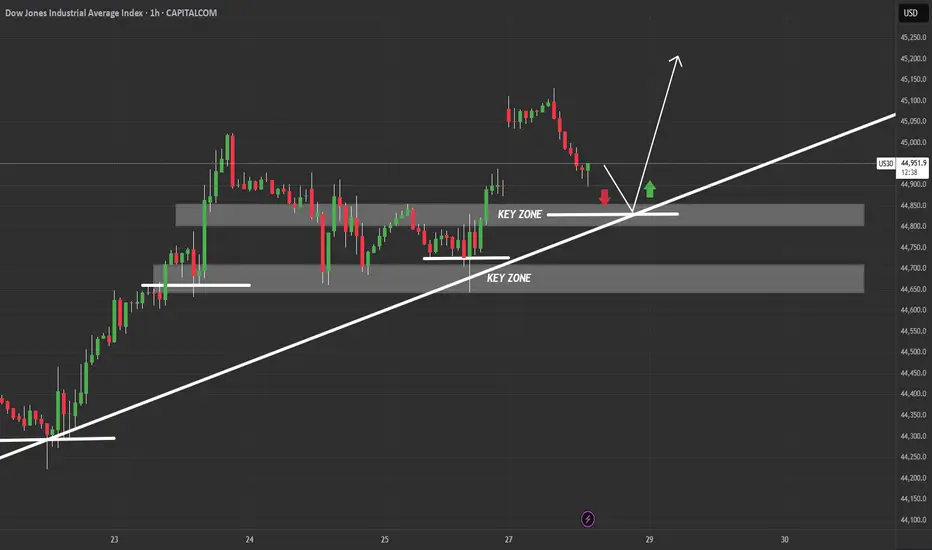
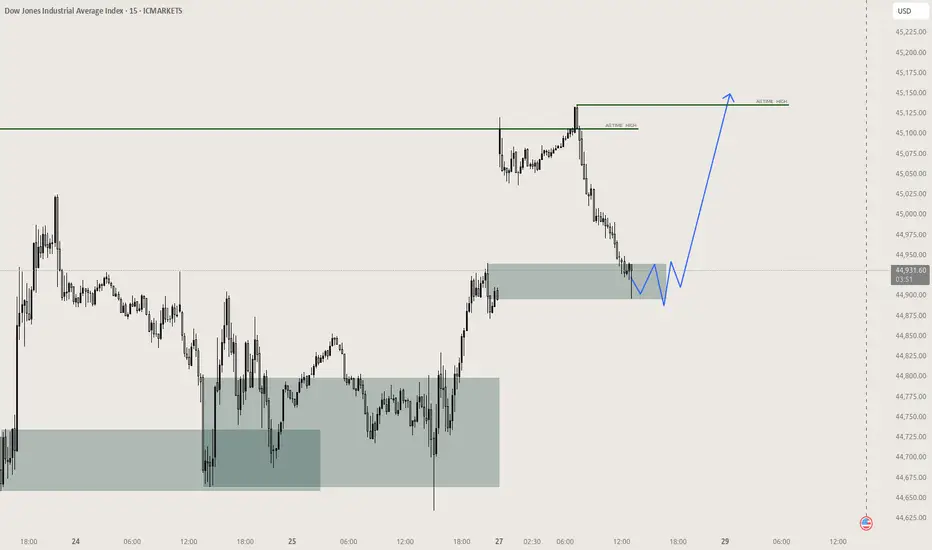
This chart outlines a critical US30 intraday structure with price currently pulling back into a key confluence zone composed of:
A rising trendline from July 23rd
Two stacked demand zones, the upper around 44,850 and lower near 44,700
Bullish Scenario (Preferred Bias):
If price respects the trendline and upper key zone, we may see a bullish continuation targeting the 45,150–45,250 range.
The clean bounce zone, marked by the green arrow, suggests smart money might defend this level.
Watch for bullish engulfing or low-volume traps near 44,850–44,880 to confirm entry.
Bearish Scenario (Alternate Play):
If price fails to hold the trendline, and breaks below the 44,850 key zone with momentum, expect a drop into the lower zone (44,650–44,700).
A breakdown below this lower demand could shift the bias entirely, opening the door for a deeper correction back into the mid-44,000s.
Weekly Playbook:
Early week: Monitor the reaction at the upper key zone for sniper long opportunities with tight stops.
Mid to late week: If structure fails, flip bias and look for supply rejections on retests for shorts.
Risk: Account for FOMC/major U.S. news events that may introduce volatility traps around these zones.
Verdict: Stay patient. Let price dictate bias at the trendline. If it holds, this could be a textbook bounce continuation setup.
US 500 – Potentially A Pivotal Week Ahead The US 500 index registered a new record closing high on Friday at 6396 continuing a bullish trend that has yet to show many signs of faltering. The Monday open has seen this move extend as traders digest the positive news flow from the weekend that a US/EU trade deal has been agreed after President Trump and EU Commission head Ursula Von der Leyen, met in Scotland on Sunday. This has seen the US 500 index rally another 0.4% to a new high of 6429 (0730 BST).
However, the week ahead could be a pivotal one for the direction of US stock indices over the remainder of the summer, and in this regard, it is perhaps surprising that market volatility measures, such as the VIX (fear Index), are back to their lowest levels since late March, indicating limited trader concern for what lies ahead. Although, things can change very quickly.
In many ways the week ahead is one that has it all, including a new round of US/China trade talks which start today, a Federal Reserve (Fed) rate decision, key tech earnings, tier 1 US data releases and on-going trade/tariff discussions. More than enough to ensure there is the potential for US 500 price action to become increasingly volatile as the week progresses.
Looking forward, Wednesday could be a very busy day, with the Fed Interest Rate Decision released at 1900 BST and quickly followed at 1930 BST by the press conference led by Chairman Powell, who has been under intense political pressure in the last 10 days. While the Fed are expected to keep rates unchanged, traders may be interested to see which policymakers were keen to vote for a cut, as well as whether Chairman Powell’s comments indicate a September rate reduction may be more likely than currently anticipated.
Then, later Wednesday evening Microsoft, Qualcomm and Meta release their earnings updates after the close, with Amazon and Apple’s results due after the market close on Thursday. These releases could be crucial for sentiment towards the US 500, with particular focus being paid to what these companies say about future revenue and tariff issues, as well as the specific performance of AI and cloud services.
This only takes us to the middle of the week, which is where the tier 1 US economic data releases take over, with the PCE Index, the Fed’s preferred gauge of inflation, due on Thursday at 1330 BST, and then the all-important Non-farm Payrolls update on the current health of the US labour market released on Friday at 1330 BST. US 500 index traders may well be sensitive to the outcome of both of these prints.
That’s still not all. Friday’s US employment update coincides with President Trump’s tariff deadline which could add to US 500 volatility into the weekend.
Wow, I did say it’s a week that has it all!
Technical Update: New All-Time Highs Posted Again
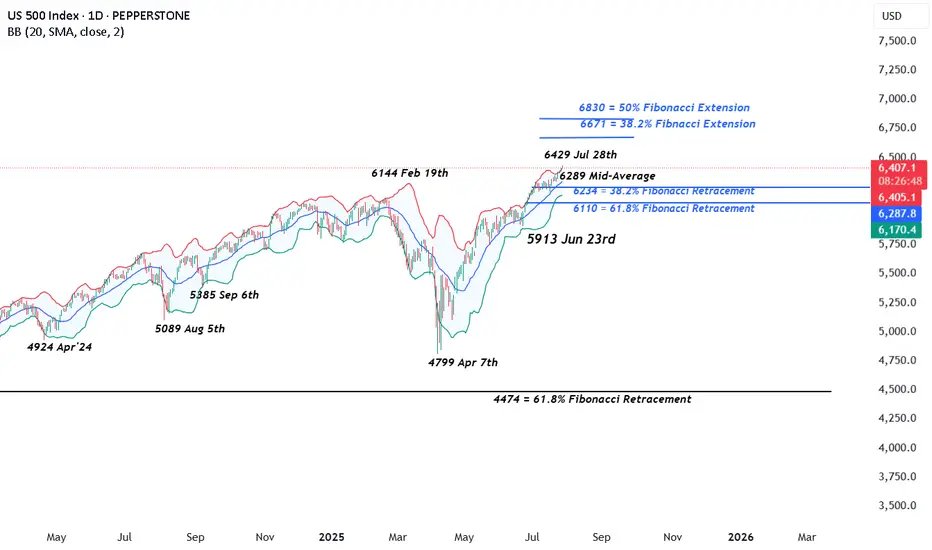
It looks as if the latest US 500 index activity is maintaining the current positive trending themes after another all-time high was posted this morning at 6429. This could skew risks towards the further development of the pattern of higher price highs and higher price lows that has materialised since the April 7th downside extreme at 4799 was seen.
However, it must be remembered, these moves do not guarantee this price activity will continue, so traders may find it useful to assess the possible support and resistance levels that could influence price activity moving forward across what is set to be a very busy week of events.
Possible Support Levels:
If any US 500 price weakness does materialise across the week ahead with the potential to develop into a more extended phase of declines, a support level that traders may consider worth monitoring could be 6289.
6289 is equal to the current level of the rising Bollinger mid-average. Closing breaks below 6289 might suggest a more extended phase of weakness is possible, opening the potential for moves back to 6234, which is the 38.2% Fibonacci retracement, possibly further if this level in turn gives way.
Possible Resistance Levels:
Having been capped by the 6429 all-time high this morning, sellers may continue to be found at this level, so this might prove to be the first potential resistance if fresh attempts at price strength develop over the coming week.
It may be helpful for traders to watch how this 6429 level is defended on a closing basis, as successful closing breaks might suggest a further extension of the uptrend pattern currently evident in price activity.
Such closing breaks higher may well suggest price strength towards 6671, which is the 38.2% Fibonacci extension level of the February 19th to April 7th sell-off.
The material provided here has not been prepared accordance with legal requirements designed to promote the independence of investment research and as such is considered to be a marketing communication. Whilst it is not subject to any prohibition on dealing ahead of the dissemination of investment research, we will not seek to take any advantage before providing it to our clients.
Pepperstone doesn’t represent that the material provided here is accurate, current or complete, and therefore shouldn’t be relied upon as such. The information, whether from a third party or not, isn’t to be considered as a recommendation; or an offer to buy or sell; or the solicitation of an offer to buy or sell any security, financial product or instrument; or to participate in any particular trading strategy. It does not take into account readers’ financial situation or investment objectives. We advise any readers of this content to seek their own advice. Without the approval of Pepperstone, reproduction or redistribution of this information isn’t permitted.
Analysis on the DXY – EURUSD RelationshipHello traders,
Here’s an analysis that can be useful for both short-term and swing trades on EURUSD and DXY. Our trading team’s calculations are as follows:
Analysis on the DXY – EURUSD Relationship
Currently, DXY is at 98.200. Historical statistical data indicate that if DXY declines toward 96.300, there is approximately a **1.55% probability of an upward move** in EURUSD.
Based on this scenario:
Current EURUSD level: 1.16500
Projected target level:1.1830
While the correlation data show a strong inverse relationship, it’s important to note that periodic deviations can occur in the market. Therefore, this analysis should be considered a statistical projection only, not a guaranteed outcome.

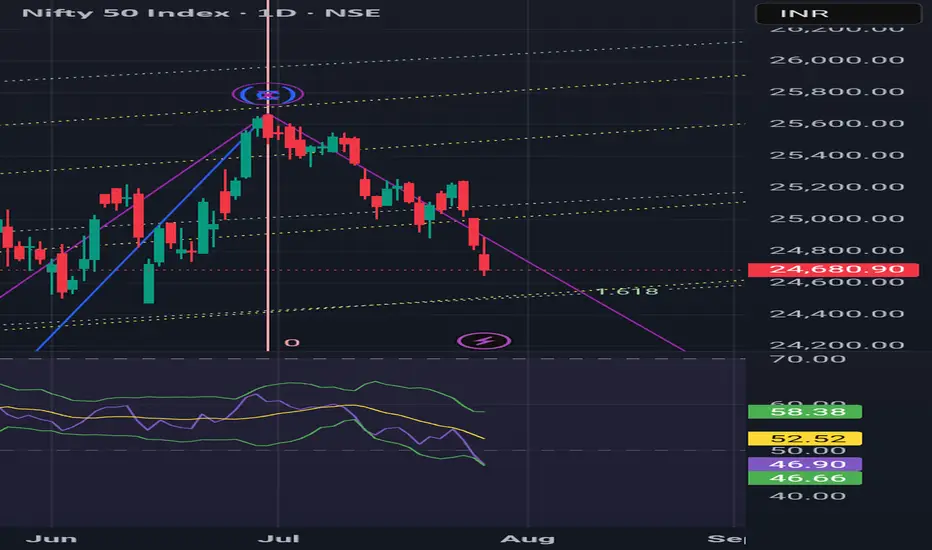
Nifty 50 in Downtrend !!The Nifty 50 has been falling since last 4 weeks . The Index has broken 50 EMA on Daily chart today. The next support is shown in weekly chart.Nifty can show reversal after taking support from this level.

We Got The Deal - Time To Sell The NewsOkay, so we have the long-awaited deal between the US and the EU. After a large up-gap was announced last night, it now seems as if a “sell the facts” scenario is unfolding.
Such a wave of selling would also fit in well with the typical seasonal weakness that we often see in the markets from August onwards.

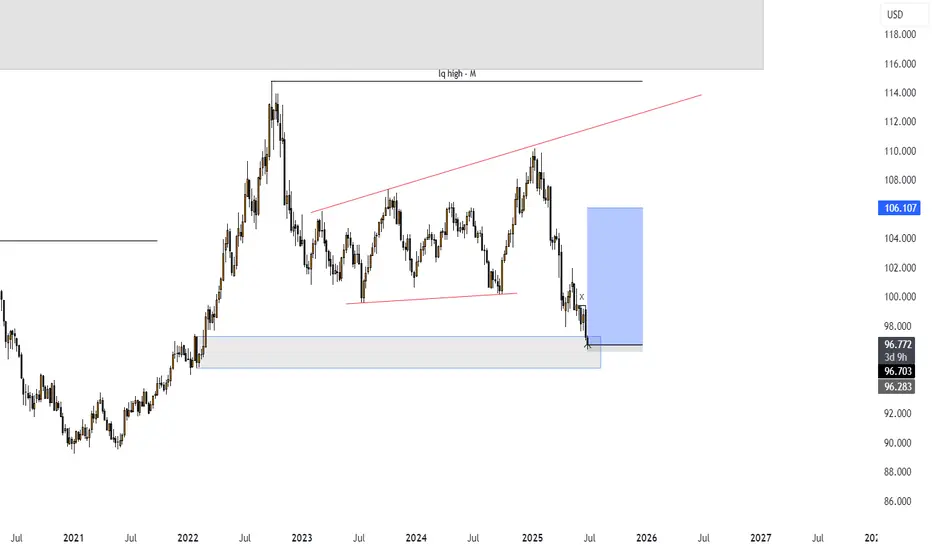
DXY - ABC Move still in playDXY has been moving not so much on technical factors lately but more so with what Mr. Trump says, we still could see a move lower with an ABC pattern.
Good Luck

Bollinger band indicates that we might see a recovery soon. Bollinger band in a beautiful tool of Technical analysis. There are three lines in it. The upper bandwidth line, the middle line and the lower band width line.
As you can see in the chart. Whenever the stock or an index price touches or crosses the upper line the indication it gives is that the market is overbought and there is an imminent selling pressure.
Middle line indicates either resistance or support depending on the position of the candle within the band. It further indicates that Middle line will be support when the price is above it. It also indicates that middle Bollinger band will be a resistnace when the candles are below it.
Lower bandwidth line indicates a support zone. When the candles touch or cross it the indication it gives is that the market is oversold and there can be an imminent up move once this phenomenon happens.
Bollinger band in like a channel or a parallel chanel but a more accurate one and a more asymmetric one.
Currently you can see in the chart that Bollinger band has not only touched but also crossed the bottom bandwidth. This is an indication of an over sold market. Thus the indications we get from this tool are that there are very high chances for a short covering recovery or relief rally.
The indication is in sync with Tariff deadline which is tomorrow. Thus any positive announcement on that front can also initiate a strong or mild recovery rally. Thus we might see a bottom formation and recovery rather sooner than later.
Current Nifty closing is at:24680.
Upper band width is at: 25683 (This zone will work as strong resistance zone).
Mid Bandwidth is at: 25217 (This zone will be a Strong resistance).
Mother Line: 24942 (Strong Resistance).
Lower band width is at: 24750 (Weak Resistance).
Nearby support: 24501 (Support).
Father Line: 24157 (Strong Support).
It is a good time to reshuffle your Portfolios and initiate fresh buying in the blue-chip stocks which might be available at a good valuation.
Disclaimer: The above information is provided for educational purpose, analysis and paper trading only. Please don't treat this as a buy or sell recommendation for the stock or index. The Techno-Funda analysis is based on data that is more than 3 months old. Supports and Resistances are determined by historic past peaks and Valley in the chart. Many other indicators and patterns like EMA, RSI, MACD, Volumes, Fibonacci, parallel channel etc. use historic data which is 3 months or older cyclical points. There is no guarantee they will work in future as markets are highly volatile and swings in prices are also due to macro and micro factors based on actions taken by the company as well as region and global events. Equity investment is subject to risks. I or my clients or family members might have positions in the stocks that we mention in our educational posts. We will not be responsible for any Profit or loss that may occur due to any financial decision taken based on any data provided in this message. Do consult your investment advisor before taking any financial decisions. Stop losses should be an important part of any investment in equity.

DXYDXY Bullish COT Setup
Commercials: Net-long ~3,988 → smart money positioning for strength
Large Specs: Net-short ~3,451 → bearish bias, potential squeeze risk
COT Index: 94.5% → near historical extreme, signaling possible trend shift