Dow Jones Index Analysis (US30 / Dow Jones):🔹 The index recently tested its all-time high at 45,152 USD, and a short-term correction may occur to retest the PDH level at 44,950 USD.
1️⃣ If strong bullish momentum leads to a break and close above 45,150 USD, the price is likely to push toward forming a new high.
2️⃣ However, a break and close below 44,620 USD could trigger a move toward 44,240 USD.
🔻 A confirmed break below this zone would resume the bearish trend and open the way toward 43,900 USD.
⚠️ Disclaimer:
This analysis is not financial advice. It is recommended to monitor the markets and carefully analyze the data before making any investment decisions.
Market indices

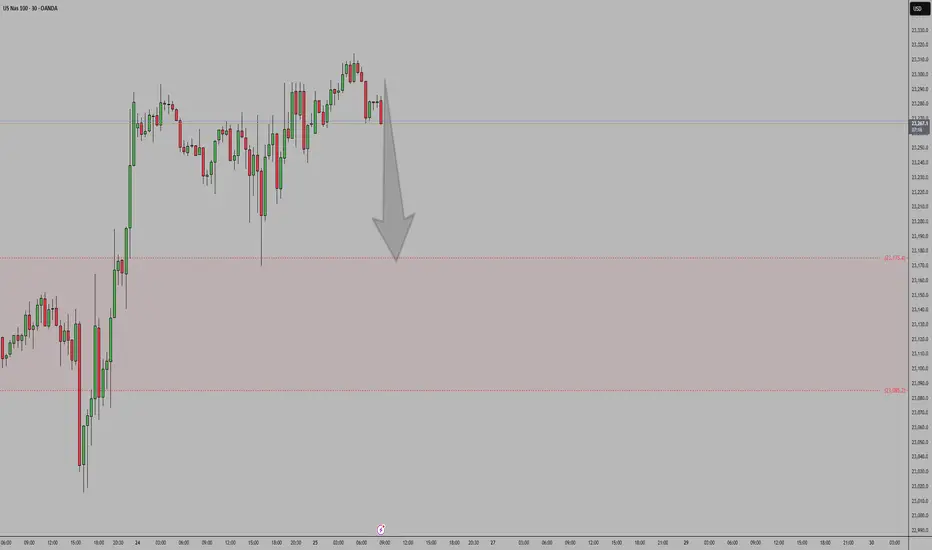
Nasdaq bearish nasdaq after taking out liquidity short term based and more bearish momentum can be expectected .
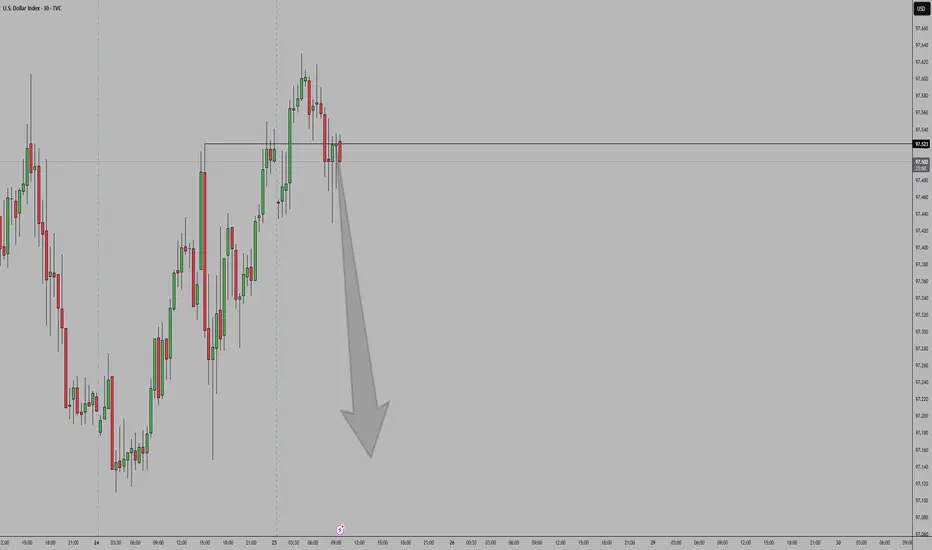
DXYThe U.S. Dollar Index (DXY) continues to exhibit a bearish outlook driven by a combination of technical weakness and shifting macroeconomic fundamentals. Market expectations for Federal Reserve rate cuts, coupled with softer U.S. economic data and declining demand for the dollar as a safe-haven asset, have weighed heavily on the index. Technically, the DXY remains below key moving averages, with momentum indicators showing sustained weakness. Unless there is a significant shift in sentiment or a surprise in monetary policy direction, the bias remains to the downside over the near to medium term.
Nasdaq Index Analysis (US100 / NASDAQ):The Nasdaq index continues its medium- to long-term uptrend and has recently reached a new high at 23,466 USD.
1️⃣ A break and close below 23,200 USD could lead to a pullback toward 23,000, followed by 22,920 USD.
2️⃣ However, if the price holds above 23,330 USD, further bullish continuation is expected, potentially leading to a new all-time high.
⚠️ Disclaimer:
This analysis is not financial advice. It is recommended to monitor the markets and carefully analyze the data before making any investment decisions.

No FOMOSPY does its thing and will keep moving higher but cautious on low volume push.
To keep it simple, if there is a daily close back inside the master trendline sometime this week, a short setup will be adequate to the previous all time high @ 6095

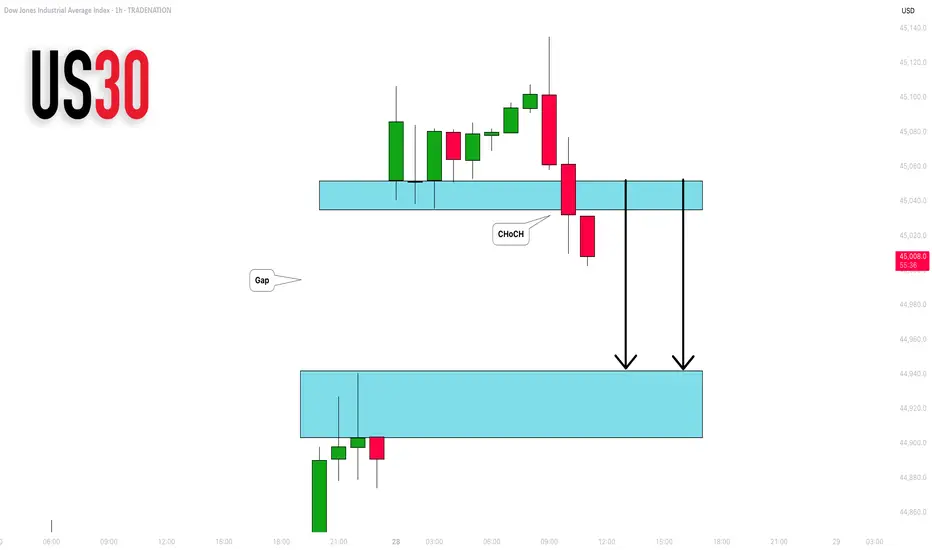
DOW JONES INDEX (US30): Another Gap For Today?
I see another gap up opening on US30 Index.
I think it will be filled today. A formation of an intraday
bearish CHoCH on an hourly time frame suggests
a highly probable bearish continuation.
Goal - 44943
❤️Please, support my work with like, thank you!❤️
I am part of Trade Nation's Influencer program and receive a monthly fee for using their TradingView charts in my analysis.

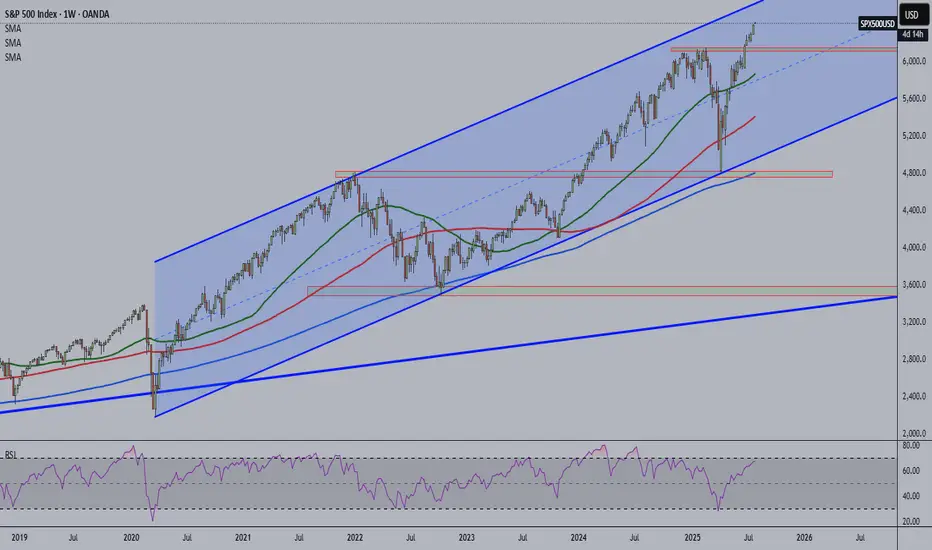
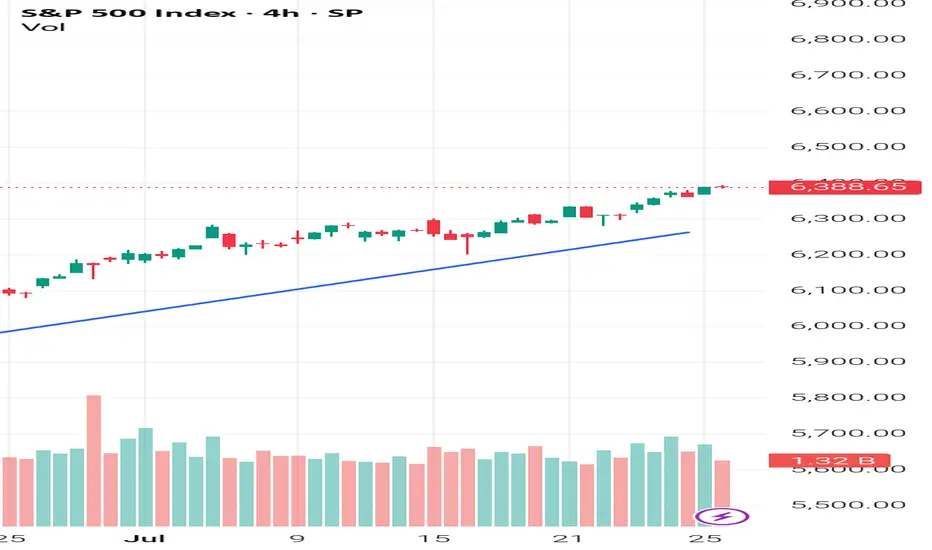
Overbought alert? The S&P500 is nearing weekly and monthly bullish channel resistance. Price has remained within this channel since 2020.
PEPPERSTONE:US500 VANTAGE:SP500
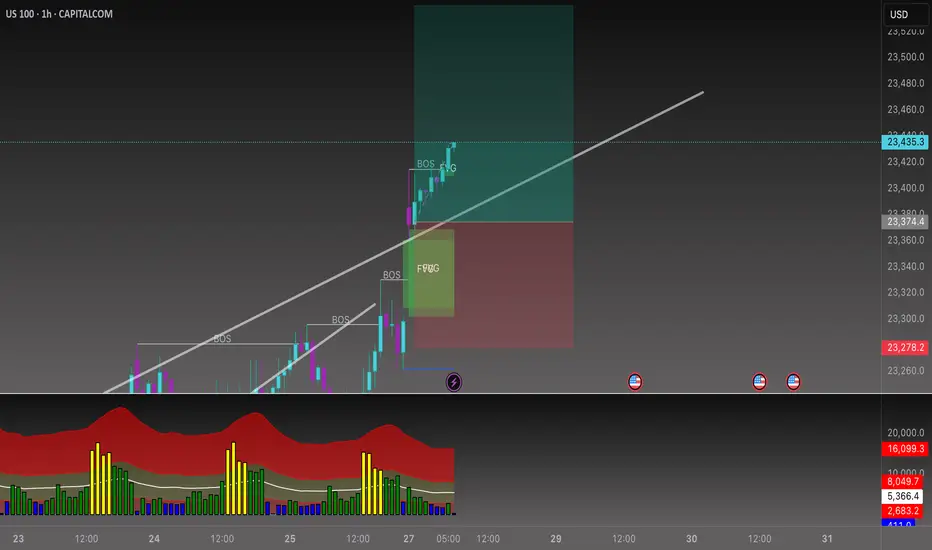
Beyond the Chart – NAS100 Through Technicals & Fundamentals📊 CAPITALCOM:US100 Analysis
Today, NAS100 opened with a huge gap up following former President Trump’s announcement that the U.S. has officially reached a trade agreement with the European Union.
🕳️ After price rejected the gap zone, and volume gets low low. I’m now looking for a potential test of the 23,540 level.
💼 With Q2 earnings season kicking off, stock-moving news will be hitting fast. While retail traders might scramble to catch up, smart money is already positioning for surprise earnings beats.
Stay sharp, this week could set the tone for the next major move.

Nifty50 Index Monthly expiry week Grid projection.(July 2025)Hello everyone !!
Welcome to Nifty50 Index Grid projection for last week of July (Monthly expiry week)
this Grid is based on the Expected move reverse engineered from option pricing for the week
our market has been breaking the lows
today its been the lowest in the whole month
so expecting this to be not only the day's low but also the Month's low
Thank you
Grid-_-Work's.
safety first

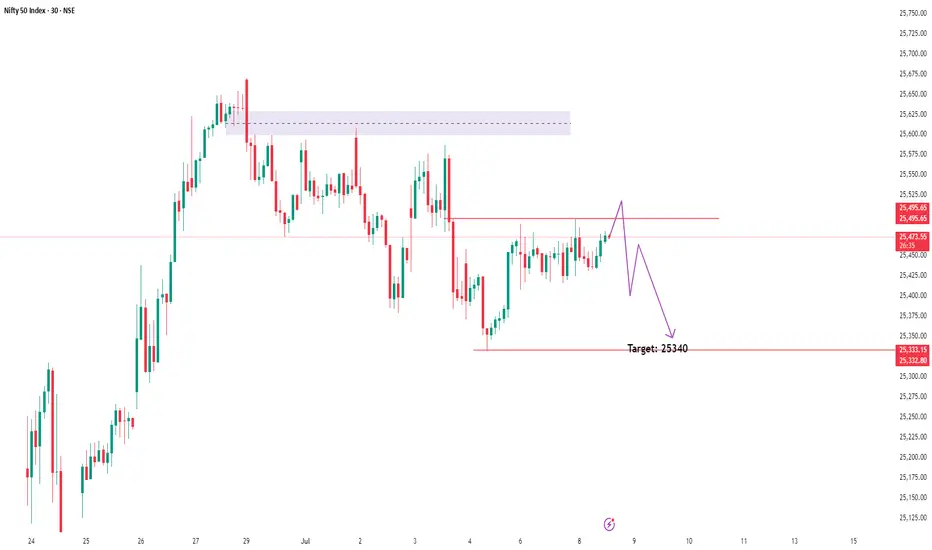
Bearish Outlook on Nifty – Based on Smart Money ConceptI'm seeing a clear downside setup on Nifty, with Smart Money indicating distribution and the market transitioning into a bearish trend.
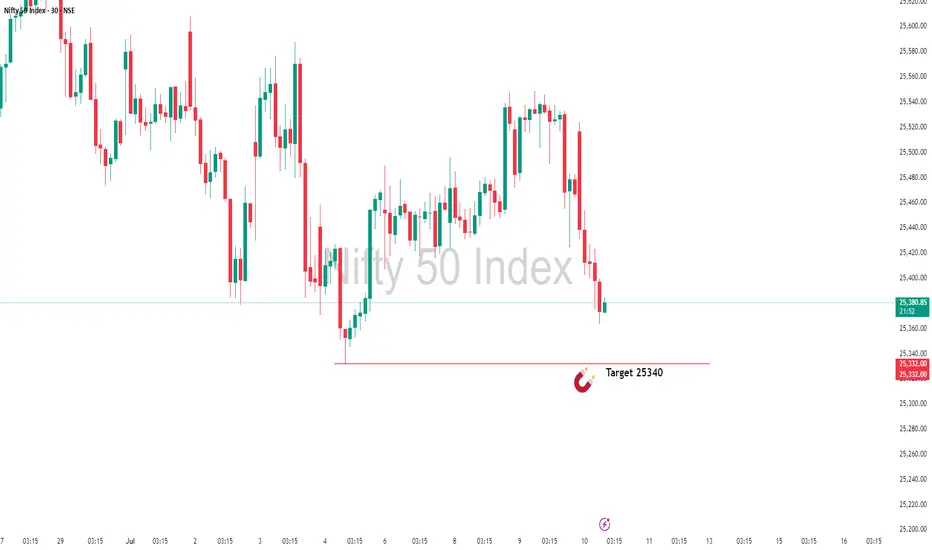
📉 Target: 25,340
📍 Current Price: 25,474
🔍 Reasoning: Clear signs of institutional distribution and lower highs/lows forming. Smart Money is exiting, suggesting the beginning of a deeper correction.
Will monitor closely for any change in structure, but as of now, bias remains strongly bearish.
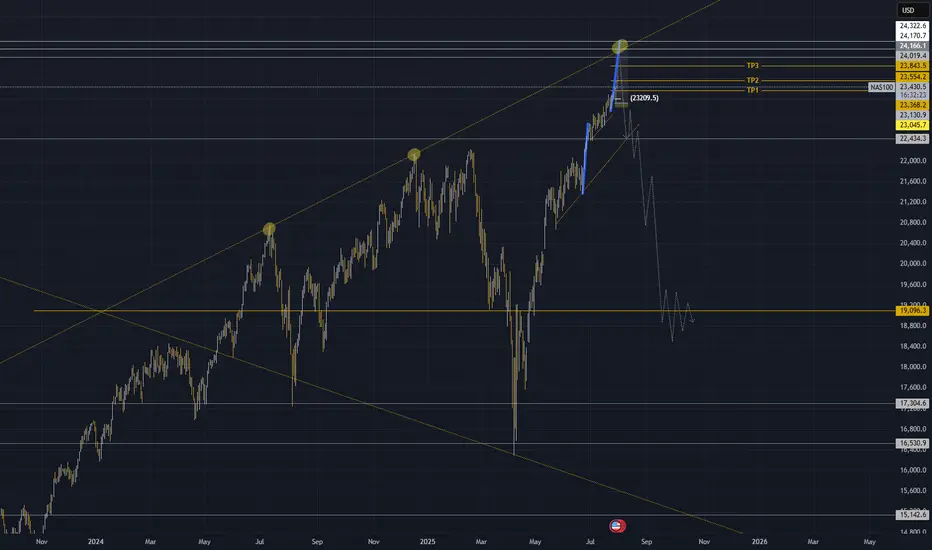
NAS100 Technical Outlook — Final Impulse Before the Fall?
The NAS100 has just completed its 5th touch on a long-term ascending trendline, forming a clear rising wedge pattern. Historically, each touch of this structure has triggered significant bearish reversals — and this time looks no different.
🔹 However, before the major drop, I'm expecting a final impulsive wave of around 1,000 pips— a last bullish move that could stretch toward the 24,300–24,400 zone. This would complete the wave structure and offer a strong sell opportunity.
🔻 After that, a deeper correction is likely, targeting the 19,000 area, which aligns perfectly with:
The midpoint of the wedge on the daily chart
A strong historical support zone
A potential area for medium-term consolidation
⚠️ As long as price remains below 24,400, the bearish scenario remains valid. Any daily close above that level would force a re-evaluation.
🧠 This setup reflects a classic distribution phase followed by a high-probability breakdown.
Almost There: Nifty Closing in on My Target Zone 25340In this update, I’m revisiting the setup I shared earlier that points towards NIFTY’s next potential target at 25,340. The analysis covers the key levels, price action structure, and the factors supporting this move. This setup is based on clear technical confirmations and disciplined risk management — not just speculation.
Please remember to follow your own plan and manage your trades responsibly. This is for educational purposes and not financial advice. Let’s see how the price action unfolds!
NIFTY 24740: Smart Money Signals Bearish Move IncomingThe directional bias is clear – bearish – and I'm currently waiting for a precise setup to present itself. Based on the Smart Money Concept, we could be looking at a potential short opportunity around the 24740 zone.
📍 Once the setup is confirmed, I’ll be sharing the exact entry and stop-loss levels with you.
Stay tuned – patience here is key. Let the market come to us.

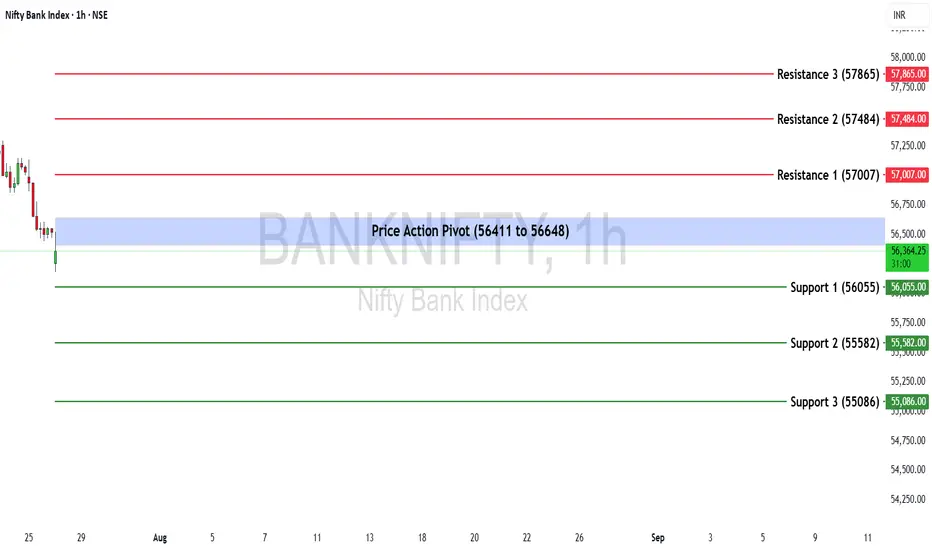
Bank Nifty Weekly Insights: Key Levels & TrendsBank Nifty ended the week at 56,528.90, registering a marginal gain of +0.44%.
🔹 Key Levels for the Upcoming Week
📌 Price Action Pivot Zone:
The critical zone to monitor for potential trend reversals or continuation lies between 56,411 and 56,648.
🔻 Support Levels:
Support 1 (S1): 56,055
Support 2 (S2): 55,582
Support 3 (S3): 55,086
🔺 Resistance Levels:
Resistance 1 (R1): 57,007
Resistance 2 (R2): 57,484
Resistance 3 (R3): 57,865
📈 Market Outlook
✅ Bullish Scenario:
If Bank Nifty sustains above the pivot zone (56,648), it may trigger renewed buying interest, potentially pushing the index toward R1 (57,007) and higher levels like R2 (57,484) and R3 (57,865).
❌ Bearish Scenario:
A breakdown below the lower end of the pivot zone at 56,411 may attract selling pressure, dragging the index towards S1 (56,055) and possibly lower levels like S2 (55,582) and S3 (55,086).
Disclaimer: lnkd.in
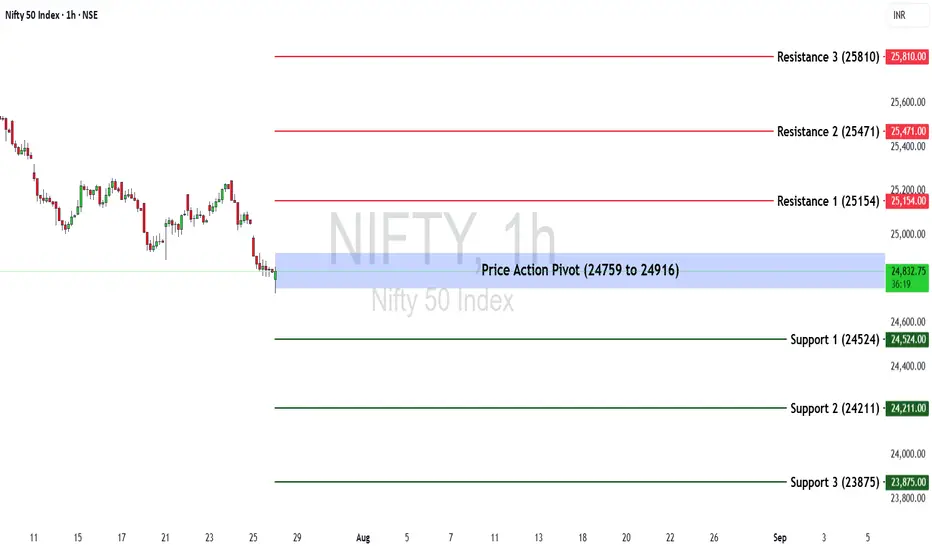
Nifty 50 at a Turning Point? Key Levels & Market Outlook AheadThe Nifty 50 ended the week at 24,837.00, registering a decline of -0.53%.
🔹 Key Levels for the Upcoming Week
📌 Price Action Pivot Zone:
24,759 to 24,916 – This range is crucial for identifying potential trend continuation or reversal. A move outside this zone could set the directional tone for the coming sessions.
🔻 Support Levels:
Support 1 (S1): 24,524
Support 2 (S2): 24,211
Support 3 (S3): 23,875
🔺 Resistance Levels:
Resistance 1 (R1): 25,154
Resistance 2 (R2): 25,471
Resistance 3 (R3): 25,810
📈 Market Outlook
✅ Bullish Scenario:
A sustained move above 24,916 (top of the pivot zone) may attract buying interest. If this momentum builds, the index could test R1 (25,154), and potentially advance towards R2 (25,471) and R3 (25,810).
❌ Bearish Scenario:
Failure to hold above 24,759 (bottom of the pivot zone) may lead to further downside pressure. In such a case, Nifty may move towards S1 (24,524), and deeper support levels like S2 (24,211) and S3 (23,875)
Disclaimer: lnkd.in
Weekly Review: Forex fundamental analysis The week starting Monday 21 July was another week of positive sentiment, the S&P continues to hit all time highs and the VIX remains anchored below 17.
The upbeat mood was propelled by an announcement of a tariff deal between the US and Japan. The market now thinks it's likely deals with EUROPE and CHINA will soon follow. All the while, earnings season continues to quietly slip under the radar (it's worth noting the upcoming week does have a plethora of huge companies reporting).
An election in JAPAN caused uncertainty, giving the JPY a bout of strength at the beginning of the week. I then found it difficult to decide if the US / JAPAN trade deal would be positive or negative for the JPY, ultimately the overall positive risk tone prevailed and the JPY ended the week softly.
It was also a week of two halves for the USD, the interest rate battle between the president and chair Powell continues to cause uncertainty. The FOMC meeting and the upcoming slue of reg flag US data will be very interesting. And could determine the underlying bias for the USD for the rest of the summer.
The EUR and GBP were prominent throughout the week, a 'hawkish hold' from the ECB, combined with positive PMI data and hopes of a trade deal, all contributed to positive sentiment for the EUR.
On the opposite end of the scale, the GBP ended the week bruised, weakened by another bout of 'soft data'. Which opened the door to potential 'relative fundamental' GBP short trades.
Finally, 'fairly hawkish' comments from the RBA'S BULLOCK keeps the AUD high on my to long list.
On a personal note, it was a week of two trades. I perhaps was a little bold in thinking the JPY post election strength was overdone, entering an AUD JPY long which stopped out. You might often think it's frustrating when a trade stops out, but then eventually hits the original profit target. Personally, I take the positive view that at least my original bias was proved correct.
The week was saved on Friday with a EUR GBP long, post GBP retail sales data and trying to take advantage of the positive EUR sentiment.
*As I write, it appears a US /EUR tariff deal is very close, which backs up thoughts of 'risk on' trades to begin the new week.
Trade 1: AUD JPY -1
Trade 2: EUR GBP +1.5
Total = +0.5%
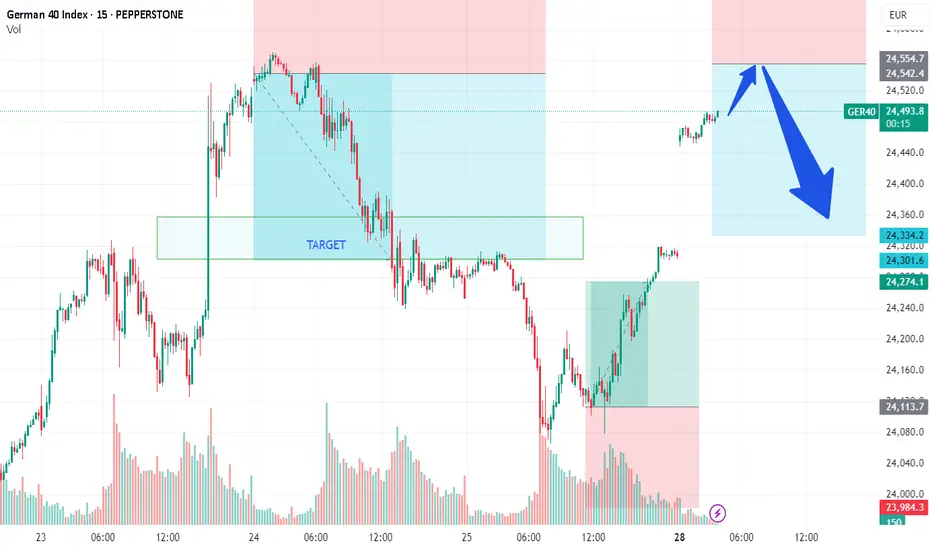
DAX/GER - PREPARE TO SHORT on DAX market opening Team,
We all know that the European Union and the United States agreed on Sunday to a broad trade deal that sets a 15 per cent tariff on most E.U. goods, including cars and pharmaceuticals.
The 27-nation bloc also agreed to increase its investment in the United States by more than $600 billion above current levels.
If the DEAL does not go through, it would be nasty to the market—especially to the Europeans, who are likely to get hurt by the export cost to the United States, especially the Car. The EUROPEAN is currently facing many challenges from Chinese car manufacturing.
We have been trading very well with the DAX in the past. We expect that when the market opens, we should short-range at 24530-60 - GET READY.
Stop loss at 24620-50
Please NOTE: once the price pulls back toward 24475-50, bring our STOP LOSS TO BE (Break even)
Our 1st target at 24425-24400
2nd Target at 24350-24300
Last Friday, in OUR LIVE TRADING, we mentioned that LONG DAX at 24100
Dollar I Weekly CLS I Model 2 I Ready for pullbackYo Market Warriors ⚔️
Fresh outlook drop — if you’ve been riding with me, you already know:
🎯My system is 100% mechanical. No emotions. No trend lines. No subjective guessing. Just precision, structure, and sniper entries.
🧠 What’s CLS?
It’s the real smart money. The invisible hand behind $7T/day — banks, algos, central players.
📍Model 1:
HTF bias based on the daily and weekly candles closes,
Wait for CLS candle to be created and manipulated. Switch to correct LTF and spot CIOD. Enter and target 50% of the CLS candle.
For high probability include Dealing Ranges, Weekly Profiles and CLS Timing.
Trading is like a sport. If you consistently practice you can learn it.
“Adapt what is useful. Reject whats useless and add whats is specifically yours.”
David Perk aka Dave FX Hunter
💬 Don't hesitate to ask any questions or share your opinions

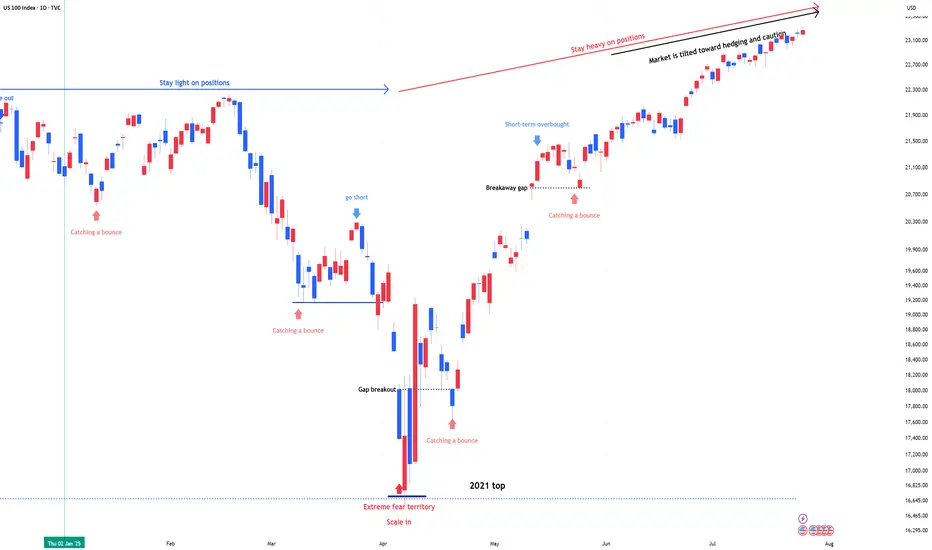
NDX & SPX , Stay heavy on positionsNDX & SPX , Stay heavy on positions (QLD, TQQQ)
Market sentiment is currently tilted toward betting on downside volatility, which ironically supports the case for the stock market to continue its upward trend.
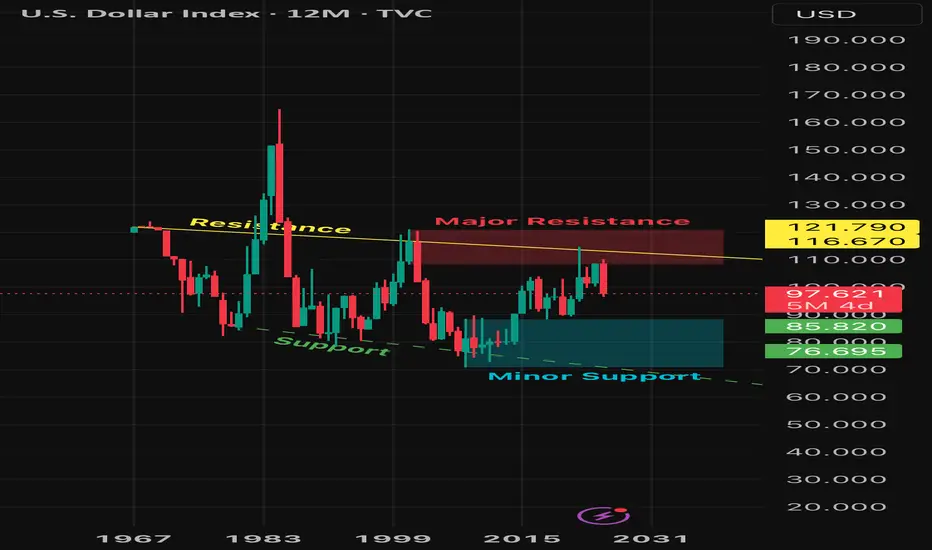
DXY: The Graceful Short This is interesting…Ever since the birth of Bitcoin, the DXY was in an overall uptrend, but that uptrend may have ended in the resistance zone. Price seems to have reversed for the DXY especially after the formation of a bearish engulfing candle on the 6M timeframe. Price may end the year within or on top of the support zone.
What does this mean for crypto and other assets?
If the DXY has reversed and is now in a long term down trend, crypto currencies and other assets will be in long term uptrends! Bitcoin may skip its upcoming bearish year next year or more than likely the bearish year will happen but the retracement may be short. Stay tuned!
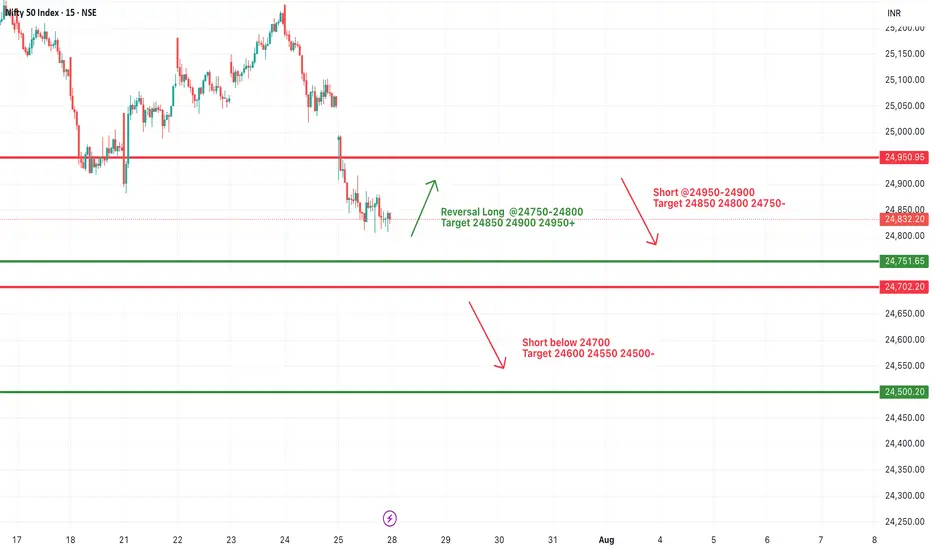
#NIFTY Intraday Support and Resistance Levels - 28/07/2025Nifty is expected to open slightly lower and remains under selling pressure from higher levels. The key intraday zone to watch is 24,750–24,900, which may act as a trigger range for today's direction.
If Nifty sustains above the 24,750–24,800 zone, a short-covering rally may push the index toward 24,850, 24,900, and 24,950+. This zone may offer a reversal opportunity if supported by strong price action.
On the downside, if the index fails to hold above 24,900–24,950, further weakness may be seen below 24,700, opening downside targets at 24,600, 24,550, and 24,500-.
The broader price action suggests a narrow consolidation between 24,700–24,900, with either side breakout likely to lead to intraday momentum. Maintain strict risk management and avoid aggressive trades within this zone.