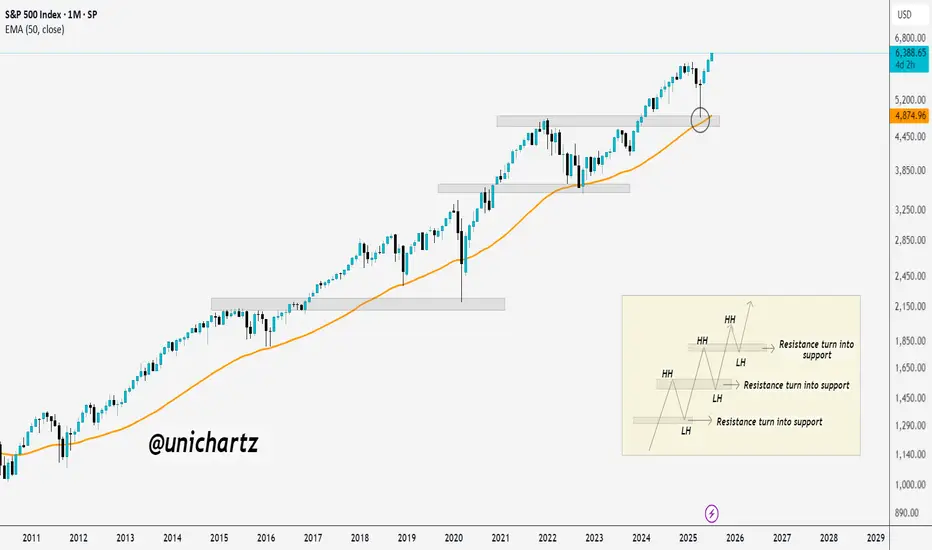
New All-Time Highs for S&P 500 – No Resistance AheadThe S&P 500 is officially in price discovery mode, printing new all-time highs with clean higher highs and higher lows.
Each old resistance flipped into strong support—textbook bullish market structure.
As long as this trend holds, there's no ceiling in sight. Bulls are fully in control.
Market indices
DXY Outlook: Can Fed Hold Spark a Move Toward 100?DXY Weekly Forecast – July Week 4
After reaching 96.50 early this month, DXY began showing bullish signs. Last week, price retested the extreme demand zone at 97.00 and closed with a bearish weekly candle that held some bullish pressure at the base.
This week, all eyes are on the Federal Reserve meeting. If the Fed holds rates steady, the dollar could strengthen further. A weekly close above 97.90 would confirm the breakout and open the door to a run toward 100.00 — a key psychological and technical level.
Bias: Bullish (if 97.90 breaks)
Key Zones:
• Demand: 97.00
• Breakout Level: 97.90
• Target: 100.00
This could be the beginning of a fresh bullish leg — especially if macro conditions align with technical structure.
—
Weekly forecast by Sphinx Trading
Let me know your bias in the comments.
#DXY #DollarIndex #ForexForecast #SphinxWeekly #SmartMoney #FOMC #USD #InterestRates

DXY forecast From weekly view the DXY is looking bearish at least till 95.123 key level the will see if we get a bullish power as the DXY is forming a reversal pattern. But of course many factors plays part in this economy, for example, global news like Tariffs and other factors.
So when DXY is trading on the 95.123 key level additional confluence will give us the right to put on trades, as the 95.123 key level is significant for what will take place next.
Take you all.......

DXY 4Hour TF - July 27, 2025DXY 7/27/2025
DXY 4hour Bearish Idea
Monthly - Bearish
Weekly - Bearish
Dailly - Bearish
4hour - Bearish
**We analyze DXY as an indicator of USD strength on a week to week basis**
This week is looking like we can expect bearish momentum on USD but here are two scenarios breaking down the potential:
Bearish Continuation - USD pulled a strong bearish reversal all last week which pushed us below our major 98.000 support zone.
We are now testing that same 98.000 zone as resistance and are looking to see if it will hold. Ideally, we can confirm further bearish structure to gain confidence in a bearish USD for the week ahead.
Bullish Reversal- For us to consider DXY as bullish again we would need to see bullish structure above our 98.000 zone. This would include: A break back above 98.000 with an established HH and HL.

Breakout of the channelAfter the DXY broke out of the channel, it formed a range.
We can see a yellow trendline where the price is moving exactly along it.
If this trendline breaks to the downside, we can take a short position targeting the bottom of the channel.
Otherwise, it would mean the trend reversal in DXY is confirmed.

DXY weekly outlookDXY Weekly Outlook
This week, I’m watching to see if the dollar continues its bearish trend or breaks above the current supply zone. We've already seen a strong reaction from the 8hr supply, but price could still tap into the 1hr supply before making its next move.
If price drops from here, I’ll be looking at the 2hr demand zone below for a possible bullish reaction. If DXY pushes up from that zone, pairs like EU and GU could drop — which lines up with my overall short bias on those.
Gold may not always move in sync with the dollar, but DXY still gives a good idea of market sentiment.
Let’s see how it plays out and stay reactive.

GER40 | Consolidation Range 24,600 – 24,000 With Breakout TargetGER40 is consolidating within a clear range between 24,600 resistance and 24,000 support. The lower boundary (24,000) aligns with the 61.8% Fibonacci retracement from the 23,050 → 24,600 impulse leg. A confirmed breakout above the range projects a measured move target of 25,197.2, which is derived from the 600-point height of the range between 24,000 and 24,600.
Support at: 24,000.00 / 23,678.5 / 23,050.00 🔽
Resistance at: 24,600.00 🔼
Range Target: 25,197.2 🎯
🔎 Bias:
🔼 Bullish: Clean break and hold above 24,600 confirms range breakout with target at 25,197.2.
🔽 Bearish: Break below 24,000 brings 23,678.5 and 23,050 into view.
📛 Disclaimer: This is not financial advice. Trade at your own risk.

GER40 | Cools Below ResistanceThe DAX rallied aggressively into 24,618.3, but price action has since turned sideways. The index is now ranging just below resistance, as bulls and bears battle for direction in this consolidation phase.
Support at: 24,000.00 / 23,687.21 / 23,500.00 / 23,047.01 🔽
Resistance at: 24,618.30 🔼
🔎 Bias:
🔼 Bullish: Clean break and close above 24,618.30 targets fresh highs.
🔽 Bearish: Break below 24,000 may confirm short-term distribution toward 23,687 and 23,500.
📛 Disclaimer: This is not financial advice. Trade at your own risk.

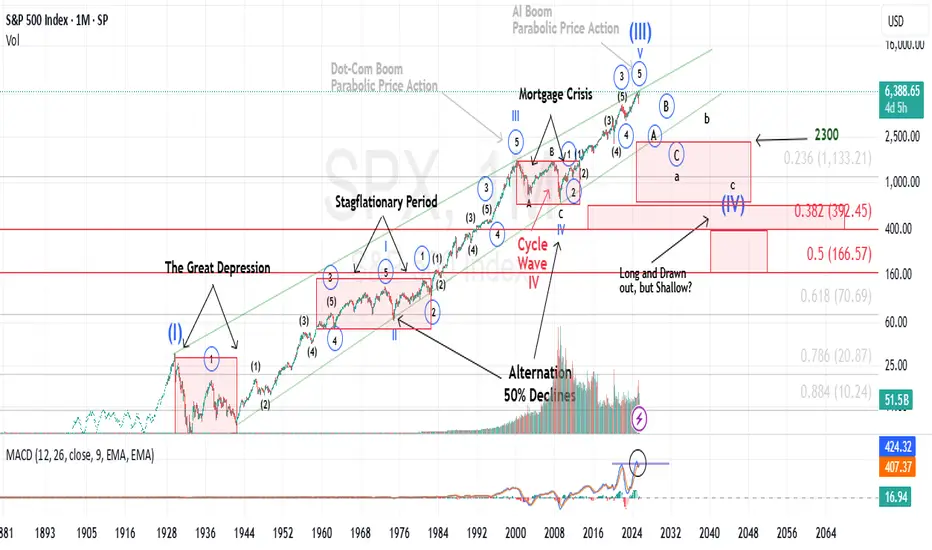
History does not repeat itself, however it tends to rhymeIt’s widely accepted that Mark Twain once said (or wrote) that “history does not repeat itself, however it tends to rhyme”.
Historical Parallels to a Super Cycle Wave (I) Top in U.S. Equities
The road to a major market top is often paved with echoing patterns from the past, and today's landscape bears an uncanny resemblance to pivotal historical events that preceded economic upheaval.
The 1918 Spanish Flu—though less economically damaging in the U.S. than elsewhere, still triggered a 1.5% drop in GDP and a 2.1% decline in consumer spending. The resulting economic weakness, paired with rising inflation, eroded real returns on equities and short-term government bonds for years.
Then came the 1929 stock market crash, the spark that ignited the Great Depression. Driven by a perfect storm of extreme speculation, sky-high valuations, and a regulatory vacuum, the collapse revealed the systemic fragility beneath the euphoria.
Adding fuel to the fire, the Smoot-Hawley Tariff Act of 1930 slammed the brakes on global trade. By sharply raising tariffs on imports, it invited swift retaliatory measures from abroad. The result: a devastating plunge in both U.S. exports and imports, deepening the economic crisis and worsening unemployment. Smoot-Hawley has since become a textbook example of how protectionist policy can magnify economic damage.
Modern Echoes: A Cycle Repeating?
Fast forward to the present and we see unsettling similarities.
The Covid-19 pandemic serves as a modern analog to the 1918 flu, disrupting global supply chains and triggering a steep drop in GDP and consumer spending. Unlike the post-WWI period, however, inflation didn’t precede the crisis, it exploded afterward, fueled by pent-up demand and fiscal stimulus, giving rise to persistent “sticky” inflation....and NOT TRANSITORY.
In a similar inversion of sequence, the Trump-era tariffs—modern-day echoes of Smoot-Hawley, were enacted before any major equity downturn, not after. Still, their long-term impact on global trade and supply chain reliability remains a pressure point for the economy.
Most critically, speculation and valuation excess are again center stage. Just as the roaring ’20s were characterized by euphoric risk-taking, today’s U.S. equity market is trading at record-high P/E ratios, despite rising macroeconomic uncertainty and deteriorating breadth.
These historical and contemporary markers suggest we may be approaching the apex of a Super Cycle Wave (III), a turning point that, like its predecessors, may only be fully recognized in hindsight.
It is my contention, that history is currently rhyming.
Best to all,
Chris
SPX500USD is on a riseHi traders,
Last week SPX500USD started the next impulse wave 5 (grey) as I've said in my outlook.
Next week we could see more upside for this pair.
Let's see what the market does and react.
Trade idea: Wait for a small pullback and a change in orderflow to bullish on a lower timeframe to trade longs.
NOTE: the next three weeks I'm on holiday so I will not post any outlook publicly.
If you want to learn more about trading FVG's & liquidity sweeps with Wave analysis, then please make sure to follow me.
This shared post is only my point of view on what could be the next move in this pair based on my technical analysis.
Don't be emotional, just trade your plan!
Eduwave

DXYJULY 21-25 recap
Net was -296 last week
Price dropped until Wednesday
Hit the weekly demand zone (strong support)
Sellers paused or covered shorts there
Buyers stepped in → possible bounce or reversal

US30 H4 IdeaThe Federal Reserve meets next week and is widely expected to leave rates unchanged at 4.25%–4.50%. Still, market participants will watch for commentary on inflation and rate-cut prospects, especially after recent criticism of Fed Chair Powell by President Trump.
What Should Traders Watch?
With the major indexes on track for weekly gains, next week’s developments could test the market’s resilience.

I HATETO BETTING. LET SEE WHY DXY Goes to there in my scenarioon August scenario
* Trumph's 10% import Tariff (Decision imminient)
* Powell speaking at Jackson Hole (August 22-24)
* Safe Haven printing Money

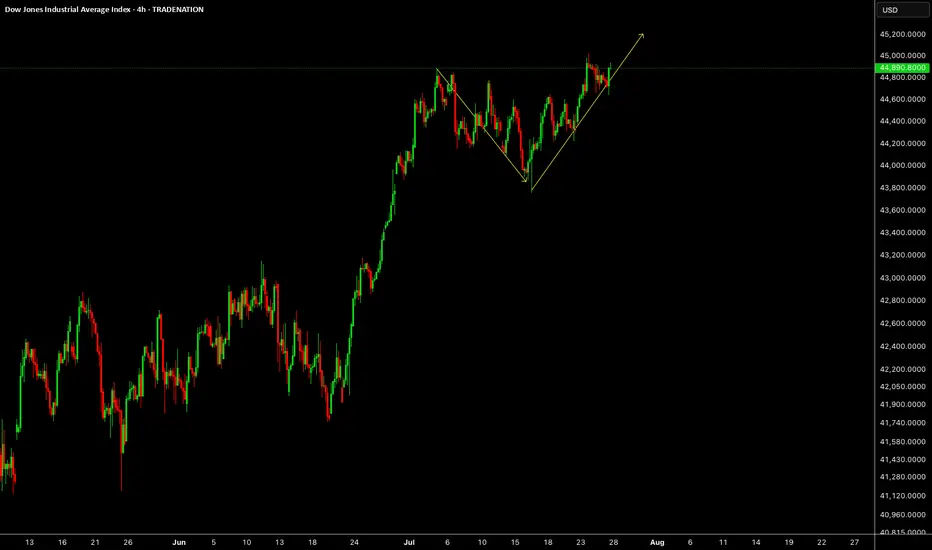
US30US30 needs some more upside short term towards 45.2K level.
Disclosure: We are part of Trade Nation's Influencer program and receive a monthly fee for using their TradingView charts in our analysis.
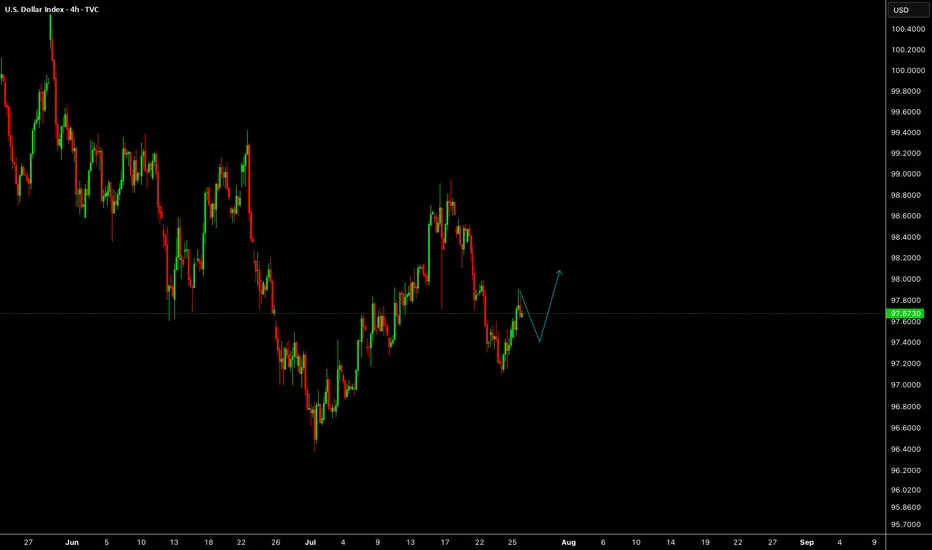
DXYDXY needs some more correction, if the correction is completed before Feds decision then a drop can follow otherwise Feds will push it up and NFP will drop it again.
Disclosure: We are part of Trade Nation's Influencer program and receive a monthly fee for using their TradingView charts in our analysis.
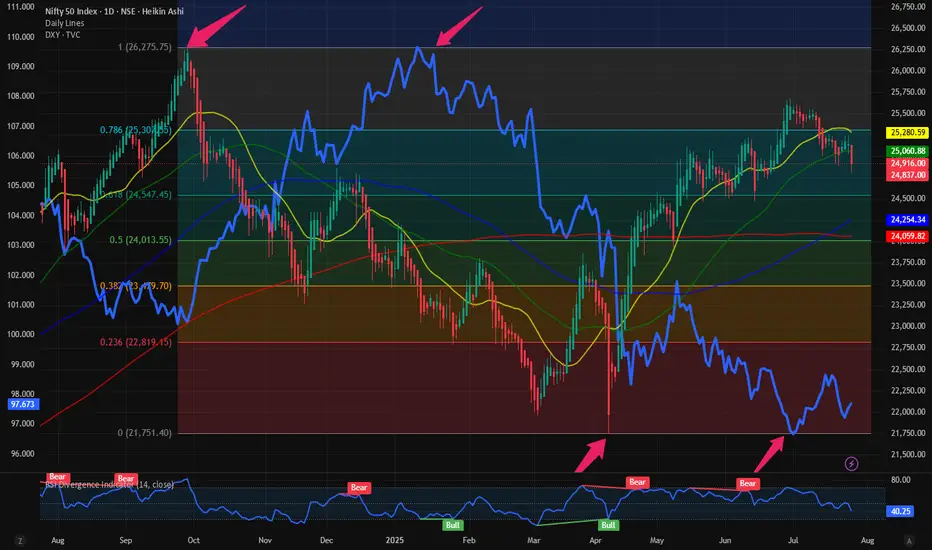
$NIFTY: Minor hiccup or downside expected. Answer: Watch $DXYRecently we have seen some weakness in NSE:NIFTY where it has failed to break out of the upward sloping Fib Retracement level. On June 16 we reflected upon the situation with $NIFTY. I was bullish on NSE:NIFTY due to the $DXY.
TVC:DXY weakness and EM markets: NSE:NIFTY more upside? for NSE:NIFTY by RabishankarBiswal — TradingView
My prediction was that the NSE:NIFTY can reach 26000 and TVC:DXY @ 96 by end of July. But the unravelling of the TVC:DXY short trade and recent strength in TVC:DXY has put pressure on our outlook.
Now we can go to the micro level and check what happening in the charts for both TVC:DXY and $NIFTY. In the daily chart below we overlayed TVC:DXY on top of the NSE:NIFTY candle stick chart. If we draw the Fib retracement level form the top to bottom of the NSE:NIFTY on the yearly chart we can see clear levels at play. It is also astounding to see how the Top and the bottom range of the Fib levels match to those from the $DXY. After making a new low of 97, TVC:DXY saw some short covering which took it back to 99. At the same time NSE:NIFTY put out a local top @ 25600 and then pulled back below to 0.786 Fib level currently below the psychological level of 25000. Hence our July end target of 26000 for NSE:NIFTY and 96 for TVC:DXY looks distant but not unrealistic. With 4 more trading days left in the month we might rally another 4.5% in NSE:NIFTY and drop 2% in TVC:DXY giving us a perfect leverage trade and meeting our July targets.
Verdict: NSE:NIFTY @ 26000 and TVC:DXY @ 96 as target remains intact. If not in July, we will achieve it in August.
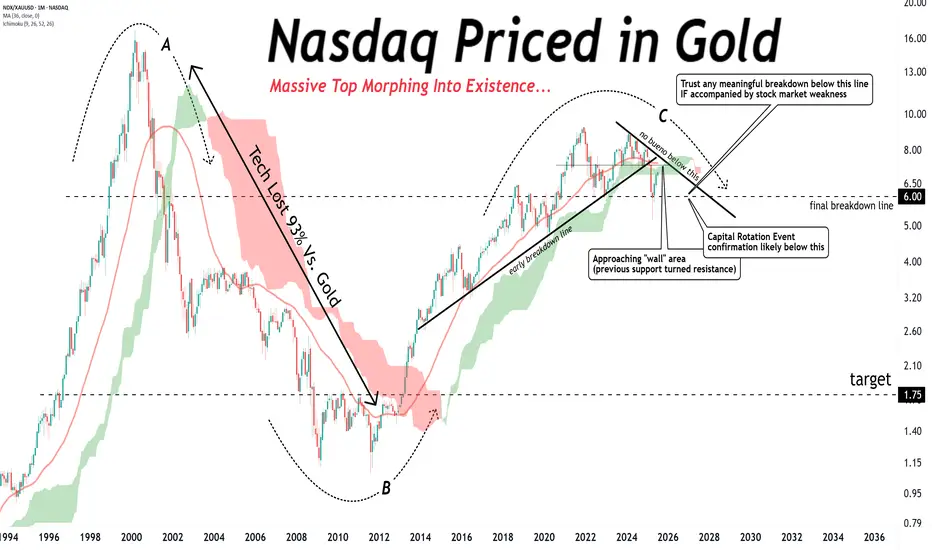
Tech stocks are still not out of the woods, priced in gold.Tech stocks are still not out of the woods, priced in gold.
Right now, it looks like a BIG TOPPING pattern morphing into existence.
No man's land.
Long Position on Dow Jones Industrial Average
Initiating a long position at 44,456, supported by robust economic data and stronger-than-expected corporate earnings. These indicators point to continued resilience in the U.S. economy, potentially allowing the Federal Reserve to consider rate cuts sooner than previously anticipated — a positive catalyst for equities.
📌 Entry: 44,456
🛑 Stop Loss: 44,207
🎯 Take Profit: 44,900
Monitoring price action closely as market sentiment continues to shift in response to macroeconomic developments.

"NASDAQ 100 Heist – Scalp, Swing, or Hold? (Full Plan)🔥 NASDAQ 100 HEIST PLAN – BULLISH LOOT AWAITS! 🔥
🚨 Attention Market Robbers & Money Makers! 🚨
(Swing/Day Trade Strategy – High-Risk, High-Reward Play)
🎯 Mission Objective: Loot the NDX100/US100 (NASDAQ 100) Like a Pro!
Based on Thief Trading’s ruthless technical & fundamental analysis, we’re executing a bullish heist—targeting the Red Zone (high-risk, high-reward area).
⚠️ WARNING: Overbought market, consolidation zone, potential bear traps—weak bears may get slaughtered! Strong hands only!
🔐 ENTRY: The Vault is OPEN!
"SWIPE THE BULLISH LOOT!" – Any price is a steal, but smart thieves use:
Buy Limit Orders (15m-30m TF) near recent swing lows/highs.
DCA/Layering Strategy – Multiple limit orders for max loot.
Breakout Confirmation – Don’t jump in early; wait for the real move!
🛑 STOP LOSS: Protect Your Stash!
Thief’s SL Rule: Nearest 4H swing low (22,600) – WICK LEVEL ONLY!
DO NOT place SL before breakout! (Patience = Profit.)
Adjust SL based on risk, lot size, and number of orders.
🎯 TARGETS: Escape Before the Cops Arrive!
Main Take-Profit: 24,400 (or exit early if momentum fades).
Scalpers: Longs ONLY! Use trailing SL to lock in profits.
Swing Traders: Ride the wave like a true market pirate!
📰 FUNDAMENTAL BACKUP: Why This Heist Will Work
Bullish momentum in NDX100 driven by:
Macro trends (Fed, inflation, tech earnings).
COT Report & Institutional positioning.
Geopolitical & Sentiment Shifts.
Intermarket correlations (USD, Bonds, Tech Sector).
(Stay updated—markets change FAST!)
⚠️ TRADING ALERT: News = Danger Zone!
Avoid new trades during high-impact news.
Trailing SL = Your best friend.
Lock profits early if volatility spikes!
💥 BOOST THIS HEIST! 💥
👉 Hit LIKE & FOLLOW to strengthen our robbery crew!
🚀 More heists coming soon—stay tuned, thieves! 🚀

NIFTY50.....Miss a final sell-off!Hello Traders,
the NIFTY50 is moving within a sideways-range. It ranges from a possible wave ((iii)), with a green high @ 25116 and a low of 24508, the end of a wave z (pink) of a wave (w)/(a) of ((iv)) green!
What can we expect for the coming days?
I think, the final low is not in the cards yet! I miss a final "sell-off" that will take N50 down into the range of the rectangle, sky-blue, for the coming days. That means, a possible finale low would be around the 24473 to 23935 points.
If so to come, a break of the 25250 area probably would open the door to 25580 area in the next 2 weeks. If this high were to occur, it would end wave ((iii), in pink, with a wave (iv), pink, to follow. Seasonally, that would fit well into the structure 'til end of September/ mid-October!
Anyway! As can be seen at the 3h chart, there is a divergence at RSI (standard deviation 14). This, more often than not, indicates a change of trend, in this case to the upside! However, the daily RSI has room to decline for the reminder of the week.
So, again. The structure seems to be not done to the downside, and I expect a new low, below the Friday's low, to come.
Have a great week.....
Ruebennase
Please ask or comment as appropriate.
Trade on this analysis at your own risk.

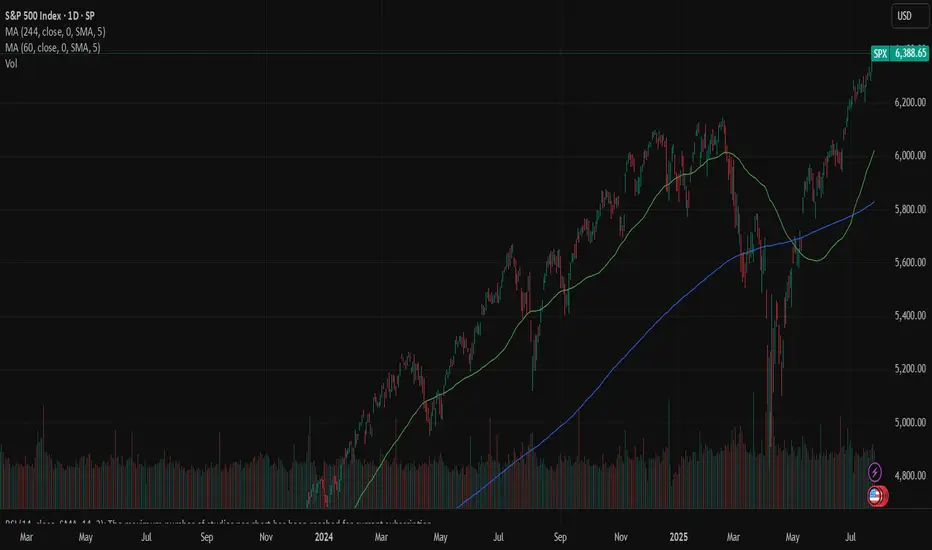
SPX: Tariffs deal (un)certainty Investors' optimism continued to hold at the U.S. equity markets another week in a row. The S&P 500 posted another weekly winning streak, supported by solid earnings of companies included in the index. The index also reached another all time highest level, with Friday's level of 6.388, gaining around 1,5% for the week.
Tech companies were once again main contributors to the surge of the index. Alphabet posted better than expected quarterly results, supporting the surge in share price of 4%. Tesla shares gained 3,5% for the week. The company reported strong vehicle delivery numbers and progress in AI-driven autonomous driving technology. Analysts are noting that 82% of all companies included in the S&P 500 index, that have already reported quarterly results, have beaten the market expectations.
Alongside strong earnings reports, recent advancements in U.S. trade negotiations have contributed to market gains. Earlier this week, President Donald Trump announced a significant trade agreement with Japan, which includes a 15% reciprocal tariff arrangement—an important step toward redefining trade terms between the two nations. Additionally, the U.S. and Indonesia have reportedly reached a framework agreement for a trade deal, reflecting a broader U.S. effort to strengthen and stabilize trade partnerships in Asia. On Friday, President Trump expressed confidence that more trade agreements will be finalized ahead of the August 1 deadline for new tariffs. One of these possible deals involves the European Union. Investors have welcomed these developments, as they help reduce tariff-related uncertainties and ease concerns about escalating trade disputes that could disrupt global supply chains and impact corporate earnings.
The week ahead brings a bunch of important macro data for the U.S. as well as the FOMC meeting, where Fed members will discuss a potential change in interest rates. Markets are currently not expecting that the Fed will make a move at this meeting. Certainly, with JOLTs, NFP, PCE data in combination with the FOMC meeting, the week ahead might bring back some higher volatility in the US equity markets, in case of any unexpected news.
China50 Target Locked | Long Setup via Thief Strategy🏴☠️ CHINA50 Market Robbery Blueprint 🔥 | Thief Trading Style (Swing/Day Plan)
🌍 Hey Money Makers, Chart Hackers, and Global Robbers! 💰🤑💸
Welcome to the new Heist Plan by your favorite thief in the game — this time targeting the CHINA50 Index CFD like a smooth criminal on the charts. 🎯📊
This is not your average technical analysis — it's a strategic robbery based on Thief Trading Style™, blending deep technical + fundamental analysis, market psychology, and raw trader instincts.
💼 THE SETUP — PREPARE FOR THE ROBBERY 🎯
We're looking at a bullish operation, setting up to break into the high-value vaults near a high-risk, high-reward resistance zone — beware, it's a high-voltage trap area where pro sellers and bearish robbers set their ambush. ⚡🔌
This plan includes a layered DCA-style entry, aiming for max profit with controlled risk. Chart alarms on, mindset ready. 🧠📈🔔
🟢 ENTRY: "The Robbery Begins"
📍 Zone-1 Buy: Near 0.63700 after MA pullback
📍 Zone-2 Buy: Near 0.62800 deeper pullback
🛠️ Entry Style: Limit Orders + DCA Layering
🎯 Wait for MA crossover confirmations and price reaction zones — don’t chase, trap the market.
🔻 STOP LOSS: "Plan the Escape Route"
⛔ SL for Pullback-1: 13540 (4H swing low)
⛔ SL for Pullback-2: 13350
📌 SL placement depends on your position sizing & risk management. Control the loss; live to rob another day. 🎭💼
🎯 TARGET ZONE: “Cash Out Point”
💸 First TP: 14100
🏁 Let the profit ride if momentum allows. Use a trailing SL once it moves in your favor to lock in gains.
👀 Scalpers Note:
Only play the long side. If your capital is heavy, take early moves. If you’re light, swing it with the gang. Stay on the bullish train and avoid shorting traps. Use tight trailing SL.
🔎 THE STORY BEHIND THE HEIST – WHY BULLISH?
CHINA50 shows bullish momentum driven by:
💹 Technical bounce off major support
🌏 Macroeconomic & geopolitical sentiment
📰 Volume + sentiment shift (risk-on)
📈 Cross-market index confirmation
🧠 Smart traders are preparing, not reacting. Stay ahead of the herd.
👉 For deeper insight, refer to:
✅ Macro Reports
✅ COT Data
✅ Intermarket Correlations
✅ CHINA-specific index outlooks
⚠️ RISK WARNING – TRADING EVENTS & VOLATILITY
🗓️ News releases can flip sentiment fast — we advise:
❌ Avoid new positions during high-impact events
🔁 Use trailing SLs to protect profit
🔔 Always manage position sizing and alerts wisely
❤️ SUPPORT THE CREW | BOOST THE PLAN
Love this analysis? Smash that Boost Button to power the team.
Join the Thief Squad and trade like legends — Steal Smart, Trade Sharp. 💥💪💰
Every day in the market is a new heist opportunity — if you have a plan. Stay tuned for more wild robbery blueprints.
📌 This is not financial advice. Trade at your own risk. Adjust based on your personal strategy and capital. Market conditions evolve fast — stay updated, stay alert.

Rob the Rally SPX500: Enter Before Resistance Catches You🦹♂️💰**“SPX500 Street Heist” – Thief-Style Robbery Plan for Bulls!**📈💸
(Powered by Thief Trader's Market Robbing Tactics – Scalp | Swing | Day Trade Edition)
🌍Hello, Global Money Hunters!
📣 Salaam, Bonjour, Ola, Hola, Hallo, Marhaba & Welcome to the heist floor! 🎩💼
Thief Trader is back again with a loaded plan to rob the market clean — this time targeting the mighty SPX500 / US500 🎯. Based on a fusion of technical setups, macro sentiment, and the Thief Trading System, we’ve set our sights on the next breakout vault of Wall Street.
🎯 The Gameplan – Heist the Resistance Vault
The index is entering a high-risk resistance barricade — overbought, consolidated, and heavily guarded by bearish robbers (sellers). This is the zone where the market police lurk and trend reversals often get triggered. However, smart thieves always plan with precision.
Here’s the mission briefing:
🔓Entry Zone (Break-in Point)
💥 “The vault is open — grab the bullish loot!”
Enter Long anywhere close to market price or on pullbacks near recent swing lows/highs.
Preferred timeframes: 15-min to 30-min for sniper-level accuracy.
Deploy DCA-style limit orders (layered entries for maximum control).
🛑Stop Loss (Escape Hatch)
Base SL on recent swing low candle wicks on the 4H timeframe.
Suggested: ~6250.00 — but adapt based on your risk appetite, lot size, and position stacking.
📈Target / Loot Location
🎯 Primary Take-Profit: 6450.00
Or… pull out early if you spot resistance fighters guarding the vault.
Use trailing SL to secure gains and manage getaway.
⚡Scalper’s Notice
Only Long-side allowed!
Got big capital? Jump in now.
Running low? Tag along with swing traders and follow the robbery protocol.
Always protect your bag with dynamic trailing stops.
🧠Fundamental Fuel Behind the Plan
Bullish sentiment across major indices
Macro trends, COT positioning, sentiment outlook, and intermarket analysis all greenlit
Geopolitical and Fed tone supportive — tap into real data before entering
👉 Always analyze: News, Fundamentals, Sentiment, COT reports, and macro conditions.
🚨NEWS ZONE ALERT – No Loud Moves!
Avoid entry during major economic news drops
Use trailing SLs to guard profits
Don’t let your open trades get caught in the chaos of news releases!
💥Let’s Boost the Thief Army!
Smash the BOOST button 💖 to power up the robbery crew.
Support the strategy, share the love, and stay ahead of the game using Thief Trading Style. Every trade is a step closer to freedom from financial traps. 🚀💰🎉
📌Disclaimer: This is a general market analysis for educational purposes and should not be considered personal financial advice. Please evaluate your own risk management strategy before placing trades.
📌Markets shift fast — stay flexible, stay alert, and always rob smart.
🔥Stay locked in for the next heist plan — Thief Trader signing off for now…
💸💼📈 Trade smart. Rob harder. 🤑🦹♂️📊
