US100 LONGWe can see that there is a strong resistance zone, and the US30 has made a pullback into that zone. Based on the SK system, the outlook appears more bullish for this week.
Market indices

NAS100 - Potential TargetsDear Friends in Trading,
How I see it,
Insightful article: (The same principle applies to Nasdaq naturally)
1) Read the article first:
investinglive.com
2) Follow the link to watch the short video -
youtu.be
Keynote:
We are waiting for a decisive and very clear bearish signal
I promise you; we won't miss it.
It will be in our face, on a 4Hr grouping or a Daily grouping.
Most times it's 1 x Big Red signal on a high TF.
I sincerely hope my point of view offers a valued insight
Thank you for taking the time study my analysis.

S&P 500 Counter-Trend Setup After Bullish Week US500Currently watching the S&P 500 (US500) closely 👀. The index has been in a strong bullish trend 📈, but I’m now evaluating a potential counter-trend opportunity.
Given the strength we’ve seen this week — possibly a “foolish rally” — there’s a chance we’ve either printed or are close to printing the high of the week 🧱. That opens the door for a retracement setup, particularly as we head into Monday’s open 🗓️.
🧠 Trade idea: If we get a bearish market structure break, I’ll be looking to enter short — targeting a 1R take profit initially, and holding a portion for a 2R–3R extension 🎯.
Friday sessions, especially after strong trends, often present clean intraday pullbacks — and when Monday’s low is set early, it can trap late buyers and fuel the move 📉.
⚠️ This is not financial advice — just sharing my thought process and trade plan.

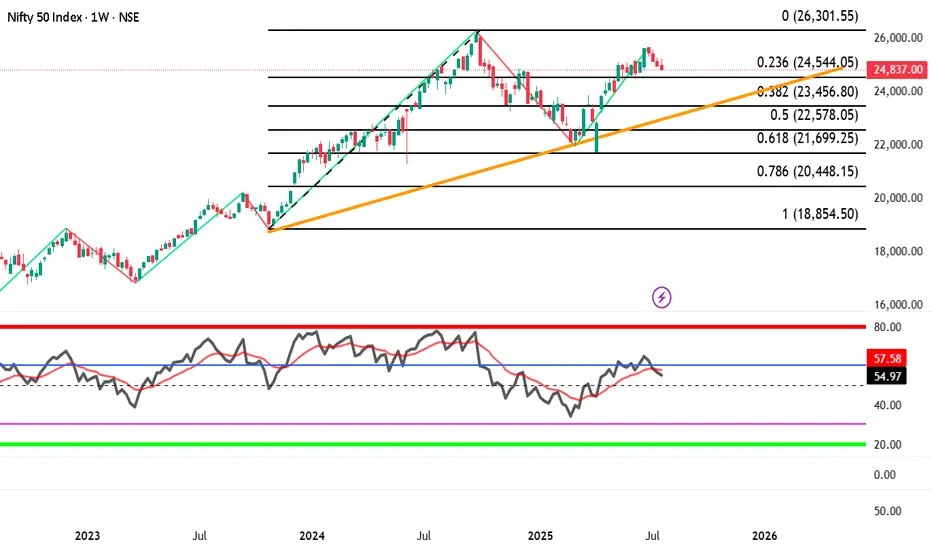
Nifty index showing downtrend with negative divergence BEARISH VIEW Nifty index --showing downtrend with negative divergence , watch out important trendline breakdown and fib. levels on nifty index.
if it happens than there might be BLOOD BATH IN MIDCAP AND SMALL CAP INDEX ALSO
Nifty index may fall big time if breaks 24544 than 23460, 22580, 21700 possible.
lets see
TASI Key Support & Resistance Levels This idea focuses on the Saudi Stock Market (TASI) key support and resistance levels based on time-sequenced price action.
Current support zone is highlighted (Point 1).
Time-based sequence:
🔺 Resistance on July 31 at 11126
🟢 Support on August 11 at 10885
🔺 Resistance on August 14 at 10999 / 10945
🟢 Support on September 1 at 9576
Connecting these points reveals the expected scenario shown in the second chart.
Key level: 11282 (Point 3) – A confirmed breakout above this level signals a strong buy opportunity, as it:
✔ Acts as a major support
✔ Breaks the descending channel
✔ Invalidates the bearish continuation scenario
📈 Watching for a bullish breakout above 11282 to enter long positions.

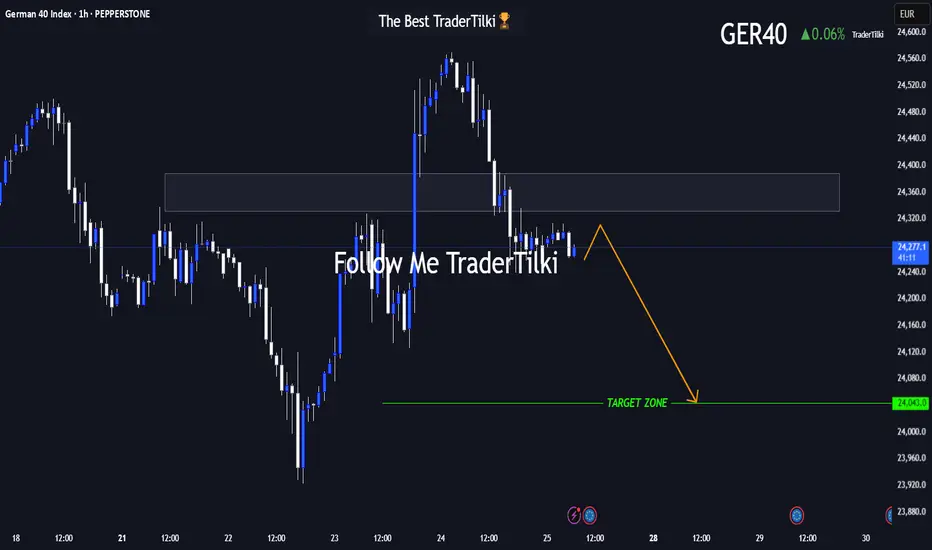
GER40 in Motion: This Setup Speaks Volumes 🌅 Good morning, my friends,
I’ve put together a fresh GER40 analysis just for you. Even if the 1-hour timeframe shows some upward momentum, I fully expect the price to reach my target level of **24,050**.
I'm holding firm until that level is hit.
Every single like from you is a massive source of motivation for me to keep sharing analysis. Huge thanks to everyone supporting with a tap!
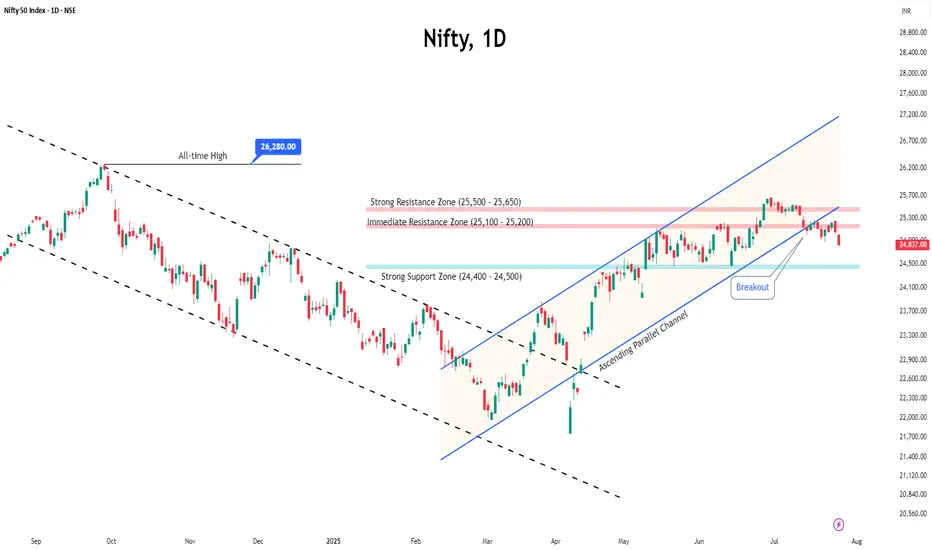
Pressure Builds on Nifty Before ExpiryThe Nifty traded in a tight range for most of the week but eventually slipped below the 25,000 mark, ending on a weak note.
With the monthly expiry approaching, the index is likely to remain under pressure, and volatility may pick up in the coming sessions.
Key resistance levels are seen at 25,200 and 25,500. A decisive move above 25,500 could trigger an upside breakout. On the downside, support is expected around 24,500 and 24,400.
Given the current structure, traders are advised to stay cautious, focus on selective opportunities, and avoid aggressive positions until a clearer trend emerges.

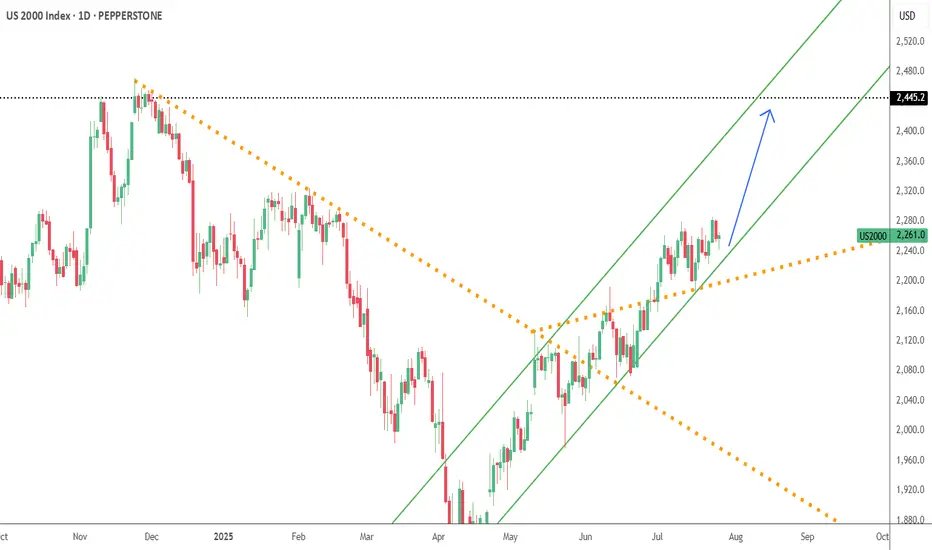
US2000--LONG--27_07_25-- Bullish trend continuation
--ascending channel
--Buy around 2249--2272
--TP around 2451

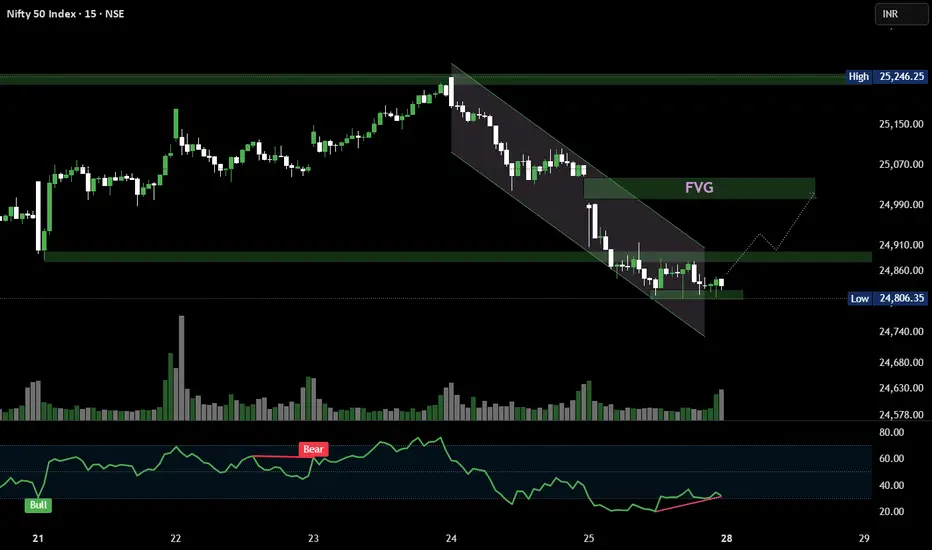
Nifty50 - 15MIN setting up for a bounce? Bear channel + RSI divergence = 🐂 signals building.
Watch for breakout & reclaim of 24,860 zone 👀
Targeting the FVG zone around 24,990 📍
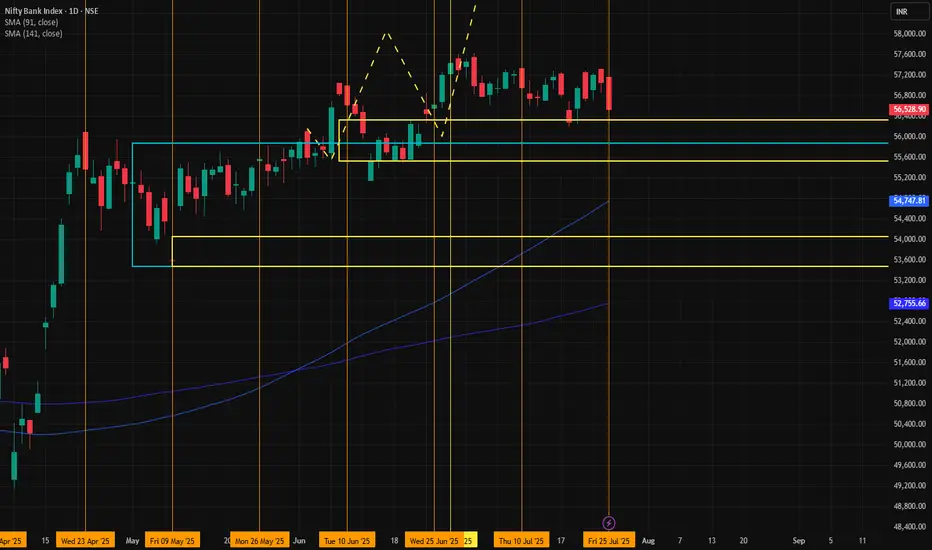
BANK NIFTY📈 Trade Setup Details
🔹 Trade Plan 1 (MTF-Based Entry)
Metric Value
Entry 56,223
Stop Loss 55,475
Risk 748 pts
Target 63,232
Reward 7,009 pts
Risk:Reward 1:9.4
🔸 Comment:
A high RR setup using the Daily DMIP zone. Ideal for trend continuation if price respects 55,780–56,223 range.
🔹 Trade Plan 2 (Deep Pullback Entry - ITF Zone)
Metric Value
Entry 54,054
Stop Loss 53,483
Risk 571 pts
Target 61,819
Reward 7,765 pts
Risk:Reward 1:13.6
🔸 Comment:
An aggressive RR trade if price retraces. Very favorable for swing traders anticipating bounce from deeper ITF demand zone.
🧭 Technical Landmarks
Key Level Value
Last High 55,467
Last Low 47,702
Point Range 7,765
🧠 Strategic Notes
Bias: Strong Bullish.
Preferred Entry: If price reacts bullishly at 56,223, can trigger first trade. If market dips, watch 54,054 for second trade.
Stop Loss Discipline: Clearly placed with low drawdown.
Trend Confirmation: All HTF zones are bullish, adding confidence to long entries.
🔍 Multi-Timeframe (MTF) Analysis Summary
Timeframe Trend Zone Type Proximal Distal Average
Yearly UP Rally-Base-Rally 54,467 44,429 49,448
Half-Yearly UP BUFL 54,467 49,654 52,061
Quarterly UP Rally-Base-Rally 54,467 49,156 51,812
HTF Avg. UP 54,467 47,746 51,107
| Monthly | UP | Rally-Base-Rally | 55,875 | 53,483 | 54,679 |
| Weekly | UP | Rally-Base-Rally | 56,328 | 55,381 | 55,855 |
| Daily | UP | DMIP (BUFL) | 56,223 | 55,780 | 56,002 |
| MTF Avg. | UP | | 56,142 | 54,881 | 55,512 |
| 240m | UP | DMIP | 55,942 | 55,475 | 55,709 |
| 180m | UP | DMIP | 55,597 | 55,475 | 55,536 |
| 60m | UP | DMIP | 55,597 | 55,475 | 55,536 |
| ITF Avg. | UP | | 55,712 | 55,475 | 55,594 |
✅ Conclusion: All timeframes are bullish, with higher highs and strong demand zones developing across MTF and ITF — indicating a clear uptrend continuation structure.
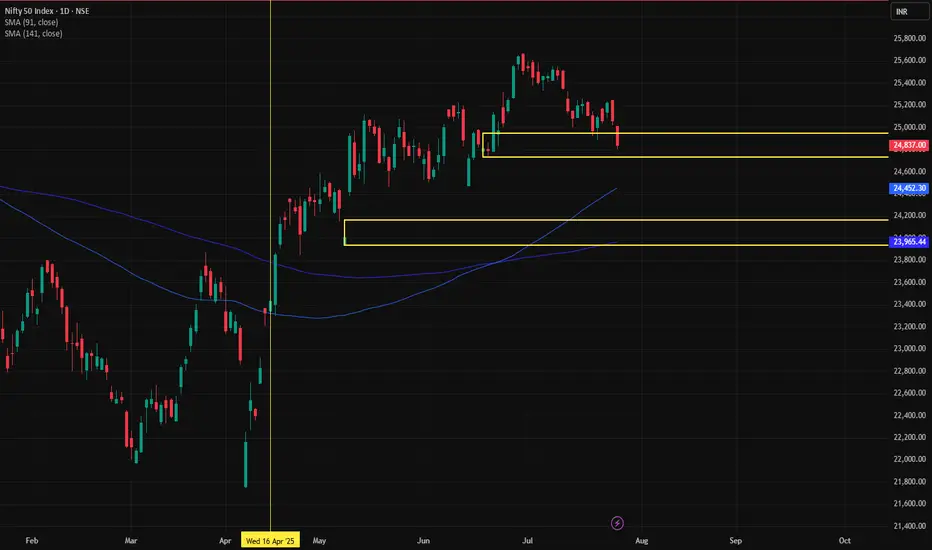
NIFTY🎯 Trade Setups
ENTRY-1
Entry: 24,947
SL: 24,750
Target: 29,331
Risk: 197 pts
RRR: ~22.2:1
✅ Strong RRR, aligned with daily demand
ENTRY-2
Entry: 24,164
SL: 23,935
Target: 30,961
Risk: 229 pts
RRR: ~29.9:1
✅ Even better RRR, and sits within deeper Daily DMIP demand zone
📌 Key Insights
Structure: Bullish across all MTFs, no breakdown below major support.
Zone Strength: Repeated demand clusters around 23,935–24,947 strengthen conviction.
Trade Planning: Both entries offer excellent RRRs with manageable risk, especially Entry-2.
Action Near Supply: Watch the 24,700–24,900 area for rejection or breakout confirmation.
🧭 Suggested Strategy
If price sustains above 24,950: Long trades become active with Entry-1 logic.
If price dips to 24,164–23,935: Deploy Entry-2 plan for deep demand bounce.
Break below 23,935: Exit long bias; shift to neutral/wait for fresh demand formation.
✅ Multi-Timeframe (MTF) Demand Zone Analysis
Timeframe Proximal Distal Avg Zone Action
Yearly 18,887 15,183 17,035 BUY
6-Month 21,801 18,837 20,319 BUY
Quarterly 24,226 21,966 23,096 BUY
Monthly 25,116 23,935 24,526 BUY
Weekly 25,136 24,703 24,920 BUY
Daily (DMIP) 24,947 24,750 24,849 BUY
Daily (DMIP) 24,164 23,935 24,050 BUY
📌 Observation:
All major timeframes are aligned in Demand Zones, indicating a strong bullish structure unless the lower support (23,935–24,164) is decisively broken.
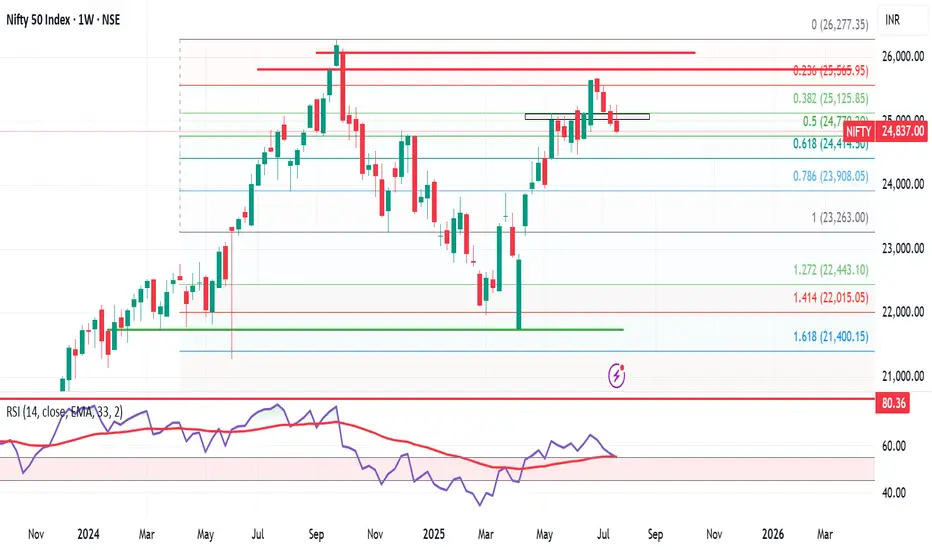
Nifty Weekly Market Update – Brace for Bearish Momentum? Nifty ended the week at 24,837, down 131 points from last week’s close. It made a high of 25,246 and a low of 24,806, staying perfectly within my projected range of 25,400–24,500.
As highlighted earlier, Nifty has now formed an inverted hammer on the weekly chart — a classic bearish reversal candlestick. 🔍
📅 Flashback: On 6th July, I mentioned giving bulls 10–15 days of playtime. That phase seems to be ending. The monthly time frame remains bearish, and now the weekly chart is aligning, indicating a stronger downside risk.
🔮 What’s Next?
👉 Expect Nifty to trade between 25,300–24,400 in the coming week.
👉 A break below 24,400 could open doors to 23,900.
👉 If 24,400 holds, bulls may still have a chance to regroup.
🧠 Pro Tip: Only Nifty Pharma is showing resilience. Those looking for long trades should focus on strong pharma stocks — the rest of the sectors are showing bearish signs.
Meanwhile in the US:
S&P 500 hits another all-time high, closing at 6,388, up 90 points from last week. My long-standing target of 6,568 now looks well within reach.
But here’s the catch — despite US strength, it’s not supporting Indian markets. If US markets correct, expect intensified selling pressure in India.
🎯 Strategy for Indian investors:
Let the bears rule till 7–8 August. Stay alert, and be ready to grab high-quality stocks at bargain prices. This is not the time to panic, but to prepare smartly.
NASDAQ Bulls Pushing – Will 20,347 Hold or Break?Price is currently approaching the 20,347 🔼 resistance zone after a strong bullish rally from the 19,150 🔽 support level. The market structure remains bullish with consistent higher highs and higher lows, showing strong buyer momentum.
Support at: 19,670 🔽, 19,150 🔽, 18,500 🔽, 17,600 🔽
Resistance at: 20,347 🔼, 20,600 🔼, 21,000 🔼
Bias:
🔼 Bullish: If price breaks and holds above 20,347 🔼, we could see a continuation toward 20,600 and 21,000.
🔽 Bearish: A strong rejection from 20,347 🔼 could send price back down toward 19,670 and 19,150 for a retest.
📛 Disclaimer: This is not financial advice. Trade at your own risk.

Dollar Index Dips – All Eyes on 97.600?The US Dollar Index (DXY) is currently trading just below the 100.000 🔼 resistance area, following a series of lower highs and lower lows that reflect a clear bearish trend. Price is now approaching the 97.600 🔽 level, which has previously acted as a key turning point and could influence the next directional move.
Support at: 97.600 🔽
Resistance at: 100.000 🔼, 101.500 🔼, 102.812 🔼, 104.223 🔼
🔎 Bias:
🔽 Bearish: The trend remains bearish while price stays below 100.000. A break below 97.600 may lead to further downside continuation.
🔼 Bullish: A bounce from 97.600 followed by a move back above 100.000 could open the door for a recovery toward 101.500.
📛 Disclaimer: This is not financial advice. Trade at your own risk.
