Trading Ideas For PSE Stocks, FX, Crypto, US Stocks And OilI will try and post more trading ideas here in tradingview for forex, crypto, US stocks, Philippine Stocks, Metals, And Oil.
My trading principle is all about keeping your losses small. You take small losses to get to your wins and let the game of probability do its work. No prediction. Let the price move and react.
Market indices

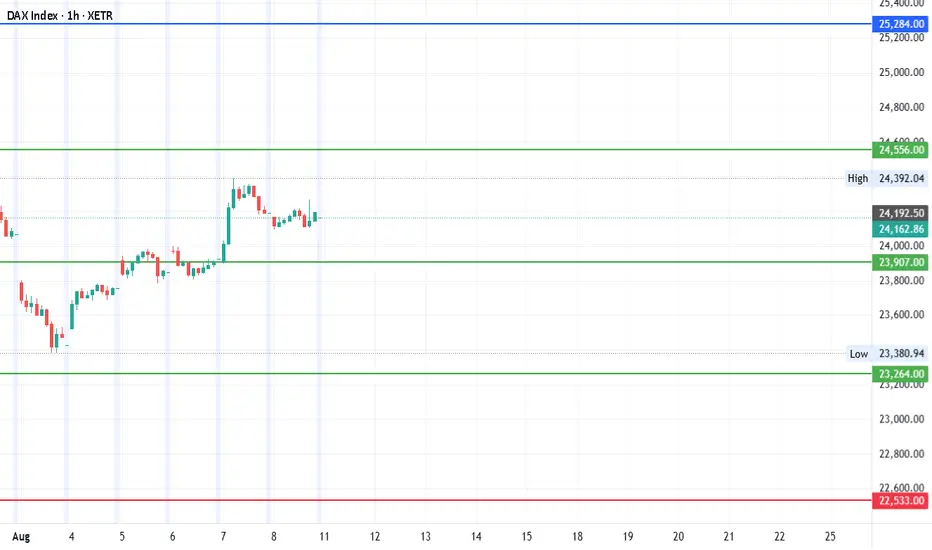
#DAX - AUG Quarterly Levels : 3000 Pts SwingDate: 09-08-2025
#DAX - We are here for the interesting moments of the historical period where the trade tariff wars are at it's peak. The markets are not moving based on any fundamentals rather it's on the fear and sentiments factor. At this point, 3000 points swing will not be surprising!
The pivot levels posted in the previous chart remain intact and new these levels add as an extra support and resistance levels along with the new big targets.
#DAX Current Price: 24162.86
#DAX Pivot Point: 23907 Support: 23264 Resistance: 24556
#DAX Upside Targets:
🎯Target 1: 25284
🎯Target 2: 26012
🎯Target 3: 26801
🎯Target 4: 27591
#DAX Downside Targets:
🎯Target 1: 22533
🎯Target 2: 21802
🎯Target 3: 21013
🎯Target 4: 20224
#TradingView #Nifty #BankNifty #DJI #NDQ #SENSEX #DAX #USOIL #GOLD #SILVER
#BHEL #HUDCO #LT #LTF #ABB #DIXON #SIEMENS #BALKRISIND #MRF #DIVISLAB
#MARUTI #HAL #SHREECEM #JSWSTEEL #MPHASIS #NATIONALUM #BALRAMCHIN #TRIVENI
#USDINR #EURUSD #USDJPY #NIFTY_MID_SELECT #CNXFINANCE
#SOLANA #ETHEREUM #BTCUSD #MATICUSDT #XRPUSDT
#Crypto #Bitcoin #BTC #CryptoTA #TradingView #PivotPoints #SupportResistance
Strong sell NAS100We are looking for a drop on H1 time frame
H1 , H30 ,h4 already overbought pair
Selling area looking strong enough to change the trend shortly

Nifty analysis On the weekly Nifty chart, the 40-week EMA is around 24,188, currently just ~175 points below the market at 24,363, with a bullish imbalance (FVG) sitting just above it; the last time Nifty dipped below this EMA was in Feb–Mar 2024, only ~1.35% (~300 points) under, before reversing from a confluence of a prior swing low, unfilled bullish FVG, and 50-week EMA support. If the EMA breaks now, the strongest support lies at 23,800–23,850, which is aligned with a March–April 2025 bullish order block and swing low. Given current macro conditions—U.S. tariffs on Indian exports, six straight weeks of FII selling, weak earnings, and geopolitical trade tensions—there’s about an 80% probability Nifty will test both the nearby FVG and EMA in weekly tf, the strongest resistances from the current price are 24,750–24,800 (recent lower high and bearish FVG, a near-term liquidity zone) and 25,050–25,100 (major swing high, start of last big sell-off, and 50% retracement of the recent drop), with the latter being the critical “supply wall” that would need to break to turn the weekly trend bullish again.

#CNXFINANCE - 900 POINTS MOVE EXPECTEDDate: 28-07-2025
NiftyFinance Current Price: 26615.1
Pivot Point: 26709 Support: 26429 Resistance: 26991
Upside Targets:
Target 1: 27144
Target 2: 27298
Target 3: 27519
Downside Targets:
Target 1: 26274
Target 2: 26120
Target 3: 25899
Target 4: 25678.000
#TradingView #Stocks #Equities #StockMarket #Investing #Trading #Niftyfinance
#TechnicalAnalysis #StockCharts #Finance

DXYHere’s the English description of the two scenarios in your chart:
Scenario 1 (Green Path):
Price drops from the current level (~98.26) towards the demand zone around 97.50–97.60, finds support, and then rallies sharply, breaking above the 98.80–99.00 resistance zone and continuing higher toward the 100.20–100.40 level.
Scenario 2 (Orange Path):
Price first pushes upward toward the 98.80–99.00 supply zone, faces rejection, then falls sharply to the demand zone around 97.50–97.60, before reversing and rallying strongly toward the 100.20–100.40 target.

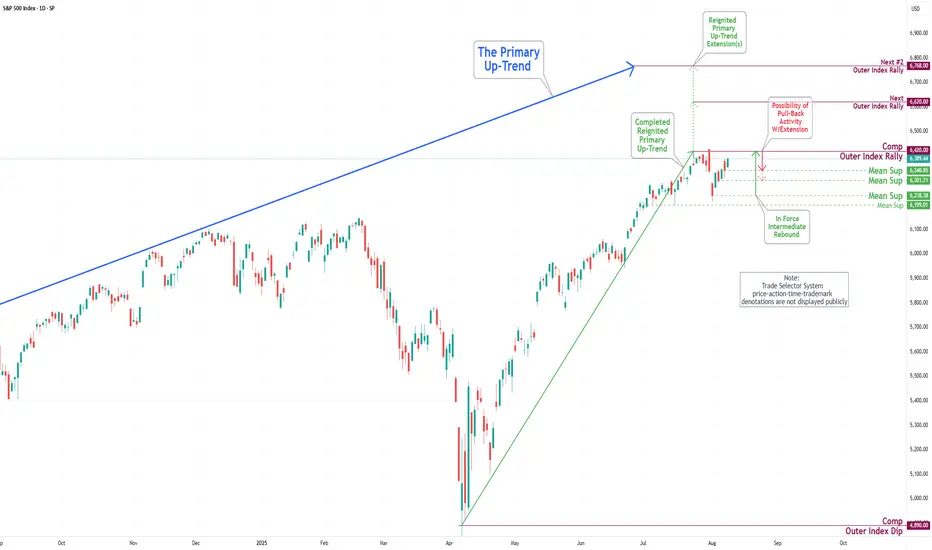
S&P 500 Daily Chart Analysis For Week of August 8, 2025Technical Analysis and Outlook:
During the trading activity of the previous week, the S&P 500 Index exhibited a predominantly bullish trend and is poised to retest the completed Outer Index Rally target of 6420, as outlined in last week’s Daily Chart Analysis. The primary objective now is to target subsequent levels, specifically the next Outer Index Rally target of 6620 and beyond.
It is crucial to recognize that the current price movement may initiate a substantial pullback from the present price action, either before or following the attainment of the Outer Index Rally peak at 6420.
I guess maybe nifty will form a double top in Monthly TF and canI guess maybe nifty will form a double top in Monthly TF and can come to blue Trendline like previous one it did.

Nasdaq may consolidate in channalNasdaq may consolidate in channal. Waiting some big news to trigger.

NDX & SPX , Stay heavy on positionsNDX & SPX , Stay heavy on positions. (QLD, TQQQ)
Despite the rebound, the market remains tilted toward hedging and caution.
In stay light on positions zones, I hold QQQ and reduce exposure.
In stay heavy on positions zones, I increase allocation using a mix of QLD and TQQQ.

Sunday pre market analysistake the liQ from Junes high then
possible hit the 4H FVG if not just continue
upwards into September


SELL GER30 FOR WIFE BIRTHDAYI am already in the sell, will be entering more entries on neckline of triangle. I need to take my wife out tomorrow and I am betting on this tade. I will close the trade at 22:45 exactly before market closes.
Analysis:
1. Daily bearish
2. 4 hr brearish
3. Entered the early position on 1 min timeframe

when to change your session bias and Take profit, YM! Long1. This video demonstrate when you should change you bias for the session, sometimes before session price action quite confusing but when you add SMT and strength switch concept to you bias you will see true price intention where it will go.
2. Always take entry or profit one level to another level, price always go from one level to another level.
3. This video I try to demonstrate how to take profit when you have to level to target, always look for the correlated instruments to build bias

DAX WILL GO UP|LONG|
✅DAX is going up now
And the index made a
Breakout of the key horizontal
Level of 24,100 which is
Now a support then
Made a retest and a is now
Making a rebound already so
We are bullish biased and we
Will be expecting a further
Bullish move up
LONG🚀
✅Like and subscribe to never miss a new idea!✅

Russell2000 bullish sideways consolidationKey Support and Resistance Levels
Resistance Level 1: 2256
Resistance Level 2: 2273
Resistance Level 3: 2282
Support Level 1: 2197
Support Level 2: 2177
Support Level 3: 2141
This communication is for informational purposes only and should not be viewed as any form of recommendation as to a particular course of action or as investment advice. It is not intended as an offer or solicitation for the purchase or sale of any financial instrument or as an official confirmation of any transaction. Opinions, estimates and assumptions expressed herein are made as of the date of this communication and are subject to change without notice. This communication has been prepared based upon information, including market prices, data and other information, believed to be reliable; however, Trade Nation does not warrant its completeness or accuracy. All market prices and market data contained in or attached to this communication are indicative and subject to change without notice.

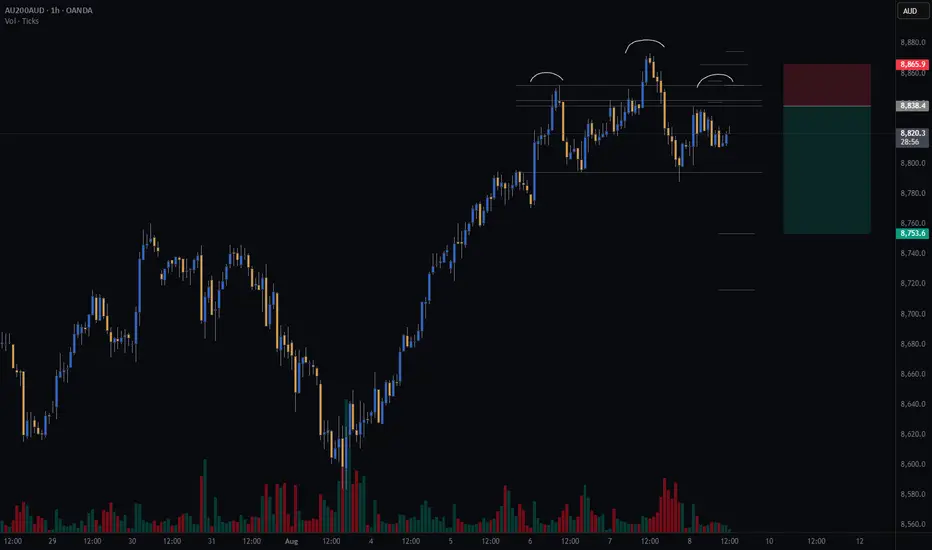
Watching for a Head & Shoulders on AUS200Watching AUS200 for a potential short setup — possible head and shoulders on the hourly chart. Left shoulder and head complete; waiting to see if right shoulder forms to confirm.
All my setup variables are met so far.
#GTradingMethod calculates take profits using the distance between the head’s peak and neckline, projected downwards.
Risk/Reward: 3.4
Entry: 8838.3
Stop Loss: 8865.8
TP1 (50%): 8753
TP2 (50%): 8716
Join the journey, what are your guys and girls thoughts on how to trade a head and shoulders, and does anyone track the AUS200?
Disclaimer: Please note, this is not financial advice. This content is intended to track my trading journey and for educational purposes only
Nasdaq long position Nasdaq long position update. Nasdaq is still going as predicted and is about to hit the set target of 24,000. Recently Nasdaq retested a support of break-out and retest and continued with the bullish momentum. Nasdaq is set to thrive even higher to a price of 25,000.

NSDQ100 sideways consolidation support at 23045Nasdaq 100 Market Summary – August 8
Markets remain cautious, with a mix of corporate and macro developments driving sentiment.
Gold futures surged after the US unexpectedly imposed tariffs on one-kilo and 100-ounce gold bars. The move surprised traders and added fresh uncertainty to the metals market. Oil prices stabilized following a recent decline, as attention shifts to potential diplomatic developments, including a possible Trump-Putin meeting.
In the tech sector, Tesla scrapped its Dojo supercomputer project, a blow to its in-house AI and self-driving ambitions. This comes just weeks after Elon Musk said he was doubling down on the effort. The departure of the project’s lead adds to investor concerns. Meanwhile, Intel’s CEO responded to political pressure by reaffirming his board’s support, as Trump called for his resignation over alleged conflicts of interest.
On the economic front, the latest jobless claims data brought some relief after last week’s soft payrolls report. Initial claims rose slightly to 226,000, just above the 222,000 forecast. However, continuing claims came in higher at 1.974 million, with most of the increase seen in California—likely due to seasonal factors. Additionally, the New York Fed’s July survey showed a rise in both inflation expectations and concerns about the job market.
Conclusion for Nasdaq 100 Trading:
The tone remains cautious. Disruptions at major constituents like Tesla and Intel may drag on sentiment, while macro uncertainty—rising geopolitical tensions, new tariffs, and unstable commodity markets—adds to headwinds. Traders may rotate into defensives or software names with lower exposure to AI hardware or international trade risks. Expect range-bound trading with elevated volatility until clarity emerges on US-Russia diplomacy and the true extent of tariff impacts.
Key Support and Resistance Levels
Resistance Level 1: 23700
Resistance Level 2: 23900
Resistance Level 3: 24085
Support Level 1: 23045
Support Level 2: 22870
Support Level 3: 22675
This communication is for informational purposes only and should not be viewed as any form of recommendation as to a particular course of action or as investment advice. It is not intended as an offer or solicitation for the purchase or sale of any financial instrument or as an official confirmation of any transaction. Opinions, estimates and assumptions expressed herein are made as of the date of this communication and are subject to change without notice. This communication has been prepared based upon information, including market prices, data and other information, believed to be reliable; however, Trade Nation does not warrant its completeness or accuracy. All market prices and market data contained in or attached to this communication are indicative and subject to change without notice.

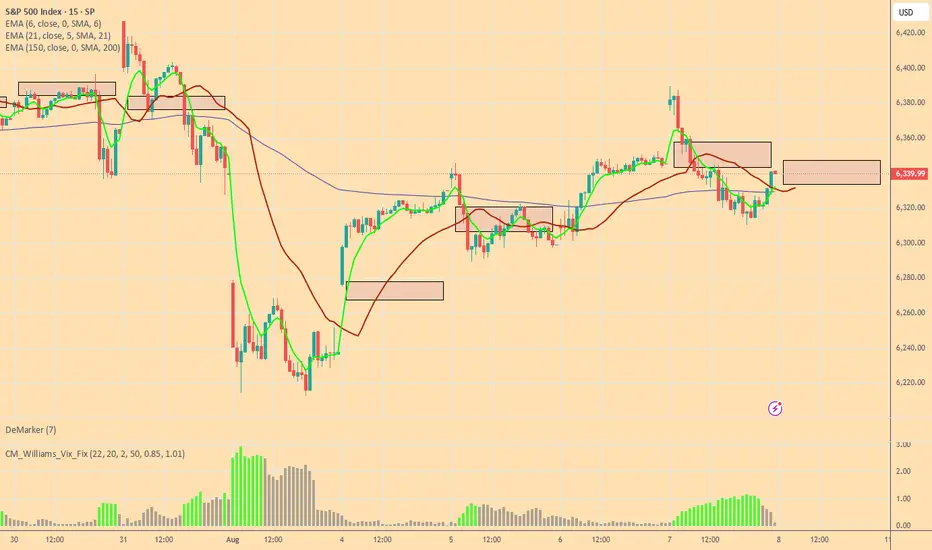
Bulls and Bears zone for 08-08-2025ETH session has rallied to 61.8 Fibonacci level of yesterday's RTH session. Any test of ETH session High could provide direction for the day.
Level to watch: 6384 --- 6386
This V-Pattern on SPX500 Is Stupid CleanHey, it’s Skeptic.
In this video, I’m breaking down a clean V-pattern setup on SPX500 — right in line with what I taught in yesterday’s educational post.
We’re starting from the Daily time frame and walking through the logic behind my long trigger, why the previous fakeout was actually useful, and how to set your stop-loss depending on your trading style (H4 vs 15min).
This isn’t just chart talk — it’s about reading the story behind the candles.
If it helped you see things clearer, give it a boost and drop your thoughts below.
Let’s keep learning — one trap at a time.
Until next time, peace out.
📌 Disclaimer: This video is for educational purposes only and does not constitute financial advice. Always do your own research and manage your risk.

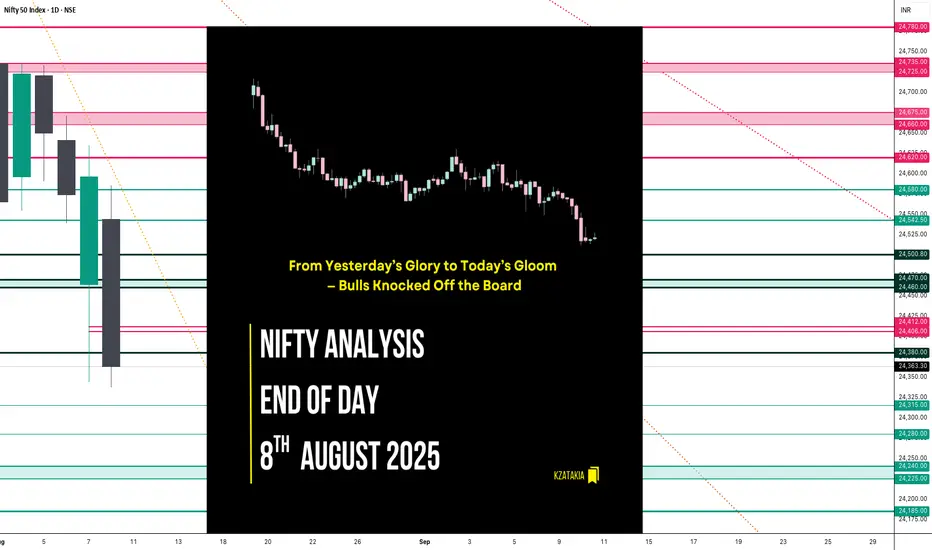
Nifty Analysis EOD – August 8, 2025 – Friday🟢 Nifty Analysis EOD – August 8, 2025 – Friday 🔴
From Yesterday’s Glory to Today’s Gloom — Bulls Knocked Off the Board
Today’s market was a textbook case of how quickly momentum can flip. Yesterday’s 289-point bullish surge was completely erased, with Nifty ending deep in the red and closing at the day’s low. Sellers clearly had the upper hand, leaving little room for bulls to breathe.
🗞 Nifty Summary
Friday opened with a 65-point gap-down — right below the crucial 24,580 support zone — and that level instantly showed rejection.
In the first 45 minutes, Nifty slipped 150 points from the day high and 200 points from the previous day high. The key Fibonacci retracement level from yesterday’s range — 24,406 ~ 24,412 — played the role of intraday savior multiple times, offering support and holding the market within a narrow zone for most of the day.
However, the bulls’ defense cracked after 3:00 PM. The support broke, triggering a sharp slide below 24,380 and even the Previous Day Low (PDL).
The upside was capped by 24,470 ~ 24,460, while 24,406 ~ 24,412 remained the battleground for most of the day until the breakdown.
In a single session, yesterday’s dramatic 289-point recovery rally was completely erased — with Nifty closing at the bottom of the PDL and CDL.
Today’s close is now below the low of 12th May, marking a 64-session (88-day) low.
Now the question for Monday: will bearish momentum extend, or will some positive news bring bulls back into play?
🛡 5 Min Intraday Chart with Levels
Intraday Walk
🔻 Gap-down open below major support at 24580.
⏳ First 45 minutes: Steep drop of 150 points from the day high.
🛡️ Fib support at 24406–24412 holds multiple times… until the late break.
🔻 Post 3 PM: Support collapse leads to fresh lows below PDL.
📉 Close near day’s low — erasing yesterday’s bullish rally.
📉 Daily Time Frame Chart with Intraday Levels
🕯 Daily Candle Breakdown
Open: 24,544.25
High: 24,585.50
Low: 24,337.50
Close: 24,363.30
Change: −232.85 (−0.95%)
Structure:
Real Body: 180.95 pts (Red Candle — Close < Open)
Upper Wick: 41.25 pts
Lower Wick: 25.80 pts
Interpretation:
Strong bearish sentiment — sellers maintained control from open to close.
Very small lower wick — indicates conviction from sellers in closing near the low.
Wiped out prior day’s gains — buyers have lost the short-term edge.
Candle Type:
Bearish Marubozu (near-full body) — signals decisive selling pressure, often a continuation pattern after weakness.
🛡 5 Min Intraday Chart
🥷 Gladiator Strategy Update
ATR: 210.45
IB Range: 134.05 → Medium
Market Structure: Balanced
Trade Summary:
10:35 AM – Short Entry → SL Hit
📌 What’s Next? / Bias Direction
Below 24,400: Bearish momentum likely to extend toward 24,250–24,200.
Above 24,470: Only a strong reclaim can shift bias back to neutral.
Gap-down/weak open on Monday may accelerate selling; bounce attempts will face resistance at 24,400–24,470.
🔍 Support & Resistance Levels
Resistance Zones:
24,406 ~ 24,412
24,460 ~ 24,470
24,500
24,580
Support Zones:
24,315
24,280
24,240 ~ 24,225
24,185
💬 Final Thoughts
"Markets don’t turn on hope — they turn on price. Respect the levels, and let price lead the story."
Bulls had the glory on Thursday, but Friday flipped the script completely. The market now sits at a multi-month low — momentum favors bears, but Monday’s open will decide if we see follow-through selling or a sharp dead-cat bounce.
✏️ Disclaimer
This is just my personal viewpoint. Always consult your financial advisor before taking any action.
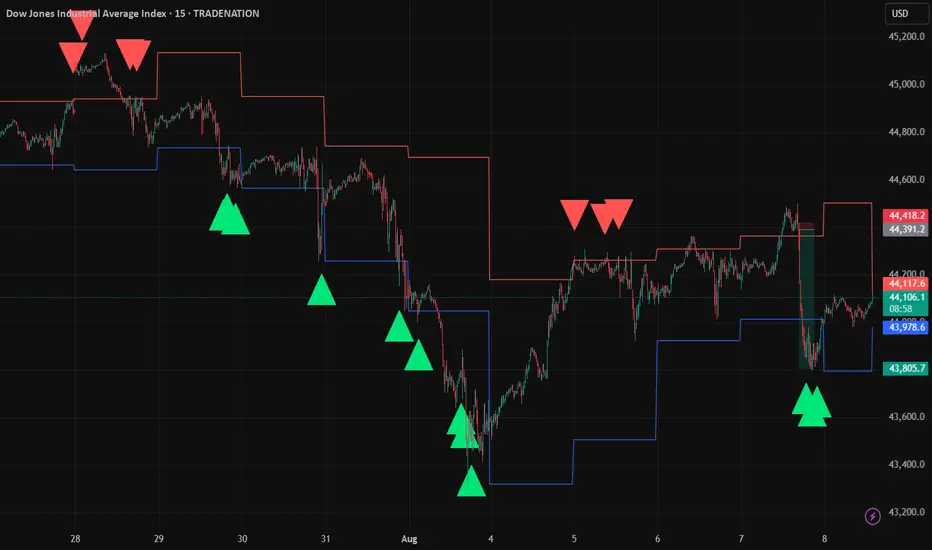
US30 Liquidity Grab Strategy – 15m Chart (1m Precision Entries)Description:
This idea showcases my Liquidity Grab Entry Signals strategy, optimized for US30.
The setup identifies daily high/low liquidity zones with a sensitivity buffer, then confirms reversals using strong engulfing candles.
Key Points:
Daily Liquidity Levels plotted automatically.
Buffer Zone detects price interaction with liquidity.
Engulfing Confirmation for higher probability entries.
Long when price rejects daily low with bullish engulfing.
Short when price rejects daily high with bearish engulfing.
While the precision entries are taken on the 1-minute chart, this 15-minute chart is shown for publication purposes in line with TradingView rules.
Example (Yesterday & Today):
Multiple clean rejections at daily liquidity zones.
Clear 1:15–1:20 R:R potential with minimal drawdown.
Risk Management:
Suggested SL: 10–15 points beyond liquidity zone.
Suggested TP: the next key level.
Precise 1 min entry shown here: