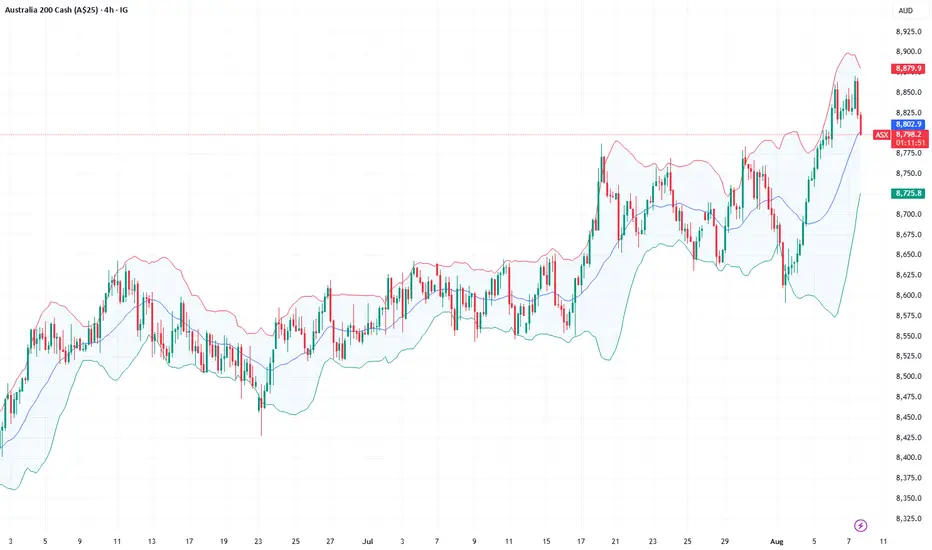
#ASX: The 9,000 countdown has begun.On August 7, 2025, the #ASX index surged to an all-time high of 8,856.9 points , driven by a rare mix of catalysts: soaring gold prices lifting major miners, expectations of simultaneous easing by the RBA and the Fed boosting bank and media-tech stocks, and steady demand for iron ore and base metals pushing BHP, Rio Tinto, and Fortescue higher. A global “risk-on” sentiment amid falling U.S. yields and short-covering added extra fuel.
Five key drivers that could push the #ASX to new heights:
1. China’s 2025 infrastructure push: Beijing is preparing an expanded lending package for transport and energy projects. This fuels iron ore and copper imports — directly boosting revenues for BHP, Rio Tinto, and Fortescue, which make up ~25% of the index.
2. Gold rally continues: The expected Fed rate cut in September pressures U.S. yields and supports gold prices. Even a move toward $3,500/oz could revive Northern Star, Evolution, and Newmont, adding dozens of points to the index.
3. Dovish RBA + weak AUD: Further rate cuts by the Reserve Bank of Australia (with AUDUSD staying below 0.64) make domestic loans cheaper while increasing export margins for resource and agri stocks.
4. Green metals boom: Rising global demand for lithium, nickel, and rare earths for batteries and renewables is driving up valuations of Pilbara Minerals, IGO, Lynas, and others — boosting the materials sector’s contribution to index growth.
5. Housing sector reversal: Lower mortgage rates and tax breaks for first-home buyers are lifting transaction volumes and online demand via REA Group. Rising home prices traditionally ignite banking and construction stocks, creating a multiplier effect on the index.
#ASX has already climbed near the top — and it has at least five major “boosters” for another rally. According to FreshForex , the index could break above 9,000 even faster if three extra catalysts come into play:
1. Superannuation fund inflows shift toward equities, adding long-term capital.
2. Buybacks and M&A by giants like BHP and Commonwealth Bank reduce float and boost EPS.
3. A fresh IPO wave of lithium and AI startups injects new tech momentum.
Market indices
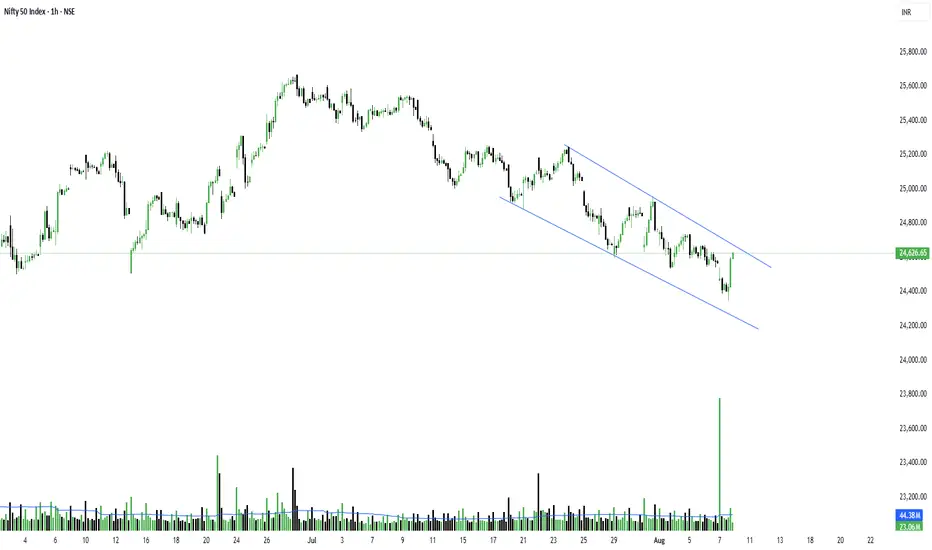
Nifty trend directionNifty 24596 has closed well gai ed the support. 24468.Volume burst suggest covering. Indicator is negatively diverged.fii's have sold contracts and pushed price high by selling derivatives.we expect nifty will face resistance at 24770 to 24855

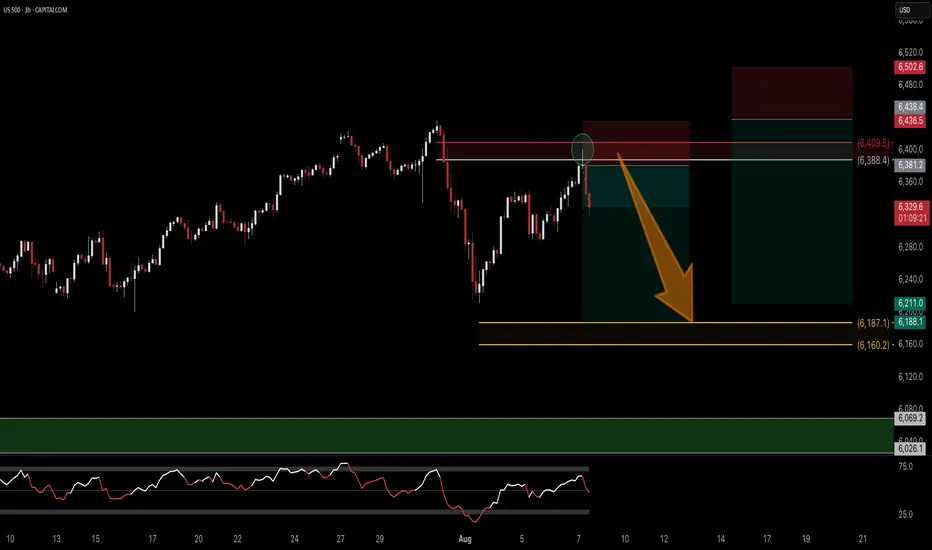
SP500 | Short | 3hrsThis technical analysis is for informational and educational purposes only. It does not constitute financial advice. Remember to always research and consult with a professional before making investment decisions. Good luck! 📈💼🚀
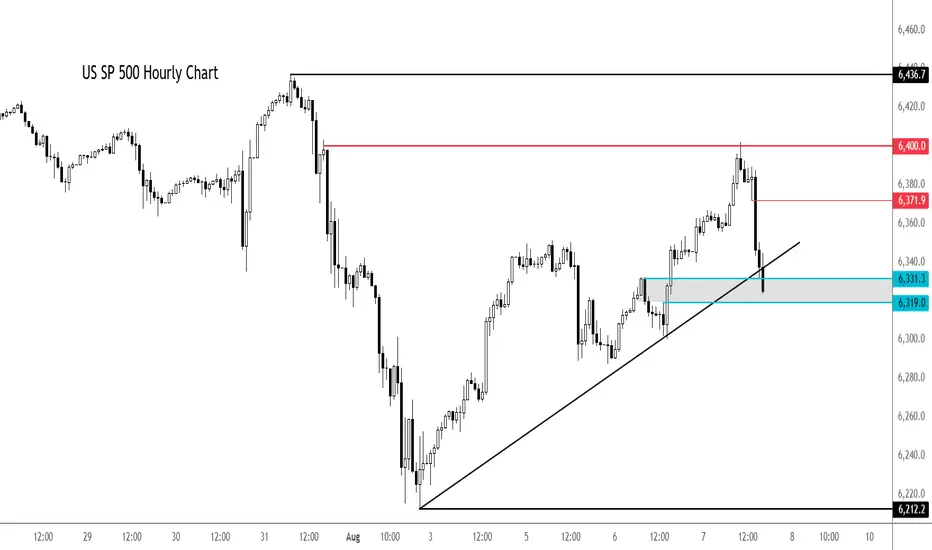
S&P 500 extends drop - can dip buyers come to rescue again?After a decent rally earlier in the day, the major indices and futures started to ease off around mid-morning London trade, before easing further lower in the last couple of hours.
At the time of writing, the S&P was testing its session lows. Here it was probing support and a short-term bullish trend line in the 6319-6331 range. This area needs to hold to keep the bulls happy and in charge. Break this and we could see a bigger correction in the days ahead.
Resistance now comes in at 6372 followed by 6,400.
By Fawad Razaqzada, markets analyst with FOREX>com
Nifty is bullish but the concern is...Total Volume and closing were strong today — that’s a good sign.
But the only concern is that sellers' volume was 218 million more than buyers. That’s a big gap and something we can’t ignore.
NSE:NIFTY Pivot is at 24,524, and Pivot Percentile is 0.29% — that’s slightly high, so expect volatility.
If Nifty opens with a gap down and then sustains above the Pivot for 1 hour, we might see a good upside, and it would be worth chasing.
A gap-up open won’t be ideal — a controlled open near the pivot is better.
Apart from sellers’ volume, everything else looks bullish.
Even the options data is pointing toward a move up, with a target zone near 24,800.
So, my view for tomorrow is cautiously bullish.
NSE:BANKNIFTY is looking much stronger than Nifty.
This time, the rally might be led by NSE:CNXPSUBANK .
- Support: 55,294
- Resistance: 55,650
If BankNifty moves, chances are Nifty will follow as well.
Top Sectors to Watch:
NSE:CNXIT
NSE:CNXPHARMA
If you remember, I had mentioned earlier — this time when the market starts bouncing back from the bottom, IT sector will be the first to run.
That’s all for today.
Plan your trade and Trade your plan.
Take care. Have a profitable tomorrow.
Nifty Analysis EOD – August 7, 2025 – Thursday🟢 Nifty Analysis EOD – August 7, 2025 – Thursday 🔴
A Trap, a Reversal, and a Breathless Rally — Did You Catch It?
🗞 Nifty Summary
Today was expected to be volatile, but few were prepared for how wildly Nifty behaved.
After a gap-down of 110 points on the back of negative global cues, Nifty immediately started filling the gap and reached the Previous Day Low (PDL). However, strong rejection at PDL sent prices tumbling — slicing below the Open, IB Low, and even the Current Day Low, marking a sharp low at 24,387.
Then came the bear trap.
A brief breakdown to 24,344.15 looked like a breakdown, but instead triggered a sharp liquidity grab, launching a vertical move upward. From that bottom, Nifty surged in a breathtaking rally — not a single 5-min candle broke its previous candle’s low, signaling relentless buying. Almost every resistance zone — Swing High, VWAP, PDL/S1, CPR, Weekly Low — got taken out in one single breath.
Did you ride it?
Honestly — I didn’t. I was frozen watching this dramatic reversal unfold.
Still, today’s super recovery puts the index back within its known range. Now, bulls need a close above 24,660–24,675 to confirm momentum.
📉 Intraday 5 Min Chart Overview
🧭 Intraday Price Action Flow
9:15 AM: Opens 110 points down at 24,467.10
9:15–10:30 AM: Recovers swiftly to PDL, but fails there.
10:25 AM – 11:05 PM: Sharp fall — breaches CDL & IB Low → makes new day low at 24,387
1:20 PM Onwards: Attempts consolidation; false breakdown at 24,344.15
2:00 PM – 3:30 PM: Monster rally → No candle breaks prior low; bulls dominate to close at 24,626.65
📉 Daily Time Frame Chart with Intraday Levels
🕯 Daily Candle Breakdown
Open: 24,464.20
High: 24,634.20
Low: 24,344.15
Close: 24,596.15
Change: +21.95 (+0.09%)
🔍 Candle Structure:
Real Body: Green → +131.95 pts
Upper Wick: 38.05 pts
Lower Wick: 120.05 pts
🧠 Interpretation:
Strong rejection from intraday lows near 24,344
Long lower wick shows dip buying strength
Closed near the highs = bulls dominated the end
Still within larger range → needs breakout above 24,675 for follow-through
🔥 Candle Type:
A bullish recovery candle, hammer-like, but within a sideways structure — shows aggressive buying near important demand zone (24,340–24,380).
📈 Updated Short-Term View – 7th August 2025
Support Zone: 24,340 – 24,380
Resistance Zone: 24,620 – 24,675
Bias: Neutral with a bullish tilt, unless 24,340 breaks decisively.
🎯 Trading Insight
A close above 24,660–24,675 may lead to further upside — possibly testing 24,735–24,780
Failure to hold above 24,460 will shift bias back to bearish
🛡 5 Min Intraday Chart
🥷 Gladiator Strategy Update
ATR: 205.09
IB Range: 82.85 → Medium
Market Structure: ImBalanced
⚔️ Trade Summary:
🕙 10:25 AM – Short Entry → Trail SL Hit (R:R = 1:1.8)
🧱 Support & Resistance Levels
🔼 Resistance Zones:
24,620
24,660 ~ 24,675
24,725 ~ 24,735
24,780 ~ 24,795
24,860 ~ 24,880
🔽 Support Zones:
24,542 ~ 24,535
24,500
24,470 ~ 24,460
24,380 ~ 24,344
💬 Final Thoughts
"Markets reward patience and punish rigidity."
Today was a masterclass in trap-reversal-breakout structure. While many were either trapped or missed the move, this type of price action reminds us — be ready, but never rigid.
Now all eyes on 24,675 — can bulls push above it and sustain?
✏️ Disclaimer:
This analysis reflects personal views and is not trading advice. Please consult your financial advisor before making decisions.

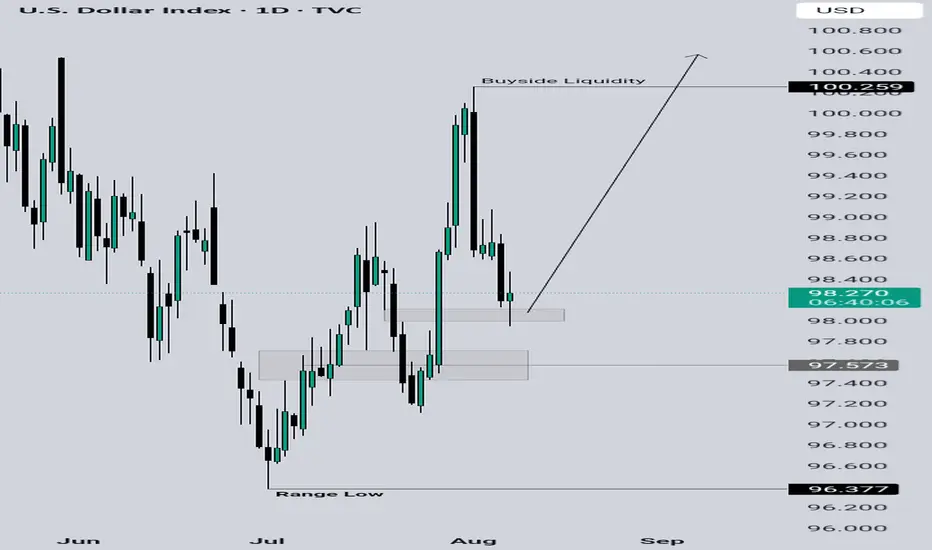
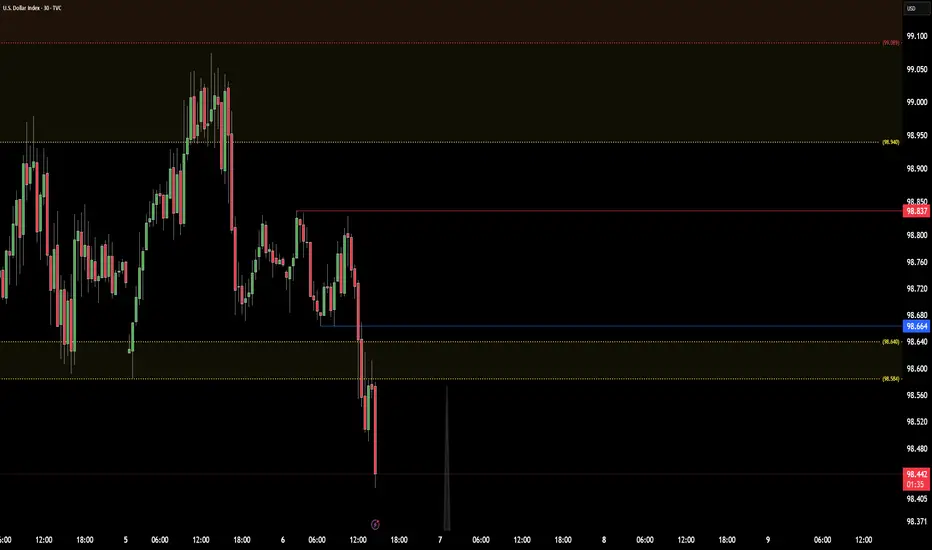
DXY ANALYSIS DXY trading within a defined range and as price prints, I'm busy refining my analysis. I'm currently looking for price to rally from here on and possibly trade back into the monthly trading range.

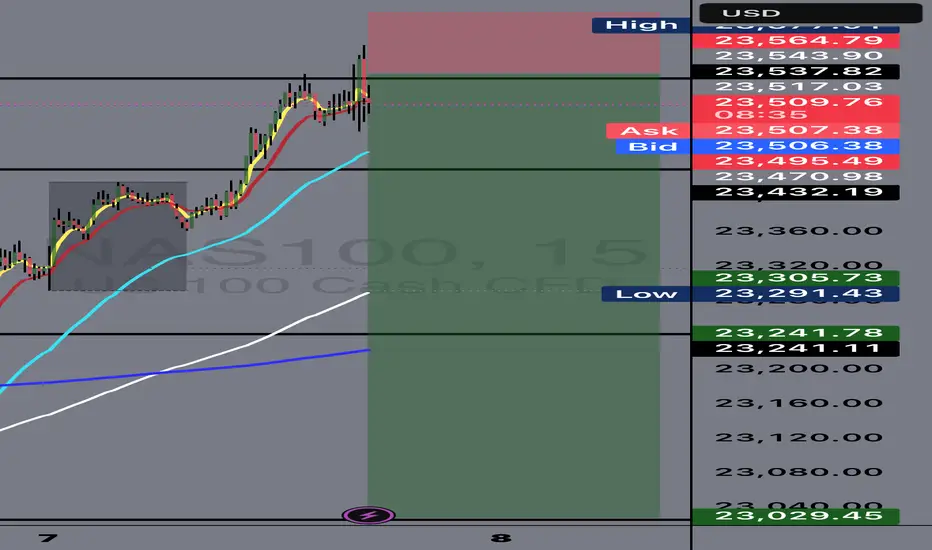
NQ long thursdays reversalmultiple SSMTs on the weekly and daily cycles
Expecting to do a 1-1 of the current range

A slight push to the upside - inboundWe're going to see a slight push to the upside, before NASley will do a proper drop for us to a position that has been support for a long time.
I'm of the opinion that she'll break that support, re-test it and then drop even further - motivated by the current political instability within the US and world in general.
Watch this move - It's going to be one for the books!
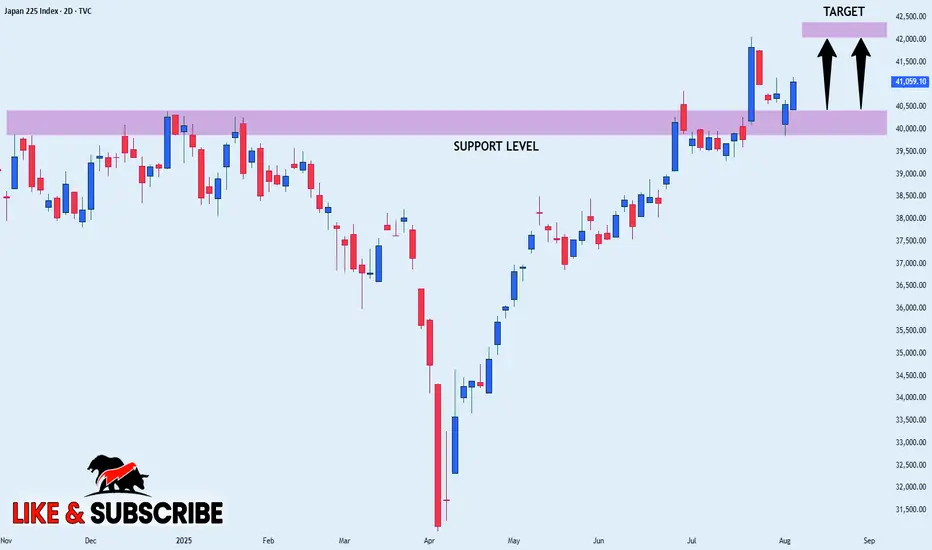
NIKKEI WILL KEEP GROWING|LONG|
✅NIKKEI is trading in an uptrend
And the index was making a bearish correction
But it has now retested a horizontal support level of 40,500
From where we are already seeing a bullish
Reaction and I am expecting the index to go further up
LONG🚀
✅Like and subscribe to never miss a new idea!✅
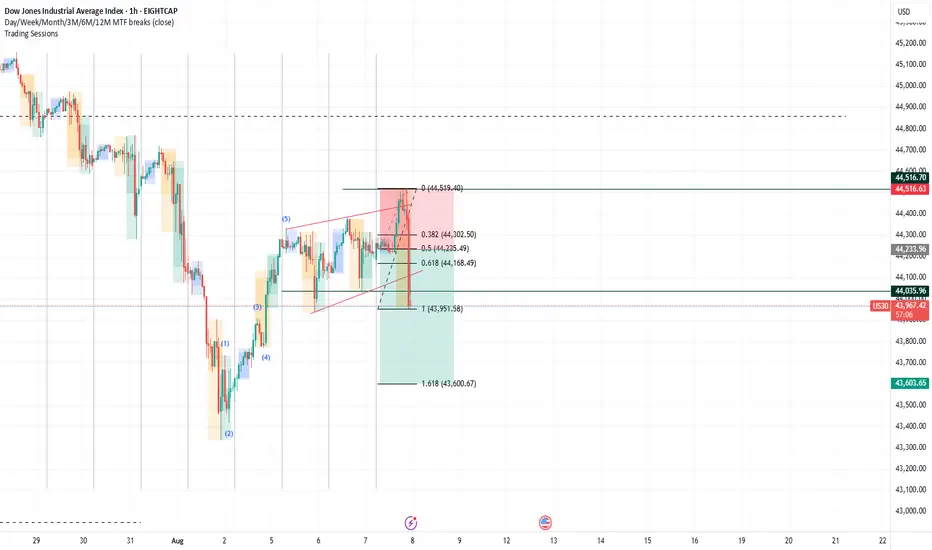
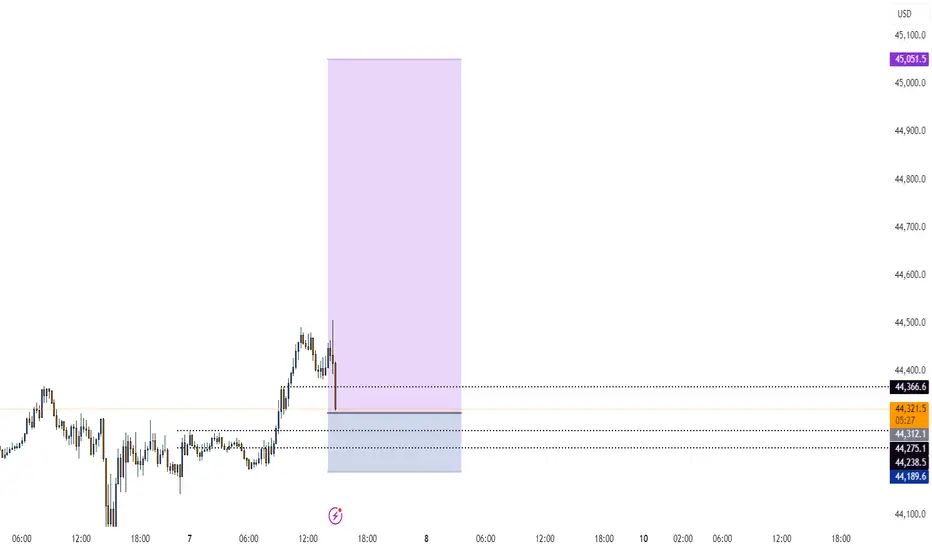
us30signal: sell (downtrend-H1)
setup: correction (wa to wb to wc)
confirmation:
1. fibo yes
2. snd yes
3. sbt yes

DXY (USDX): Trend in daily time frameThe color levels are very accurate levels of support and resistance in different time frames, and we have to wait for their reaction in these areas.
So, Please pay special attention to the very accurate trend, colored levels, and you must know that SETUP is very sensitive.
(((((we have two trend)))))
BEST,
MT

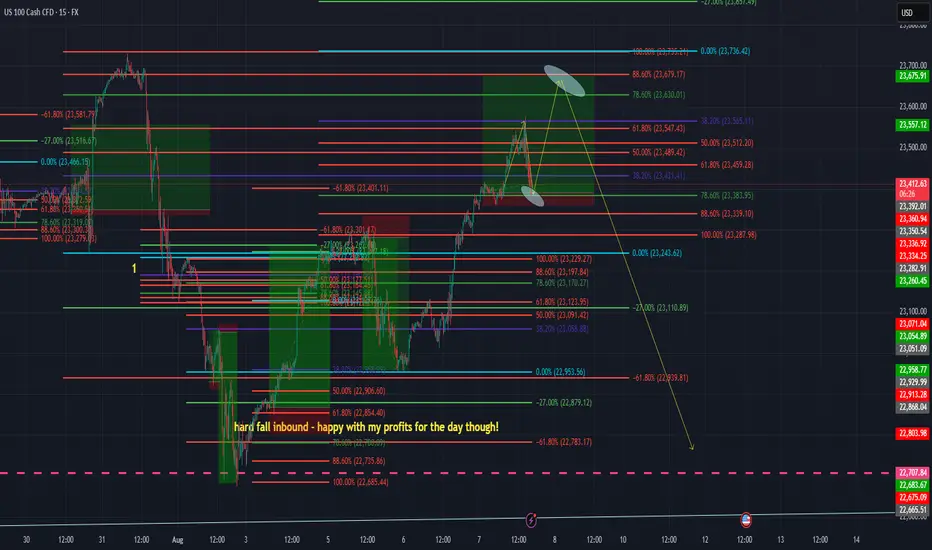
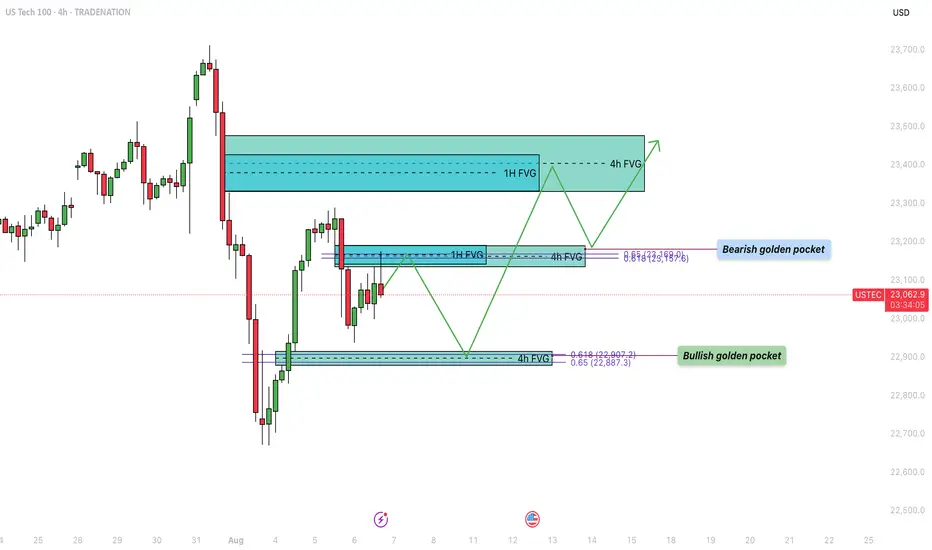
US100 - Bullish trajectory to fill the inbalance zones!Over the past week, the US Tech 100 (US100) experienced a sharp decline, dropping into a significant support zone. During this bearish move, several fair value gaps (FVGs) formed on both the 4-hour and 1-hour timeframes, which remain unfilled. Currently, price action is retracing upward, aiming to fill these imbalances. The structure of the market suggests that both bullish and bearish scenarios are in play, depending on how price reacts to key levels marked by these FVGs and Fibonacci retracement zones.
Bearish Resistance
The first major area of resistance is located around the $23,160 level, which has just been tapped. This zone presents a strong potential turning point due to the confluence of a 1-hour and a 4-hour fair value gap, which perfectly align with the 0.618–0.65 Fibonacci retracement level, also known as the golden pocket. This cluster of technical signals increases the probability that this level will act as a strong supply zone, potentially initiating a rejection back toward the lower support area.
Bullish Support
On the downside, a key level to watch is around $22,900. This zone marks a 4-hour FVG that was formed during the recent upward move. Importantly, this area also coincides with the golden pocket from that very same leg up, offering a compelling confluence for bullish support. If price revisits this level, it may act as a strong demand zone, providing a springboard for the next leg higher, particularly if buyers step in aggressively to defend it.
Bullish Trajectory
If support at $22,900 holds, the bullish trajectory suggests a possible continuation toward the $23,400 region. This upper target contains a large overlapping 1-hour and 4-hour FVG that remains unfilled. Historically, price tends to revisit and fill such imbalances before choosing a definitive direction. A bounce from the lower support zone and a successful break of the $23,160 resistance could pave the way for a clean move toward this higher target, completing the FVG fill sequence.
Final Thoughts
The US100 is currently navigating a key technical crossroads. With multiple unfilled fair value gaps and well-aligned Fibonacci levels on both the upside and downside, the next few sessions will be critical in determining short-term direction. If the $23,160 resistance continues to hold, a pullback to $22,900 could offer a high-probability long setup, while a clean break above this resistance opens the door to filling the higher FVGs.
-------------------------
Disclosure: I am part of Trade Nation's Influencer program and receive a monthly fee for using their TradingView charts in my analysis.
Thanks for your support. If you enjoyed this analysis, make sure to follow me so you don't miss the next one. And if you found it helpful, feel free to drop a like 👍 and leave a comment 💬, I’d love to hear your thoughts!
VIX looking good....While some are celebrating small wins the bigger picture is that the economy is NOT doing well and there will likely be a liquidity crisis at some point. The smartest investors are pilling up cash while retailers are the exit liquidity. From a TA perspective, historically the VIX is below its mean average and we're seeing it crossing 50SMA then most likely 200SMA lines. The VIX ALWAYS spikes and it will cross 20 very soon! Just look at the last week that's 2-3 good years in the S&P in a few hours. DM me for details on how to use ETFs.

DXYCOT Bearish Bias — Latest COT data shows increased short positions and reduced longs from institutions, signaling bearish sentiment. Expecting continued downside as supply pressure outweighs demand.
Bank Nifty bounce from AVWAP After sharp correction BANK nifty finally bounce from Anchored Vwap support if hold this level probability high to outperform .

US500: Rebound Setup After Sharp Pullback – Key Support HoldingUS500 has experienced a strong corrective move after an extended bullish run but is now showing signs of stabilizing near a key support area. This zone aligns with both technical retracement levels and the market's reaction to fundamental shifts—particularly the dovish repricing of the Fed following weak US jobs data.
Technical Analysis (4H Chart)
Pattern: After a strong uptrend, price faced a steep correction, forming a potential short-term reversal setup.
Current Level: 6,235, holding above the 6,217 support zone.
Key Support Levels:
6,217 (immediate support; key defense zone for bulls).
6,171 (38.2% retracement, secondary support if deeper pullback occurs).
Resistance Levels:
6,272 (23.6% retracement and initial resistance).
6,360 (upper resistance zone and retest of recent breakdown).
6,429/6,436 (recent high and target if bullish momentum resumes).
Projection: A rebound from current levels could push US500 back toward 6,360–6,430 if support holds.
Fundamental Analysis
Bias: Neutral-to-bullish as macro drivers favor a recovery from pullback.
Key Fundamentals:
Fed Policy: Weak US jobs (+73K) and downward revisions have solidified rate cut expectations (~75% probability in September), boosting equity sentiment.
Inflation: Market awaits US CPI; softer data would further support equities.
Tariffs: While Trump’s tariffs create a medium-term risk for earnings, immediate Fed easing bets outweigh these concerns.
Risk Sentiment: Global risk remains supported by lower yields and optimism about Fed easing.
Risks:
Hot US CPI could reverse cut expectations, pressuring equities.
Geopolitical risks or tariff escalation could trigger renewed selling.
Key Events:
US CPI and PPI.
Fed speeches and rate expectations.
Earnings reports from key US companies.
Leader/Lagger Dynamics
US500 is a leader, driving global risk sentiment and influencing risk-sensitive assets like AUD/USD, NZD/USD, and JPY crosses.
Summary: Bias and Watchpoints
US500 is neutral-to-bullish, stabilizing at key support (6,217) after a sharp correction. Fed cut expectations and risk-on sentiment support the upside scenario, targeting 6,360–6,430 if US CPI aligns with softer inflation. However, a hot CPI print could invalidate this rebound and trigger another leg lower.

US500 one last leg upI do not want to sound 100% like David Hunter, but I recon max upside in this cycle is approaching and will be somewhere between 7000$ to 7400$, from there a correction of at least 25% is very likely

Nifty bounce from Anchored VWAPAfter sharp correction nifty finally bounce from Anchored Vwap support if hold this level probability high to outperform .
