Market indices
Potential GER40 (DAX) Short SetupHey everyone,
Just wanted to share my personal analysis and the trade plan I've put together for the GER40 on the 1-hour chart. I'm still learning, so a big part of my process is documenting my ideas to see how they play out. I would be grateful for any thoughts or feedback you might have.
What I'm Seeing on the Chart:
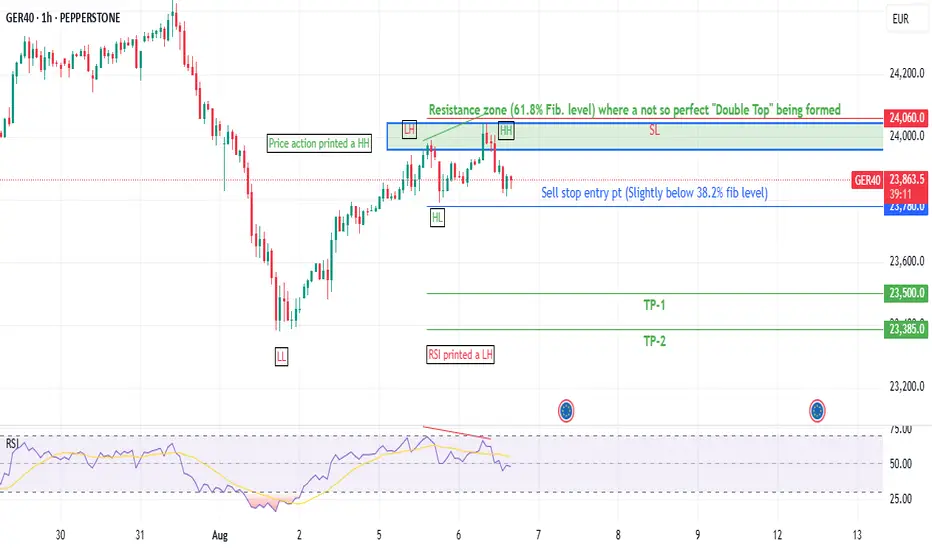
A Potential Double Top: I've spotted what appears to be a double top pattern forming up near the €24,000 - €24,060 area. To me, it looks like the recent rally might be showing signs of exhaustion here.
Bearish Divergence: What makes this setup more interesting to me is the bearish divergence on the RSI. Even though the price pushed to a slightly higher high, the RSI indicator made a lower high. My understanding is that this can suggest fading buying momentum.
Fibonacci Level: I also noticed that this rejection seems to be happening right around the key 61.8% Fibonacci retracement level from the last major down-move. When a few different signs seem to line up like this, I tend to pay closer attention.
My Personal Trade Plan:
My game plan is to be patient and only consider an entry if the price breaks below the recent lows, which would help confirm the bearish idea for me.
Entry (Sell Stop): $23,780
Stop Loss: $24,060 (I'll place this above the recent high, as a move above here would suggest my bearish idea is likely wrong).
Take Profit 1: $23,500
Take Profit 2: $23,385
Important: Please remember, I'm a humble trader from Pakistan still on my learning journey. This is simply me sharing my trade journal and thoughts, and it is not financial advice. Please always do your own analysis. Stay safe out there!
#GER40 #DAX #TechnicalAnalysis #Short #TradingJournal #LearningToTrade #Tradingidea #Sarmaaya
US500 Needs retracementVery good opportunity to sell above 6400... and then i expect it to touch 6085

SPX500 - what's next?Further to my previous idea on SPX.
SPX respected the Resistance at FR 161.8 at 6400.
Price went down and reverted form SMA200 (4H)
Now price has completed the Perfect Gartley Pattern and reached point D.
If (against fundamentals) price reverts down from there and breaks down through SMA50 (4h), I will consider it as Bearish Validation and I will expect correction movement, which cen go down to ca 6000.
Just my humble opinion

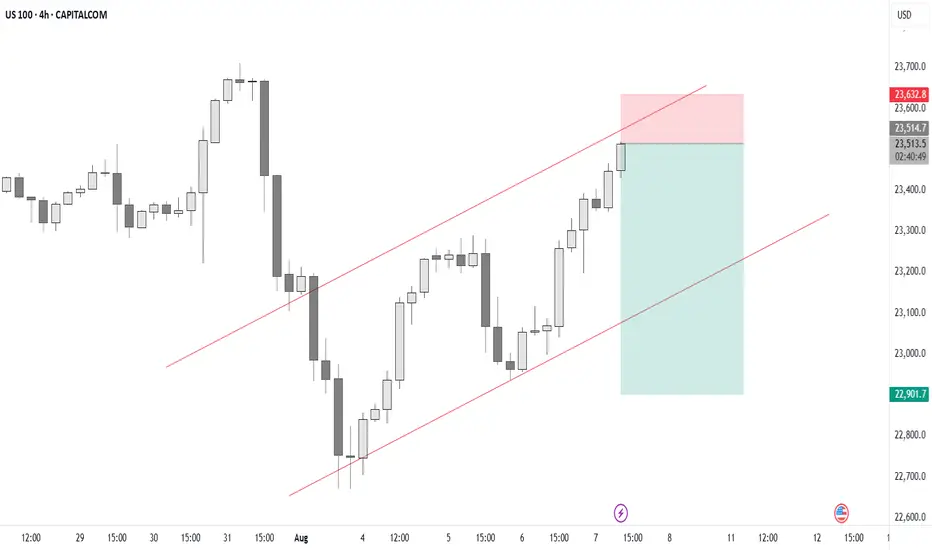
Technical Analysis of US100 on TradingView A trader is analyzing the US100 (Nasdaq 100 Index) using a 4-hour chart on TradingView. The chart displays a clear upward channel, with price action bouncing off the lower boundary and heading toward the upper trendline. A blue arrow indicates a bullish prediction, anticipating further upward movement. Support and resistance zones are highlighted, and the setup suggests a continuation of the bullish trend.
📊 Chart Overview:
Timeframe: 4-hour (H4)
Instrument: US100 (Nasdaq 100 Index)
Platform: TradingView via Capital.com
Date/Time in Chart: 25th August, 10:00 (likely UTC)
---
📈 Trend Analysis:
The price is moving within an upward parallel channel, indicating a strong bullish trend.
The chart shows multiple touches of both the upper and lower bounds of the channel, confirming its validity.
---
🟩 Support and Resistance:
Support Zone: Around 22,850–23,050 (highlighted by the green rectangular box).
Price bounced sharply from this area, showing buyers are defending it.
Resistance Area (Projected): Upper bound of the channel, which aligns with the 24,000 level.
---
🕊️ Current Market Behavior:
The price recently bounced off the lower channel boundary and the key support zone.
A strong bullish candle broke through a mini pullback area, suggesting momentum is favoring buyers.
The blue arrow indicates an expected continuation upward toward the upper resistance line.
---
📌 Technical Implications:
Bullish Bias: As long as price remains inside the channel and above the support zone, the bullish trend is intact.
A retest of the upper channel line (~24,000) is a realistic target if momentum continues.
Invalidation Level: A clean break below the support zone (~22,850) and out of the channel could shift sentiment to bearish.
---
✅ Possible Trade Idea (for Educational Purposes):
Entry: Around 23,400–23,500 (already in motion)
Target: 23,900–24,000 (upper channel line)
Stop-loss: Below 22,850 (beneath the support zone)

US30 with A/J strategy Not saying that mach please keep in mind we have to protect the capital and follow the trend move please read the candles and follow the moves we have strong high on 1hr and 4hr also quick shift when you look down 15m S/Lows

NAS100 LTF Bearish CorrectionAlthough overall trend is still bullish on Higher TFs, here is a high probability setup for a bearish correction on M15 TF

DowJones oversold bounce back supported at 44020Key Support and Resistance Levels
Resistance Level 1: 44708
Resistance Level 2: 44925
Resistance Level 3: 44128
Support Level 1: 44020
Support Level 2: 44760
Support Level 3: 43477
This communication is for informational purposes only and should not be viewed as any form of recommendation as to a particular course of action or as investment advice. It is not intended as an offer or solicitation for the purchase or sale of any financial instrument or as an official confirmation of any transaction. Opinions, estimates and assumptions expressed herein are made as of the date of this communication and are subject to change without notice. This communication has been prepared based upon information, including market prices, data and other information, believed to be reliable; however, Trade Nation does not warrant its completeness or accuracy. All market prices and market data contained in or attached to this communication are indicative and subject to change without notice.

S&P bullish continuation supported at 6340Tariff Turmoil and Geopolitical Shifts – Implications for S&P 500 Trading
Donald Trump's sweeping new tariffs officially took effect, hitting nearly all U.S. trading partners. Switzerland, facing the steepest rates among developed nations, may retaliate by cancelling a major fighter jet purchase, signaling potential defense-sector implications.
Key developments:
Semiconductor imports to face 100% tariffs, unless production is moved onshore – a bullish signal for domestic chipmakers (e.g., Intel, GlobalFoundries) but negative for firms reliant on overseas fabs.
Additional tariffs floated on China over purchases of Russian oil, echoing similar penalties on India – suggesting growing fragmentation in global trade.
Market impact:
S&P 500 sectors likely affected:
Tech (Semis): Tariff pressure may weigh on multinationals like Nvidia or AMD short term, but benefit domestic fabs and U.S.-based supply chains.
Industrials/Defense: Swiss retaliation could ripple through defense contractors if deals are halted.
Energy/Commodities: Any China-Russia oil tensions could lead to energy volatility, affecting names like ExxonMobil or ConocoPhillips.
Meanwhile, China’s exports unexpectedly rose, softening the blow from the U.S. tariff crackdown. Chinese equity gains could calm broader EM sentiment, helping mitigate global risk-off contagion.
Finally, Trump signaled potential peace talks with Putin and Zelenskiy, with the Kremlin confirming a Putin meeting soon. A diplomatic breakthrough could ease geopolitical risk, supporting investor sentiment and equities globally.
Bottom Line for S&P 500:
Expect sector rotation as traders digest tariff fallout. Watch for:
Strength in domestically focused tech and defense stocks
Caution around globally exposed industrials and semis
Short-term volatility tied to trade rhetoric and geopolitical headlines
Key Support and Resistance Levels
Resistance Level 1: 6437
Resistance Level 2: 6480
Resistance Level 3: 6520
Support Level 1: 6340
Support Level 2: 6295
Support Level 3: 6256
This communication is for informational purposes only and should not be viewed as any form of recommendation as to a particular course of action or as investment advice. It is not intended as an offer or solicitation for the purchase or sale of any financial instrument or as an official confirmation of any transaction. Opinions, estimates and assumptions expressed herein are made as of the date of this communication and are subject to change without notice. This communication has been prepared based upon information, including market prices, data and other information, believed to be reliable; however, Trade Nation does not warrant its completeness or accuracy. All market prices and market data contained in or attached to this communication are indicative and subject to change without notice.

"Nifty Is Developing a New Trend""The index needs to test the 24450-24500 range again to regain positivity, as these levels are expected to act as key support. Once these levels are tested and hold as support, it could be a good opportunity to play swing long positions in the market."

Short Looking for major bearish momentum when market reaches 44,740 having multiple previous rejections at this level.

USNAS100 Gains on Tariff Exemption Hopes – 23690 in SightUSNAS100 – Market Overview
Tech shares lift Wall St futures on tariff exemption hopes
U.S. stock index futures rose on Thursday as optimism grows that major tech companies may be exempt from President Trump’s latest tariffs on chip imports, supporting continued strength in the tech sector.
Technical Outlook
USNAS100 has gained nearly +400 points since yesterday, maintaining strong bullish momentum.
As long as the price holds above 23440, the uptrend is expected to continue toward 23690, with potential to extend to 23870.
However, a 1H close below 23440 would suggest weakening momentum and could trigger a correction toward 23295.
Resistance: 23690 – 23870
Support: 23295 – 23045

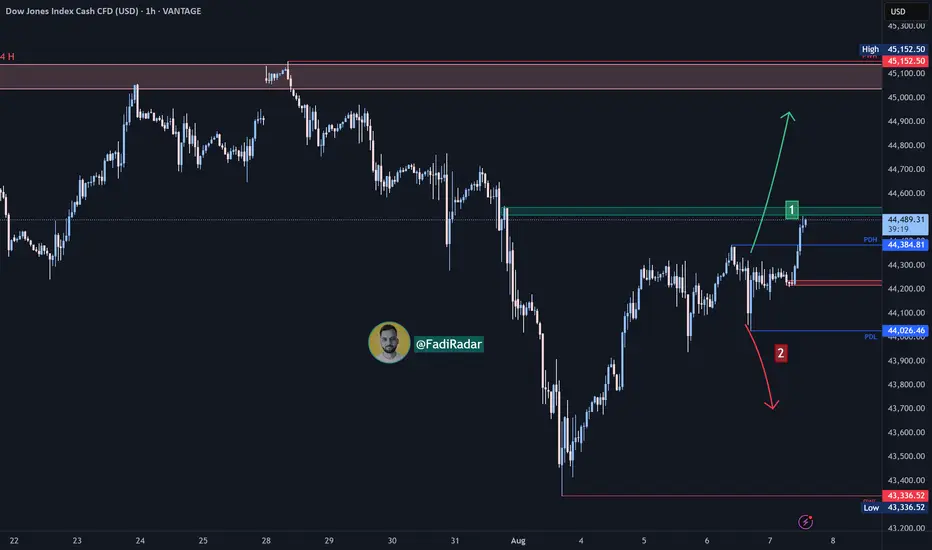
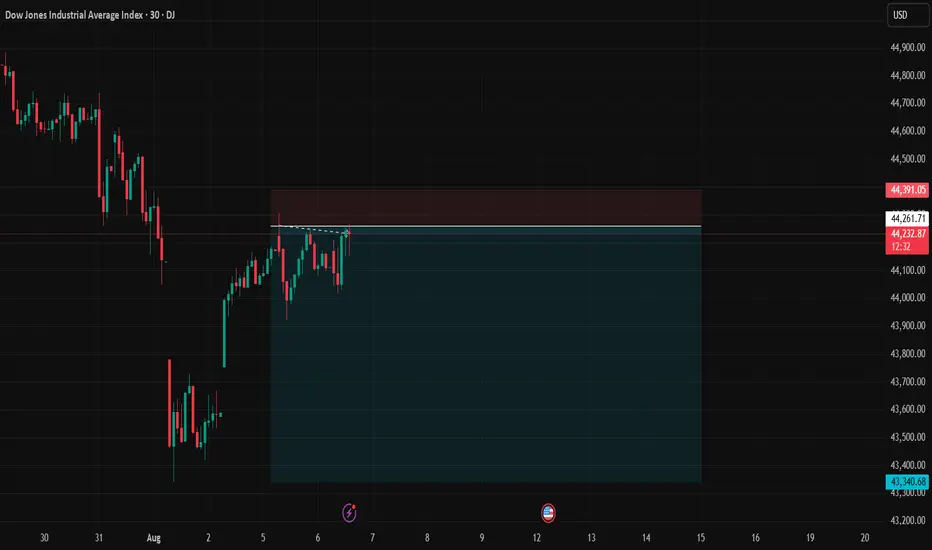
Dow Jones Index (US30 / Dow Jones) Analysis:The Dow Jones index opened the day with bullish momentum and is currently trading near 44,500.
🔻 Bearish Scenario:
If the price fails to break above 44,500 and selling pressure returns, a break below 44,200 could push the index back toward 44,000, which is a key support in the short term. A confirmed break below that level may open the way for a drop toward 43,700.
🔺 Bullish Scenario:
If the price breaks and holds above 44,500, which is the more likely scenario, we could see continued upside movement toward 44,700, followed by the strong resistance zone at 45,000.
⚠️ Disclaimer:
This analysis is not financial advice. It is recommended to monitor the markets and carefully analyze the data before making any investment decisions.
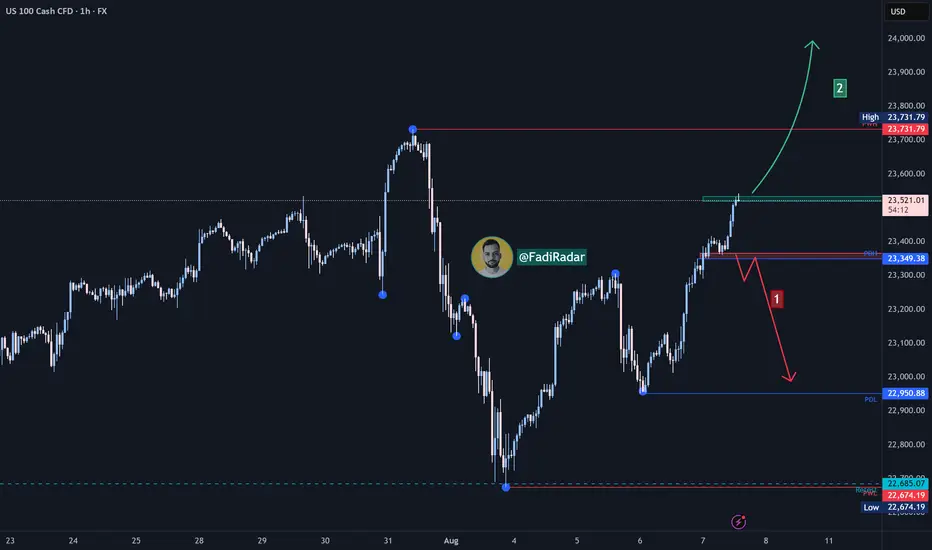
NASDAQ Index (US100 / NASDAQ) Analysis:The NASDAQ index has shown strong bullish momentum recently and is currently trading near a key resistance level at 23,530.
🔻 Bearish Scenario:
If the price fails to break above 23,530 and selling pressure begins to appear, we may see a downside correction toward 23,350. A break below this level could extend the decline toward 23,000.
🔺 Bullish Scenario:
If the price successfully breaks and holds above 23,530, it could support a continued move upward toward 23,730 as the first target. With sustained momentum, we might see a further push toward 24,000.
⚠️ Disclaimer:
This analysis is not financial advice. It is recommended to monitor the markets and carefully analyze the data before making any investment decisions.
US30 Bullish Bias Builds on Fed and Earnings OptimismUS30 – Market Overview
The market is showing bullish momentum, supported by recent developments from the Federal Reserve and a strong corporate earnings season.
Technically, the price action suggests a continuation of the uptrend toward 44610.
🔻 However, bearish momentum may be triggered if the price breaks below 44170.
🔹 Resistance: 44360, 44610 – 44820
🔹 Support: 44170 – 43960 – 43630

The Nifty is currently developing a new trend"The index needs to test the 24450-24500 range again to regain positivity, with these levels expected to act as key support. A successful test of this support zone could present an opportunity for swing long positions."

S&P 500 Futures Hold Ground After Tariffs Take EffectS&P 500 Futures Rise After New Tariffs Kick In
President Trump's sweeping tariffs officially took effect just after midnight, escalating trade tensions with dozens of countries. While negotiations are ongoing behind the scenes to secure exemptions and reduce tariff rates, market reactions are already underway.
Technical Outlook
S&P 500 Futures continue to show bullish momentum as long as price trades above 6289, with the potential to retest the All-Time High (ATH).
To confirm a move toward 6453, price must close above 6437 on the 1H chart.
🔻 However, if the price stabilizes below 6389, a correction toward 6365 becomes more likely.
Key Levels:
🔹 Resistance: 6424 – 6453
🔹 Support: 6365 – 6341

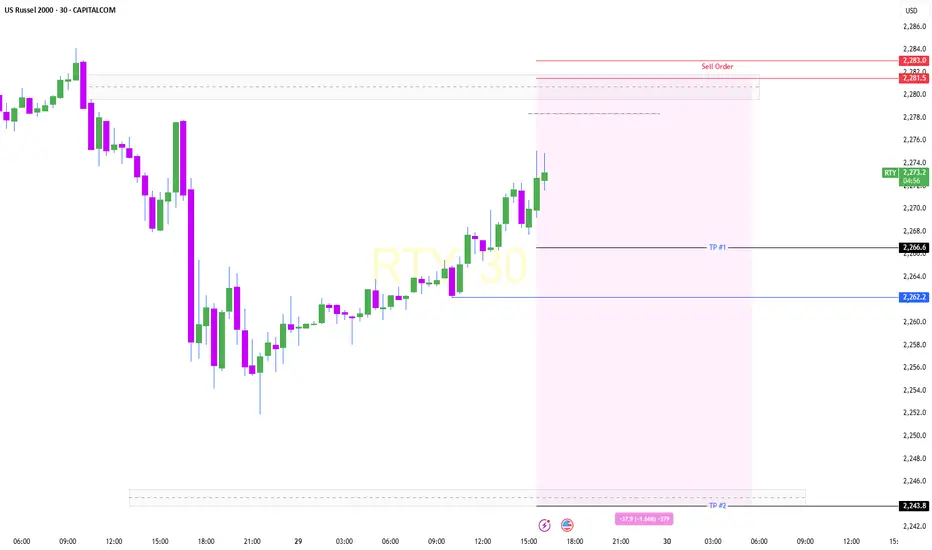
SHORT ON SPX/USDSpy has created a Double top followed by a CHOC and retest to the downside.
Their is plenty sell side liquidity to be collected as I expect a major drop on spy.
Looking to catch 300-400 points on SPY.

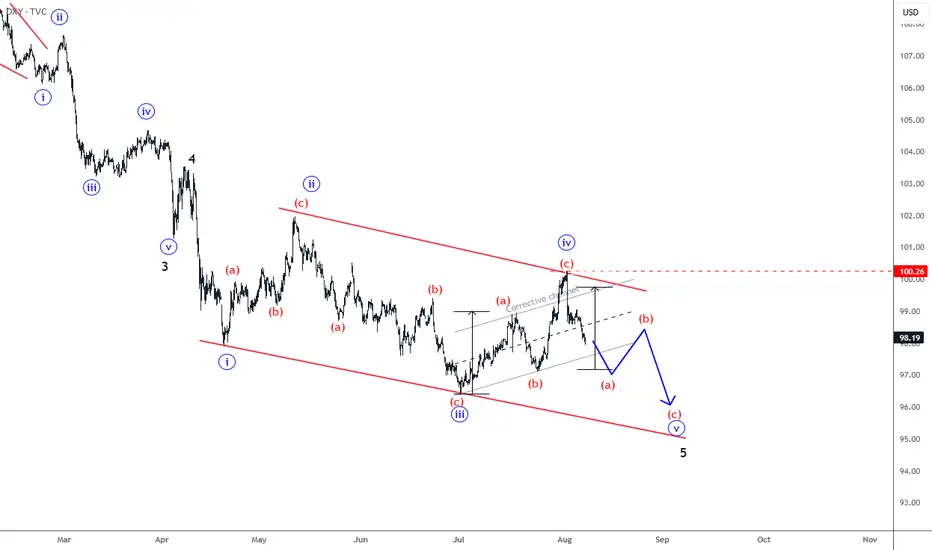
DXY Is Still Bearish; Final Leg Of The Wedge Pattern?DXY Is Still Bearish, but it can be trading in final leg of ending diagonal a.k.a. wedge pattern from technical and Elliott wave perspective.
US Dollar Index – DXY made only a three-wave rise from the lows, which indicates for a correction within downtrend. So recovery can basically still be a fourth wave rally, just a bit deeper one that can still belong to an ending diagonal a.k.a. wedge pattern. Final wave “v” of 5 can be still missing, so be aware of a continuation lower within a new three-wave abc decline, especially if breaks below the lower side of the corrective channel near 97.70 level.
Sell US100US100 Sell idea. This trade setup is based on a bearish flag pattern seen on the 4HR chart. Let us see how price reacts from this resistance.
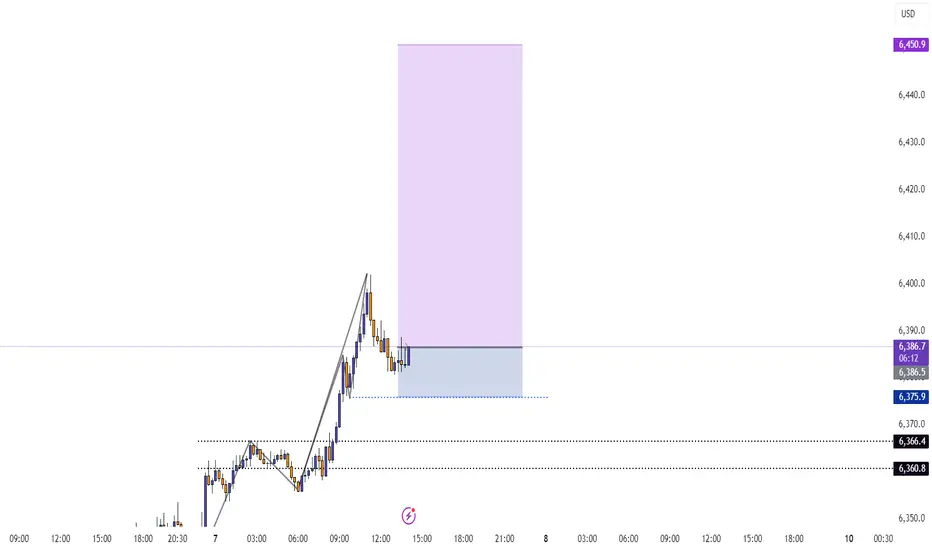
SPY Pull back into another earnings week?An engulfing weekly candle is no joke. Sellers are in control.
There is a strong possibility of a pull back and with bias being short, I am looking for a strong LH on the 1/2HR TF to form at 6330 as 50% or 6370- 6375 near the weekly POC.
Confluences for Pull back scenario
- Price bounced off 38.2% fib from 5930 to ATH
- Price found support at 200 ema on 4HR
- 1 HR MACD is building up bullish signal
Have a great week all!
