Nifty !!Nifty at the deciding point. I cannot write my view but some people will get an idea what I am talking about.
Market indices

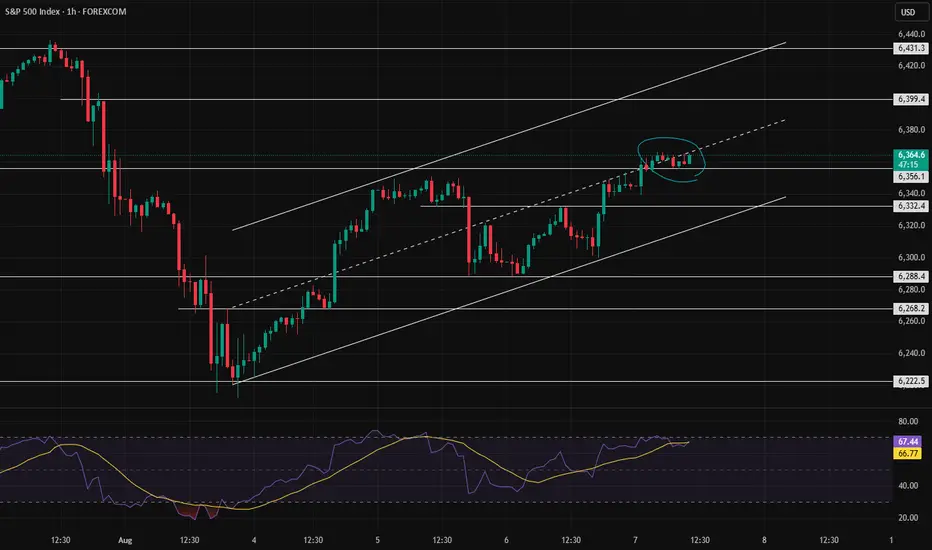
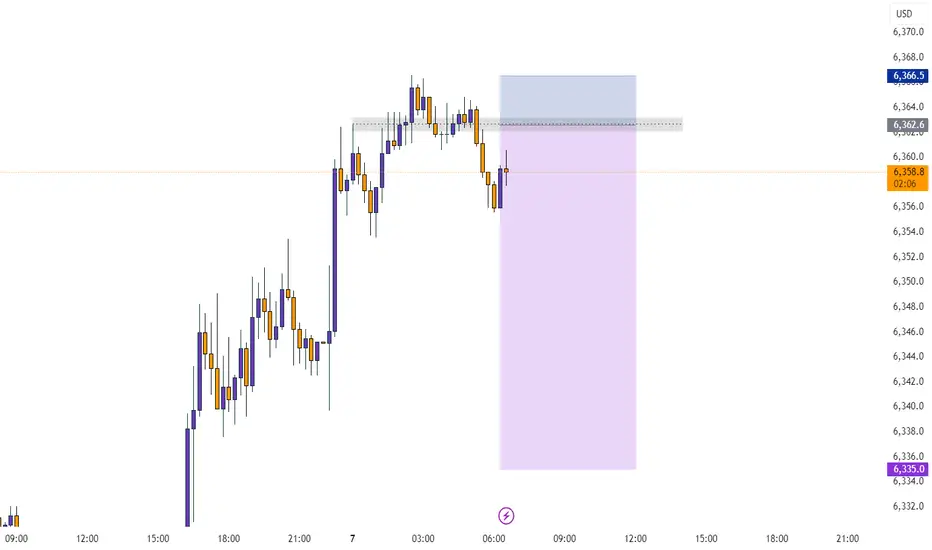
4H Analysis of Dow Jones | Selling Pressure Below Key Resistance4H Analysis of Dow Jones
🔸 Price is currently trading below a key resistance level and has yet to break above it.
🔻 If weakness persists, a bearish reversal toward lower support levels is likely.
🔹 A confirmed breakout above the resistance could open the path for further upside.
✅ Price reaction to this resistance will determine the next market direction.
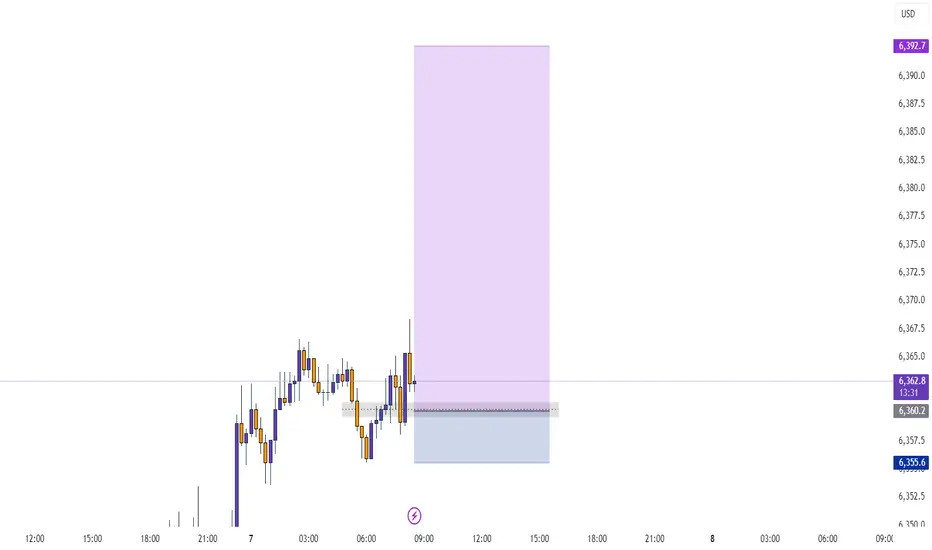


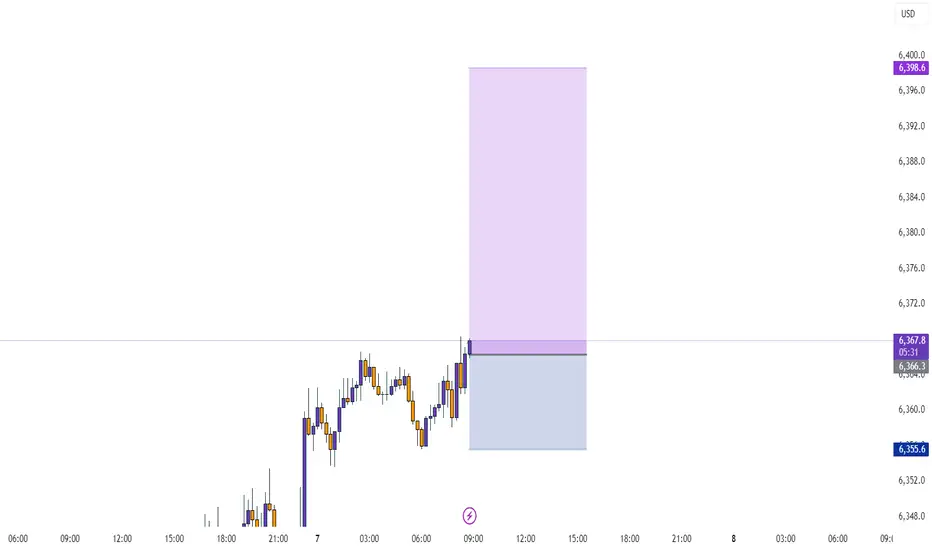
Decision pointThe weakness of the trend is clearly visible, but we need to see how it reacts to the channel’s midline. If buying pressure increases, the price could reach 6400. Otherwise, a correction down to around 6330 is likely.
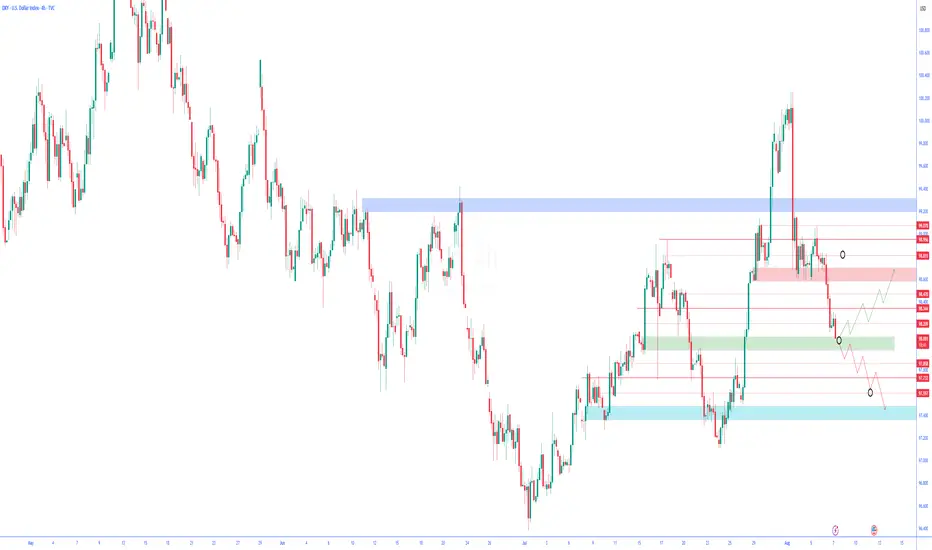
Technical Analysis of the US Dollar Index (DXY) | 4-Hour Timefr🟢 Technical Analysis of the US Dollar Index (DXY) | 4-Hour Timeframe
On the 4-hour chart, the US Dollar Index has recently formed a Drop-Base-Drop (DBD) structure and is now positioned on a significant support level. This area can play a critical role in traders' decision-making for the next move.
✅ Current Situation:
After the initial drop, the price entered a short-term base/consolidation phase, then continued its decline and is now testing a demand zone (support). In this structure, two potential scenarios are worth considering:
🔼 Bullish Scenario:
If the price reacts positively to this support zone:
A rebound toward previous supply areas is likely.
Holding above the first resistance could indicate a temporary or even long-term trend reversal.
This level may provide a low-risk entry opportunity for buyers targeting a reversal.
🔽 Bearish Scenario:
If selling pressure continues and the current support breaks:
A further drop as part of a third wave (impulse) may unfold.
Lower support zones would become the next target areas for sellers.

Markets in Rotation: Cyclical Stocks Take the Lead in 2025Markets in Rotation: Cyclical Stocks Take the Lead in 2025
Ion Jauregui – Analyst at ActivTrades
In a 2025 marked by tariff uncertainty, persistent geopolitical tensions, and stock markets that started the year at record highs, it seemed reasonable to favor defensive stocks. However, market behavior has made it clear that the rotation toward cyclical sectors has taken firm hold, leaving behind traditionally more stable segments. Since the imposition of reciprocal tariffs between the United States and China on April 2nd—an event known as "Liberation Day"—the indices experienced a brief correction that temporarily favored defensive sectors. Nevertheless, the swift rebound, led by U.S. equities, has returned the spotlight to cyclical stocks, which are now trading at historical highs relative to defensives, according to Bloomberg and Bank of America data.
According to MSCI classification, cyclical sectors include consumer discretionary, technology, industrials, financials, real estate, communication services, and basic resources. In contrast, defensive sectors consist of consumer staples, healthcare, energy, and utilities.
Leaders of the Rotation: Financials and Technology
In this context, two sectors have led the rotation: financials and technology. The former benefits from a high interest rate environment that boosts profit margins. In Europe, this backdrop has also fueled a rally in the banking sector, with the Stoxx 600 Banks index up 39% year-to-date. Meanwhile, the technology sector remains dominated by the “Magnificent Seven,” with Nvidia (+33%), Meta (+33%), and Microsoft (+27%) delivering strong gains thanks to the momentum of artificial intelligence and demand for digital solutions.
Lagging Sectors: Energy and Healthcare
On the other hand, the energy and healthcare sectors have weighed on defensive performance. Energy is suffering from bearish pressure on oil prices, driven by an oversupply led by OPEC. Healthcare has been hurt by former President Trump's proposals to lower drug prices in the U.S., directly impacting the margins of major pharmaceutical companies.
Rotation Reaches Europe: EuroStoxx 50 and DAX 40 on the Rise
Europe hasn’t been immune to this rotation. Both the EuroStoxx 50 and the DAX 40 have reflected this shift, especially benefiting banks, tech, and industrials, while leaving traditional defensive sectors lagging.
EuroStoxx 50: Boosted by Banking and Industry
The EuroStoxx 50, the eurozone’s benchmark index, is up 11.2% so far in 2025, thanks to strong performance in banking and industrials. Institutions like BNP Paribas, Santander, and ING have gained more than 30%, supported by high rates and share buyback programs. Industrial giants like Airbus and Siemens have also stood out, driven by increased investment in infrastructure and defense.
In contrast, defensive sectors like utilities and consumer staples have posted flat or negative returns, penalized by declining consumption in southern Europe and margin compression in energy.
DAX 40: Germany Aligns with the Cycle
Germany’s benchmark DAX 40 index has risen 13.8% year-to-date, strengthened by domestic recovery and exposure to cyclical sectors.
• SAP (+22%) and Infineon (+31%) lead the tech segment, benefiting from industrial digitalization and AI adoption.
• The automotive sector has also rebounded, with BMW and Mercedes-Benz gaining ground due to stabilization in the Asian market and the shift toward electric vehicles.
Conversely, healthcare companies such as Bayer and Fresenius have issued guidance cuts, reflecting global weakness in the sector amid regulatory pressure and legal challenges.
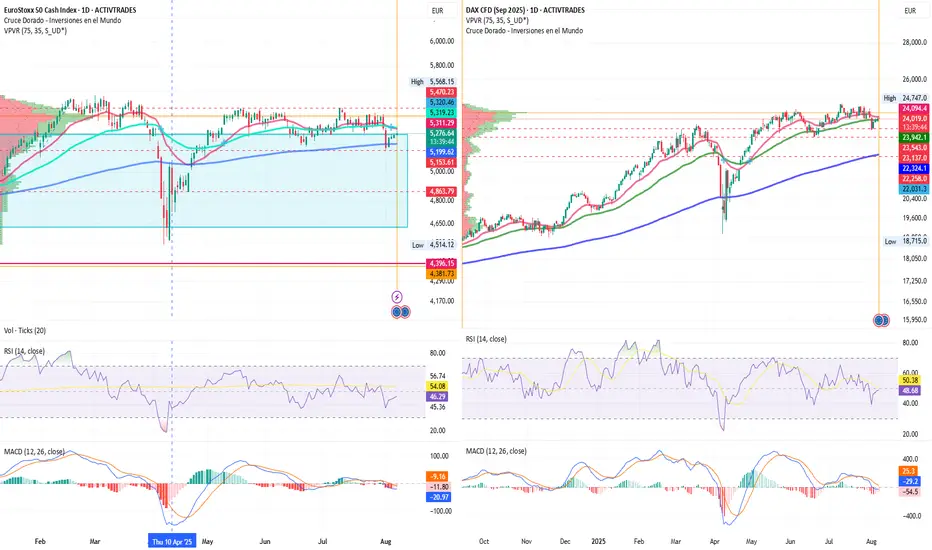
Technical Analysis – EuroStoxx 50
Current price (August 7, 2025): 5,288 points
YTD Change: +15%
Trend
• The index maintains a medium-term bullish structure, respecting an ascending trendline from the October 2023 lows.
• After the April correction driven by tariffs, the EuroStoxx 50 has regained ground and is now trading near its yearly high.
Key Levels
• Main Resistance: 5,470.23 → A breakout with volume could project a move toward the year’s high at 5,568.15
• Immediate Support: 5,153.61 → 100-day MA crossing above the 50-day may signal a corrective phase toward support
• Major Support: 4,863.79 and April lows at 4,514.12 → Technical and psychological level aligned with the April correction
Likely Scenario
• As long as the index holds above 4,570, the bias remains bullish
• A break below 4,400 would activate a correction toward 4,200–4,100
Technical Indicators
• RSI: 47% → recovering from oversold territory
• MACD: Negative and crossed downward since June, confirming a favorable correction
• Volume: Slight increase supporting the bullish trend
• POC (Point of Control): Located near the upper zone at 5,408, indicating a recovery direction
Technical Analysis – DAX 40
Current price (August 7, 2025): 24,098 points
YTD Change: +26%
Trend
• The DAX 40 also maintains a clear uptrend, with a structure of higher lows since the start of the year
• It is currently in a sideways-upward consolidation phase between 23,137 and the highs at 24,747
Key Levels
• Main Resistance: At highs → key level that has capped gains since the end of Q2
• Immediate Support: 23,359 → congestion area supporting the current rally
• Major Support: 23,137 → base of the congestion area
Likely Scenario
• The current consolidation suggests a healthy pause before a breakout, provided the 17,950 support holds
• A daily close below 23,000 would trigger a technical correction toward yearly lows
Technical Indicators
• RSI: 50 → in positive neutral territory
• MACD: Slightly flat entering positive territory; may signal renewed momentum
• Volume: MACD trend is bearish, approaching neutrality—typical of a congestion zone
• POC: Slightly below current highs, suggesting potential continuation of the uptrend
Technical Conclusion
Both the EuroStoxx 50 and DAX 40 maintain a clearly bullish bias, supported by the strength of cyclical sectors. However, they are near key resistance levels, so a technical pullback cannot be ruled out if global markets enter a profit-taking phase.
• Short-term traders should remain cautious unless breakouts are confirmed with volume
• Medium-term investors may view any pullbacks as buying opportunities, as long as key support levels hold
Is a Cycle Shift Coming?
Despite the strong performance of cyclicals so far this year, some analysts—including Morgan Stanley, Deutsche Bank, and Evercore—anticipate a 10% to 15% correction in the S&P 500 in the short term. Such a scenario could favor a return to defensive stocks, especially if volatility spikes or central banks adopt a more dovish tone.
Conclusion
2025 is undoubtedly the year of cyclical stocks. The recovery after the tariff shock has been swift, and sectors like banking, technology, and industry have taken the reins of growth. However, in rotating markets, trends can reverse as quickly as they emerge. The key will be anticipating the next turn.
*******************************************************************************************
The information provided does not constitute investment research. The material has not been prepared in accordance with the legal requirements designed to promote the independence of investment research and such should be considered a marketing communication.
All information has been prepared by ActivTrades ("AT"). The information does not contain a record of AT's prices, or an offer of or solicitation for a transaction in any financial instrument. No representation or warranty is given as to the accuracy or completeness of this information.
Any material provided does not have regard to the specific investment objective and financial situation of any person who may receive it. Past performance and forecasting are not a synonym of a reliable indicator of future performance. AT provides an execution-only service. Consequently, any person acting on the information provided does so at their own risk. Political risk is unpredictable. Central bank actions can vary. Platform tools do not guarantee success.
DAX Resilience To Shine ThroughThe DAX Index continues to hold strength just beneath all-time highs, popping higher above 24,000 after three consecutive sessions of gains.
Bulls are keeping control through strong earnings in tech and auto sectors, combined with supportive macro tailwinds. However, the major resistance and previous ATH remain to be tested.
U.S. Interest Rate Path in Focus
The Federal Reserve held rates steady at its July meeting but left the door open for a possible cut in September, should inflation and labor market data soften.
Markets are pricing in an increasing probability of a cut, which is fueling optimism across global equities.
A dovish Fed supports global risk sentiment and weakens the USD, indirectly benefiting European exporters.
ECB Holds, But Dovish Undertone Grows
The European Central Bank left rates unchanged in its latest decision, but ECB President Christine Lagarde acknowledged that “disinflation is progressing” and that further tightening is unlikely.
Forward guidance was interpreted as dovish, with the market now expecting a cut by December, possibly sooner if economic activity remains sluggish.
A dovish ECB lowers borrowing costs and improves equity risk premiums, especially for cyclical-heavy indices like the DAX.
EU–U.S. Trade Tensions
Recent rhetoric from U.S. officials, including renewed tariff threats on European pharmaceutical and automotive exports, has reignited trade tensions.
The EU has signaled its willingness to respond proportionally, but negotiations are ongoing.
While no measures have been enacted yet, uncertainty over trade policy is capping some upside momentum in European equities.
German automakers and industrial exporters are vulnerable to tariffs. Continued trade uncertainty may limit gains unless diplomacy resolves key friction points.
The DAX remains resilient, buoyed by improving fundamentals, strong earnings, and global rate expectations.
The index is coiled just under a key psychological resistance at 24,000, with bulls eyeing a breakout toward the all-time high near 24,639.
Momentum remains favorable, but traders should watch macro headlines and volume closely around resistance zones.


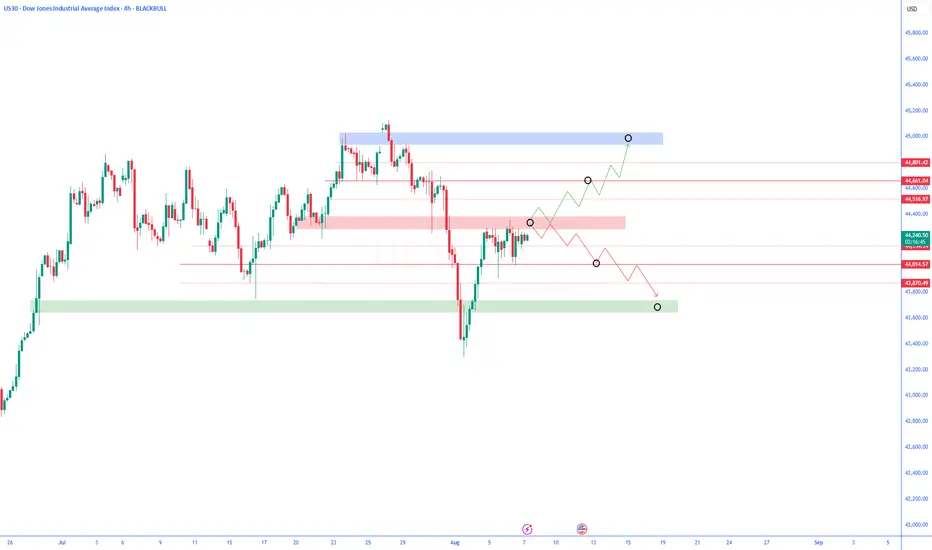
US 500 road mapus 500 could be ready for a major c leg down. looking for a significant entry signal down

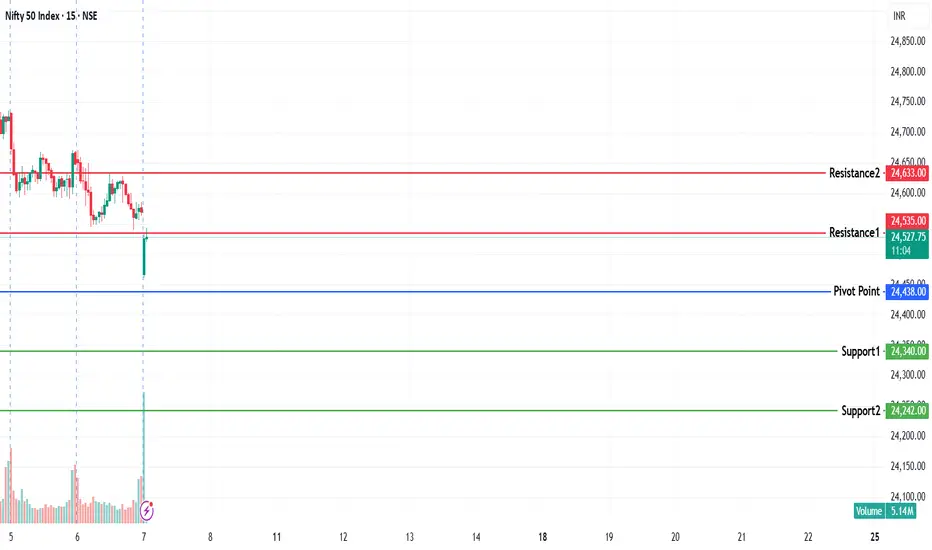
NIFTY KEY LEVELS FOR 07.08.2025NIFTY KEY LEVELS FOR 07.08.2025
If the candle stays above the pivot point, it is considered a bullish bias; if it remains below, it indicates a bearish bias. Price may reverse near Resistance 1 or Support 1. If it moves further, the next potential reversal zone is near Resistance 2 or Support 2. If these levels are also broken, we can expect the trend.
If the range(R2-S2) is narrow, the market may become volatile or trend strongly. If the range is wide, the market is more likely to remain sideways
📢 Disclaimer
I am not a SEBI-registered financial adviser.
The information, views, and ideas shared here are purely for educational and informational purposes only. They are not intended as investment advice or a recommendation to buy, sell, or hold any financial instruments.
Please consult with your SEBI-registered financial advisor before making any trading or investment decisions.
Trading and investing in the stock market involves risk, and you should do your own research and analysis. You are solely responsible for any decisions made based on this research.
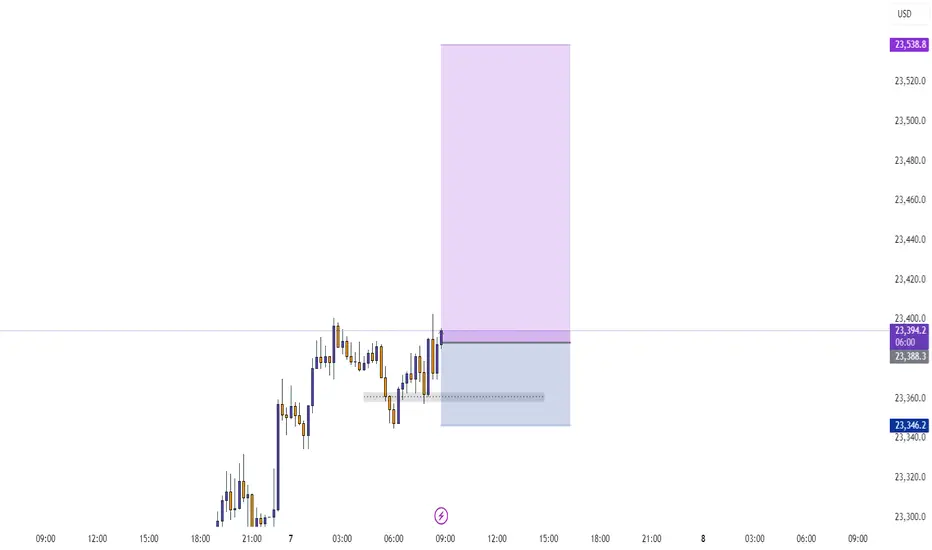
BUY USTEC 7.8.2025Confluence order: BUY at M15
Type of order: Limit order
Reason:
- The current top is not touching anything, expected to rise to the sub-key of H1~M15 above.
- M15~FIBO 0,5-0,618 (same position)
Note:
- Management of money carefully at the last bottom (23,,367)
Set up entry:
- Entry buy at 23,339
- SL at 23,317
- TP1: 23,367 (~1R)
- TP2: 23,403 (~3R)
- TP3: 23,459 (~5R)
Trading Method: Price action (No indicator, only trend and candles)

Aug7th #NIFTY50 View NSE:NIFTY As updated in the previous video #NIFTY50 seems to be correcting the April 4th cycle. And as per the latest update the correction seems to be in the form of ABC, and should typically find support at 38.2-----50% level for one more push higher correcting the fall or to a new high.

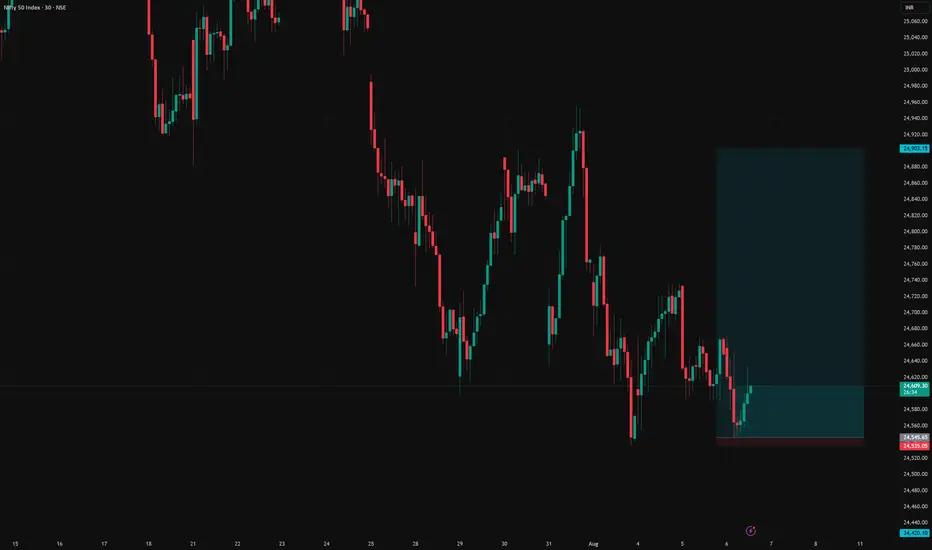
NIFTY spot long setupNifty spot long setup
Entry - 24546
Stop loss - 24535
Target - 24903
Risk Reward - 1:33
NIFTY WAVE COUNTLast wave in Nifty 50 is on. We are right now in corrective phase. Fourth wave corrections are going on in the fifth primary wave, wait for the corrections to get over. Happy Trading.

$nifty50ok so alts all in position and waiting for dominace to nuke some mroe till then lets see whats up with our Nifty
rsi looks to be bottoming just a little volume and we reclaim above line and rsi curls up
little bit more for up up and away may or may not sweet the 200

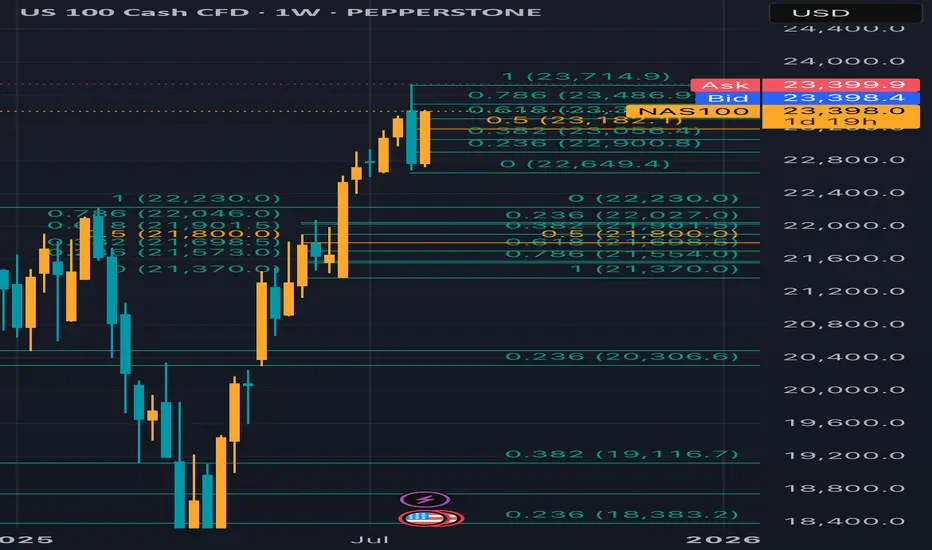
Aug 6th corrective phase, bullish trade setup The Nasdaq 100 is a tech-heavy index, highly sensitive to macroeconomic factors like interest rates, tech earnings, and market sentiment. On August 6, 2025, the market is likely influenced by:
• Monetary Policy: Recent Federal Reserve actions (rate cuts or pauses) could drive bullish momentum, as lower rates favor growth stocks in the Nasdaq.
• Economic Data: Employment, CPI, or tech sector earnings reports could impact volatility.
• Technical Levels: Fibonacci retracements, support/resistance, and trendlines are critical for intraday trading.
I entered Nasdaq above the 0.382 level (23,056.4), First target 23400 was reach at approximately 7pm PST the next targets are the 1.0 (23,700)
*this is not financial advice entertain at your own risk 📊📈
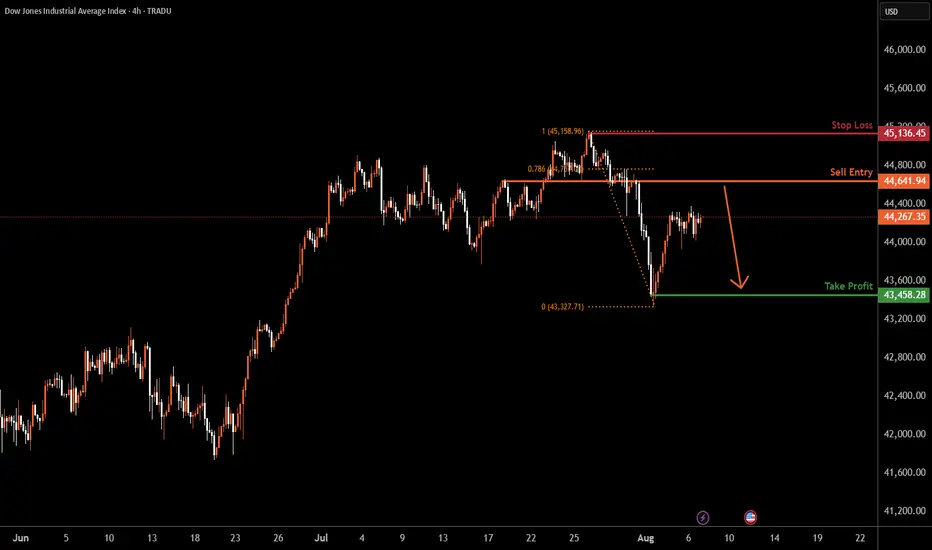
US30 H4 | Bearish reversalDow Jones (US30) is rising towards the sell entry which is an overlap resistance and could reverse to the downside.
Sell entry is at 44,641.94, which is an overlap resistance that is slightly below the 78.6% Fibonacci retracement.
Stop loss is at 45,136.45, which is a swing high resistance.
Take profit is at 43,458.28, which has been identified as a swing low support.
High Risk Investment Warning
Trading Forex/CFDs on margin carries a high level of risk and may not be suitable for all investors. Leverage can work against you.
Stratos Markets Limited (tradu.com ):
CFDs are complex instruments and come with a high risk of losing money rapidly due to leverage. 65% of retail investor accounts lose money when trading CFDs with this provider. You should consider whether you understand how CFDs work and whether you can afford to take the high risk of losing your money.
Stratos Europe Ltd (tradu.com ):
CFDs are complex instruments and come with a high risk of losing money rapidly due to leverage. 66% of retail investor accounts lose money when trading CFDs with this provider. You should consider whether you understand how CFDs work and whether you can afford to take the high risk of losing your money.
Stratos Global LLC (tradu.com ):
Losses can exceed deposits.
Please be advised that the information presented on TradingView is provided to Tradu (‘Company’, ‘we’) by a third-party provider (‘TFA Global Pte Ltd’). Please be reminded that you are solely responsible for the trading decisions on your account. There is a very high degree of risk involved in trading. Any information and/or content is intended entirely for research, educational and informational purposes only and does not constitute investment or consultation advice or investment strategy. The information is not tailored to the investment needs of any specific person and therefore does not involve a consideration of any of the investment objectives, financial situation or needs of any viewer that may receive it. Kindly also note that past performance is not a reliable indicator of future results. Actual results may differ materially from those anticipated in forward-looking or past performance statements. We assume no liability as to the accuracy or completeness of any of the information and/or content provided herein and the Company cannot be held responsible for any omission, mistake nor for any loss or damage including without limitation to any loss of profit which may arise from reliance on any information supplied by TFA Global Pte Ltd.
The speaker(s) is neither an employee, agent nor representative of Tradu and is therefore acting independently. The opinions given are their own, constitute general market commentary, and do not constitute the opinion or advice of Tradu or any form of personal or investment advice. Tradu neither endorses nor guarantees offerings of third-party speakers, nor is Tradu responsible for the content, veracity or opinions of third-party speakers, presenters or participants.