Tencent invests €1.2 billion in Ubisoft spin-offsChinese giant Tencent(HKG:0700) (Ticker AT: TMC.US) has gone further in its expansion in the digital gaming industry by extending its interest in the Ubisoft (EPA:UBI)(Ticker AT:UBI.FR) Spin-Off with a whopping €1.2 billion, in a company currently valued at €4 billion. With this deal, Tencent acquires a 25% stake, while Ubisoft retains control, trying to sustain its position in a particularly difficult year.
The French developer is still in free fall: its shares have lost 33% in the last 12 months , revenues are down by more than a third, and its market capitalization barely reaches €1.7 billion. Not even the expected launch of a new Assassin's Creed has managed to reverse the situation, due to its conflicting use of characters of different races in a historical context that has nothing to do has generated image problems for being considered by the gamer public as excessively unattached to the historical reality of that time.
This financial crisis is compounded by reputational problems. Ubisoft is still embroiled in a legal scandal related to allegations of harassment at the top of its board of directors, which has scared off private investors. In this context, Tencent's capital injection comes as a strategic lifeline, strengthening its position in the sector while taking advantage of the weakness of one of the most iconic European companies in international gaming.
The move reaffirms Tencent's appetite for the video game industry, where it already has stakes in Riot Games, Epic Games and Activision Blizzard , consolidating its dominance in an increasingly competitive market.
On the technical side:
As we commented, the firm has not lost the downtrend of the last 12 months, realizing a loss of 33%, reducing its market capitalization to €1.7 billion. Currently, the stock is trading in a range between €10.480 and €10.610 per share, showing a clear downward trend, which for the moment even Tencent has not been able to undo. On Friday, Ubisoft experienced a price rally, closing the day with a red candle with a very long wick, indicating profit-taking after the rally. It is worth noting the volume of 3.93 million for that session, an exceptional figure considering that during the quarter, trading volume has barely exceeded 1 million in most sessions.
What is worth noting is that the 100-day average has fallen above the 50-day average and the 200-day average is still touching the candle we have indicated, so it is very likely that this trend is reversing. Since the second week of February, the share price has been recovering around 12.4 euros per share. The current price has started the session with a green candle, so we could see a new attempt to extend this downward correction around 12.19 euros per share. If we look at the 4-hour chart, the bullish volume came after the Tencent news, and subsequently the price did not hold and many traders liquidated positions. We will have to see if the news is accompanied with further economic results from the firm to lift the price above the downtrend channel. The RSI indicates 42.36% with a slight oversold level. After correcting in the previous session. We will have to see the evolution in the coming sessions to see if it advances in positive. A current situation in which it seems that the company seems to have touched a price floor and could be a time to enter longs with the new momentum of strong investors leading the Board of Directors of the firm.
The move reaffirms Tencent's appetite for the video game industry, where it already has stakes in Riot Games, Epic Games and Activision Blizzard, consolidating its dominance in an increasingly competitive market.
*******************************************************************************************
The information provided does not constitute investment research. The material has not been prepared in accordance with the legal requirements designed to promote the independence of investment research and such should be considered a marketing communication.
All information has been prepared by ActivTrades ("AT"). The information does not contain a record of AT's prices, or an offer of or solicitation for a transaction in any financial instrument. No representation or warranty is given as to the accuracy or completeness of this information.
Any material provided does not have regard to the specific investment objective and financial situation of any person who may receive it. Past performance is not reliable indicator of future performance. AT provides an execution-only service. Consequently, any person acing on the information provided does so at their own risk.

STMPA - RSI Bullish DivergenceIn daily and weekly charts we can observe this classic RSI bullish divergence pattern.
TA tells us this could be a good oppportunity for a long position, but geopolitical context and automotive industry being currently has some tight implications on this ticker.

RDSA Shell Koninklijke Olie kan naar 7,5 terugvallen; Shell to 7De vraag naar olie droogt op zoals de vraag naar Haver terug liep toen paarden vervangen werden met brandstof autos. We vervangen nu de olie met electriciteit en dan is Koninklijke Olie klaar.
The demand for oil dries up like the demand for Horsefood fell back when horses were being replaced with fuel cars. Now we replace fuel with electricity and then RDSA Shell is finished

EL: Over Priced Stock, Stuck GrowthEssilor growth has been stuck for the past 10 years. However the stock continue to grow up at unreasonable level. Although the company focus on innovation of smart glasses with Meta, doesn't seems to produce real income growth in the next 5 years. Trade wars and tariffs can significantly impact a company's stock, including Essilor Luxottica. For instance, tariffs on goods imported from China and Mexico could increase production costs, leading to lower profit margin. Additionally, trade-related uncertainty can lead to reduced capital expenditures and slower growth in key markets.
The company valuation should be priced around 100 which means 60% possible downfall. Facing stiff competition with China cheap eyewear products that are priced at 1/10th, which are available online at Temu/AliExpress/Alibaba, etc, it would be very difficult for the company to make profit. Especially, in the event of recession and great depression. People do need cheap eyewear product, and China eyewear product fits the bill of majority peoples. Unless the company willing to do massive overhaul and cut the cost drastically. I don't think it can grow up continually. Expect the stock price continue to drop on the long term. It is currently at high dangerous level, it could drop at any time if some bad economic news came out.

Ion Beam Applications S.A. (IBAB) 1WTechnical Analysis
The chart shows a breakout of the weekly ascending trendline and the formation of a "rising wedge", indicating a potential decline.
Key Levels:
- Support: 11.46 EUR, 9.00 EUR
- Resistance: 13.06 EUR, 14.01 EUR
Fundamental Analysis
Ion Beam Applications is a leader in radiation therapy and medical accelerators.
Factors influencing the stock:
- Financials: Revenue growth but high volatility.
- Macroeconomics: Interest rate impact on the tech sector.
- Competition: Rivalry with Varian and Elekta.
A breakdown below 11.46 EUR could open the way to 9.00 EUR. To regain an uptrend, the stock needs to reclaim 13.06 EUR.

Adyen (ADYEN) – Technical Analysis and 1W OutlookTechnical Analysis
Adyen's stock is forming a symmetrical triangle, indicating a potential breakout. The recent price surge confirmed the pattern's breakout, but a correction toward the 0.618 Fibonacci level (1457.2 EUR) is possible, acting as a key buying zone.
Key Levels:
Resistance: 1720.8 EUR (0.5 Fibonacci), 2311 EUR (0.236 Fibonacci)
Support: 1457.2 EUR (0.618 Fibonacci), 1081.8 EUR (0.786 Fibonacci)
Target: 2838 EUR
Indicators suggest a potential continuation of the uptrend:
MACD is signaling bullish momentum
Stochastic indicates a possible correction before further upside
Fundamental Analysis
Adyen is a leading player in the payment technology sector, serving major companies like Uber, Spotify, and Microsoft.
Key Factors Impacting the Stock:
Financial Performance: Recent earnings reports showed revenue growth driven by increased payment volumes.
Macroeconomics: Lower inflation and potential interest rate cuts could benefit the tech sector.
Competition: Pressure from PayPal and Stripe remains a key risk.
Adyen maintains bullish potential following the triangle breakout. The 1457-1500 EUR zone is crucial for trend confirmation, with a possible long-term target at 2838 EUR. However, a short-term correction remains possible.

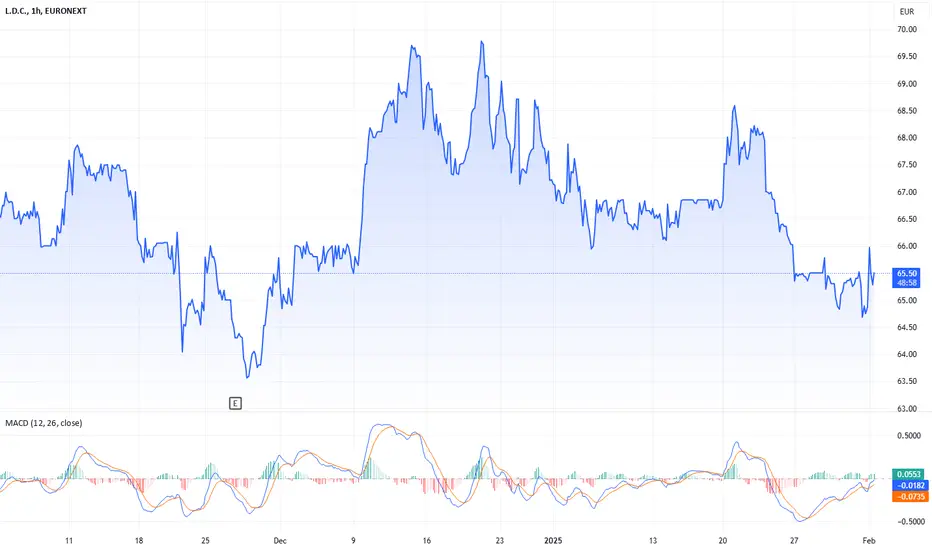
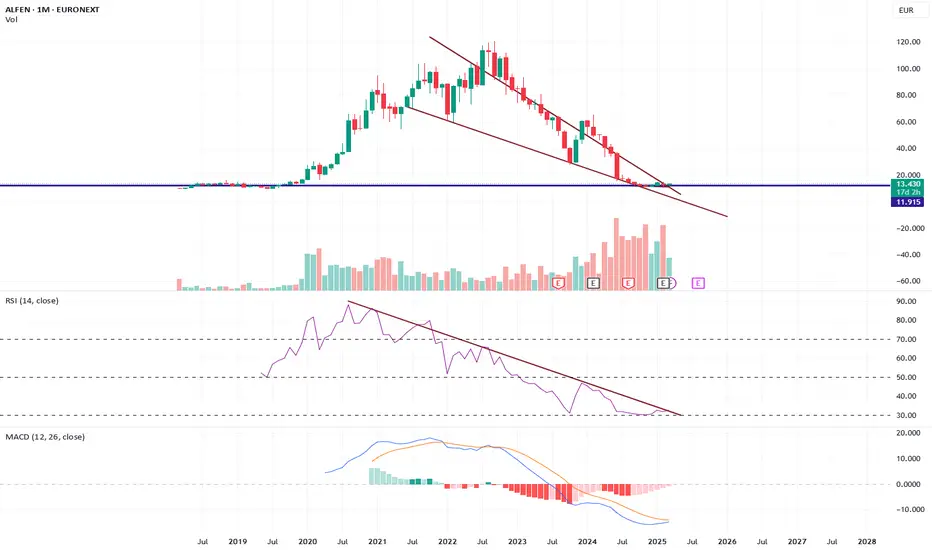
Alfen ready to go up again?MacD and RSI are in a very good position, i also think that we have hit a bottom support.
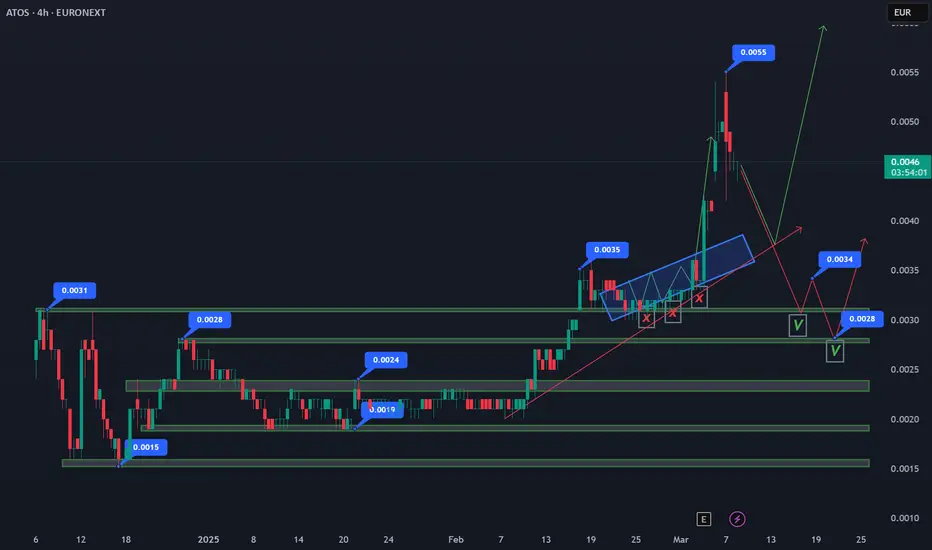
Atos Reverse Stock Split – Another Round of Price Manipulation?Atos Confirms Bullish Continuation, Invalidating Consolidation and Bearish Retest
Atos has officially invalidated neutral consolidation and a bearish retest, choosing a bullish continuation as it currently trades at $0.0046.
Atos Needs a Pullback to $0.0028–$0.0034 After 84% Surge
Following a massive 84% rally from $0.0030 to $0.0055, Atos now requires a technical pullback to retest and confirm support.
Target Pullback Zone: $0.0028–$0.0034
A retracement into this range would provide a healthy consolidation, allowing bulls to regroup before another breakout.
Holding this zone would strengthen the bullish structure, preventing excessive volatility and reinforcing confidence in further upside.
If $0.0028 holds, the next bullish wave could see Atos push beyond $0.0055 and target new highs.
This pullback phase is crucial for maintaining trend stability and ensuring Atos builds a strong foundation for the next bullish leg. If buyers defend $0.0028–$0.0034, the stock could be positioned for another sharp upward move.
Atos SE Reverse Stock Split Analysis – March 2025
Atos SE has announced a reverse stock split at a 10,000-to-1 ratio, aiming to reduce the number of outstanding shares and stabilize stock price volatility. This move follows prior capital increases and a drastic decline in share value.
Key Impacts of the Reverse Split:
Structural Change, Not Value Addition:
The total market capitalization and shareholders' equity remain unchanged.
For example, a holder of 30,000 shares at €0.0049 each will receive 3 shares at €49 each, maintaining a €147 portfolio value.
Market Sentiment & Perception:
Large-scale reverse splits are often perceived negatively, as they may signal distress.
Atos must demonstrate financial stability and growth potential to prevent further investor sell-offs.
Liquidity & Trading Adjustments:
Shareholders with fractional holdings (<10,000 shares) will need to adjust positions before April 23, 2025, or risk forced liquidation.
The new shares will start trading under a new ISIN code (FR001400X2S4) from April 24, 2025.
Potential Post-Split Volatility:
If investor confidence remains weak, the stock could face renewed selling pressure despite the higher nominal share price.
However, if Atos improves its fundamentals and strategic outlook, the split could help attract institutional investors who prefer stocks with higher unit prices.
Final Take:
While the reverse split does not inherently add value, it aims to enhance trading conditions and market perception. The real impact depends on Atos' ability to execute a successful turnaround strategy beyond the technical stock adjustment.
Atos Reverse Stock Split – Another Round of Price Manipulation?
Atos SE has once again announced a massive reverse stock split (10,000-to-1), following a sharp decline in share value. While this move is framed as an effort to reduce volatility and stabilize trading conditions, history suggests a pattern of price manipulation that leaves retail investors at a loss.
A Look Back – The 2024 Split Manipulation
The last time Atos conducted a share split (13,497 new shares for every 24 old shares), the price artificially pumped from €0.15 to €1.70 right before the official announcement. This created a false sense of demand, trapping investors at high prices, only for the stock to collapse afterward. Many retail traders ended up buying high and losing money.
Current Manipulation – Selling Off Before the Split
Now, we see a similar pattern playing out again—Atos is trading at record-low levels below €0.0030 ahead of the reverse split. This suggests that once the new shares start trading at a higher nominal price, investors may again face forced sell-offs and further declines, leading to more financial losses for shareholders.
Key Takeaways:
The reverse split does not add value—it only reduces the number of shares outstanding, while total market capitalization remains unchanged.
Shareholders with less than 10,000 shares must adjust their positions before April 23, 2025, or risk forced liquidation.
Without strong fundamentals, the post-split price may drop again, just like last time.
Investors should remain cautious and consider the risks before making any decisions. Atos must prove its financial stability rather than relying on stock restructuring to create the illusion of recovery.
Long on MICHELIN (EURONEXT)EURONEXT:ML will close two of it's factories in France, which means less expenses and more profits.
The stock is oversold on RSI, broke mulitple support levels and has now stopped on a major support level. Bearish the next few days/weeks as many "low profile" investors will sell their shares, the oversold state and the major support level should give the right signals for high level investors to go bullish.

A Buy Position on a Trend Line Breakup Case.As week and month progresses, I'll monitor the 60 price level and how down Trend Tine is consistently break up. I'll consider a Buy with SL=44.95, TP1=113, TP2=165, for a RR=3 and above. Just price action and volume considerations here.


ASML on its way to 400The semiconductor sector is at it peak.
Minging cryptos will shift to quantum machines over time.

NN GROUP ($NN) Q4—INSURANCE CASH SHINES IN EUROPENN GROUP ( EURONEXT:NN ) Q4—INSURANCE CASH SHINES IN EUROPE
(1/9)
Good evening, TradingView! NN Group ( EURONEXT:NN ) is humming—H2 revenue hit $ 7.94B, topping estimates 📈🔥. Q4 earnings and a cash boost spark buzz—let’s unpack this Dutch dynamo! 🚀
(2/9) – REVENUE RUSH
• H2 Haul: $ 7.94B—beats $ 7.41B est. 💥
• Full ‘24: $ 12.36B—up 12% from $ 11.03B 📊
• OCG: $ 1.9B—hits ‘25 goal early
EURONEXT:NN ’s cash flow’s sizzling—steady wins!
(3/9) – BIG MOVES
• Buyback: $ 300M—shares get a lift 🌍
• Dividend: $ 3.44—up 8%, juicy payout 🚗
• Deals: $ 360M settled—risks trimmed 🌟
EURONEXT:NN ’s flexing—insurance muscle shines!
(4/9) – SECTOR SNAP
• P/E: ~10—below 11.9x avg 📈
• P/B: 0.57—vs. sector’s 1.04—cheap?
• Edge: 12% growth tops peers 🌍
EURONEXT:NN ’s a bargain—or just quiet strength?
(5/9) – RISKS ON DECK
• EPS Miss: $ 2.21 vs. $ 3.60—hiccup ⚠️
• Rates: Volatility stings returns 🏛️
• Climate: Claims could climb—yikes 📉
Solid run—can it dodge the bumps?
(6/9) – SWOT: STRENGTHS
• Cash: $ 1.9B OCG—rock solid 🌟
• Payouts: 8% divvy, $ 300M buyback 🔍
• Europe: 20% new biz—growth zip 🚦
EURONEXT:NN ’s a steady beast—built tough!
(7/9) – SWOT: WEAKNESSES & OPPORTUNITIES
• Weaknesses: EPS slip, Dutch lean 💸
• Opportunities: Eastern Europe perks 🌍
Can EURONEXT:NN zap past the risks?
(8/9) – EURONEXT:NN ’s Q4 cash surge—what’s your vibe?
1️⃣ Bullish—Value shines bright.
2️⃣ Neutral—Solid, risks hover.
3️⃣ Bearish—Misses stall it out.
Vote below! 🗳️👇
(9/9) – FINAL TAKEAWAY
EURONEXT:NN ’s $ 7.94B H2 and $ 1.9B OCG spark zing—insurance hums 🌍. Low P/E, but EPS wobbles—gem or pause?

HAL NV: Unlocking Hidden Value in a Discounted InvestmentCurrent Price: Approximately €117.40 per share
Target Price: €150 per share
HAL NV (traded via HAL Trust) has long been recognized as a unique investment vehicle, thanks to its diversified portfolio of high-quality assets. Despite a current trading level around €117.40, a closer look at the underlying holdings and operational performance reveals a significant value gap—one that suggests the stock should be priced nearer to €150.
Key Holdings and Their Strengths
Boskalis – A Fully Owned Flagship
• 100% Ownership: HAL NV owns Boskalis outright, giving it full exposure to the maritime and offshore construction market.
• Robust Order Books: Boskalis benefits from a full order book, which not only secures future revenues but also demonstrates strong market positioning.
• Operational Efficiency: With steady execution in its core business, Boskalis adds both resilience and growth potential to HAL’s overall portfolio.
SBM Offshore – Secure Order Pipeline
• Substantial Stake (22.9%): While not fully owned, SBM Offshore represents a key component in HAL’s strategy.
• Solid Order Books: Like Boskalis, SBM Offshore’s strong order backlog underscores its ability to generate future cash flow.
• Strategic Exposure: The offshore energy market, driven by both traditional and renewable energy projects, positions SBM Offshore for long-term growth.
Vopak – Consistent Performer with Upward Trends
• Major Stake (51.4%): HAL’s significant interest in Vopak captures exposure to the global tank storage and logistics sector.
• Earnings Fluctuation, But Upward Trend: Although Vopak’s earnings can fluctuate year over year, the overall trend has been strongly positive, reinforcing its role as a reliable income generator.
Additional Growth Catalysts
• Coolblue (56.4%) & TKH Group (5.2%): These holdings further diversify HAL’s portfolio, offering exposure to high-growth sectors such as retail technology and industrial services.
The Valuation Gap: NAV vs. Market Price
One of the most compelling aspects of HAL NV is the notable discrepancy between its Net Asset Value (NAV) and its market capitalization:
NAV Insight: Recent reports and annual filings suggest that the NAV per share of HAL’s underlying assets is approximately €165.95.
Market Discount: Trading at around €117.40, HAL NV is effectively offered at a significant discount. This “hidden value” implies that the market has yet to fully recognize the aggregate worth of its high-quality investments.
Equity vs. Market Cap: With the equity value of its portfolio (including fully consolidated companies like Boskalis and the robust valuations from quoted holdings such as Vopak and SBM Offshore) substantially higher than the current market cap, the potential for upward re-rating is evident.
Hal NV is poised for robust long‐term growth, with annual rates expected to reach around 15%. This optimism is driven by strong demand for the services of Boskalis and SBM Offshore, both of which continue to benefit from substantial order books. Additionally, the accelerated growth of Coolblue and the steady, consistent performance of Vopak—bolstered by emerging opportunities in India—further enhance the outlook. Coupled with a conservative balance sheet that ensures a low cost of capital, these factors collectively support the company’s promising growth trajectory.
Catalysts for Price Convergence
Several factors support the rationale for a price target of €150:
Strong Order Books: Both Boskalis and SBM Offshore are backed by extensive order books, which not only secure future revenue streams but also reduce operational risks.
Consistent Growth Trends: Vopak, despite some earnings volatility, has demonstrated a significant long-term upward trend in earnings—enhancing the overall stability of HAL’s portfolio.
Undervalued Underlying Assets: The current market price does not fully reflect the NAV derived from HAL’s diverse investments. As market sentiment improves and the intrinsic value becomes more widely recognized, a re-rating toward the NAV is likely.
Favorable Valuation Metrics: HAL NV’s relatively low Price/Earnings ratio compared to its growth prospects and asset quality makes it an attractive buy for value-oriented investors.
Conclusion
HAL NV represents an intriguing investment opportunity—a trust whose market price currently undervalues a robust portfolio of operationally strong and strategically significant companies. With full control over Boskalis and solid stakes in SBM Offshore and Vopak, combined with additional growth prospects from Coolblue and TKH Group, the underlying equity far exceeds the current market valuation. In essence, if the market were to recognize the full value of these assets, a price target of €150 per share appears not only justified but highly attainable.
Investors looking for a value play in the industrial and investment holding space should keep a close eye on HAL NV, as the convergence of market price to NAV could deliver significant upside potential.
Note: The analysis above is based on current market data (price ≈ €117.40) and recent annual reports, and reflects the author’s view on the intrinsic value of HAL NV. Investors should perform their own due diligence before making any investment decisions.

Atos : Post-Split Recovery and Key Market ScenariosFollowing the massive share split (13,497 new shares for every 24 old shares), Atos experienced a significant price drop from $1 to $0.0024. The stock reached its lowest point at $0.0015 on December 17, marking a critical bottom.
From January 9 to February 11, Atos entered a consolidation phase, ranging between $0.0024 and $0.0019, indicating a period of accumulation. However, on February 18, the price broke above its post-split all-time high, reaching $0.0035, with an intraday high of $0.0039.
Now, after this sharp extension from $0.0020 to $0.0039, a pullback is necessary to stabilize price action and determine the next trend.
Potential Scenarios for Atos Price Action
1. Bullish Continuation: Uptrend Formation
If Atos holds above $0.0028, we could see a bullish channel forming, with price moving between $0.0028 and $0.0035.
This scenario would set up a gradual uptrend, signaling continued accumulation and confidence in further recovery.
Key Level to Watch: $0.0028 must hold as support to confirm the bullish momentum.
2. Neutral Consolidation: Sideways Trading Range
If the price drops below $0.0028, Atos could enter another consolidation phase, ranging between $0.0023 and $0.0029.
This would indicate that the market is still undecided, with neither bulls nor bears taking full control.
Key Level to Watch: $0.0023 should act as strong support, preventing further downside.
3. Bearish Retest: Hunting for Liquidity at $0.0018–$0.0019
In a bearish scenario, Atos could break below $0.0023 and head toward $0.0018–$0.0019.
If this zone holds, it could trigger a new buying wave, stopping the bearish momentum and potentially creating a new hype cycle.
Key Level to Watch: Price must refuse to go under $0.0018 for buyers to regain control.
Conclusion: Crucial Levels to Watch for Atos' Next Move
Bullish scenario: Hold above $0.0028, creating an uptrend between $0.0028 and $0.0035.
Neutral scenario: Drop below $0.0028, consolidating in a range between $0.0023 and $0.0029.
Bearish scenario: Test $0.0018–$0.0019, with a potential rebound if this zone holds strong.
With the recent price breakout, Atos is now at a critical turning point, where the next few trading sessions will determine whether bullish momentum continues or if the stock will enter another consolidation or correction phase.

Why Hermès’ margins shame the competitionThis analysis is provided by Eden Bradfeld at BlackBull Research—sign up for their Substack to receive the latest market insights straight to your inbox.
You know my favourite stocks are luxury stocks, and they’ve had a hard last year. Richemont and Moncler were the clear standouts from the most recent season (both grew sales), while Brunello did well too. Obviously, Kering did not do well. Here’s Hermes, which pretty much smashed everyone out of the park:
Revenue amounted to €15.2 billion
(+15% at constant exchange rates and +13% at current exchange rates)
Recurring operating income reached €6.2 billion, representing 40.5% of sales
Adjusted free cash flow amounted to €3.8 billion, up by 18%
Can we take a step back and please admire what smashing results those are — that’s a luxury business which does not cut corners operating on a 40.5% margin, with a free cash flow stream that is unheard of for the luxury industry. Let’s also consider that this is during what is nominally a recession.
Worth thinking about what makes Hermes special:
A hatred of meetings, corporate hogwash, and the associated.
They compete only with themselves — not others .
Human values. Hermes objects are made by people and bought by people . Corporate hogwash tends to see people as numbers, and then corporate hogwash forgets about the importance of psychology.
A fanatical obsession with product — product is the message.
No marketing team.
If your product is good enough, and the story you communicate is good enough, the people will come. The same can be said of Brunello, which I have always said is like a “mini-Hermes” — people buy Brunello for quality and the ethos it communicates. Worth re-reading Brunello’s daily routine, which does not look like the nonsense ice bath CEOs who you see on Instagram:

Adyen a thing of beauty Downward channel, inverted head and shoulders, level to level mate. Trades done.

badass divergence OBV price on ASMLcrazy divergence , for the discounted price of ASML, 1000$ is the fair value

Randstad: A Value Caution in a Shifting LandscapeRandstad NV (AEX: RAND) currently trades around €41.55 with a market cap of approximately €7.62 billion. While many investors may be drawn to its strong dividend history and solid reputation in staffing, a closer look at the fundamentals and macroeconomic outlook suggests that the market may be overestimating its near‐term growth prospects.
Declining Profitability
A review of Randstad’s recent financials is cause for caution. The company’s net income has shown a marked deterioration over recent years—from €929 million in 2022 to €624 million in 2023 and further down to €272 million on a nine‑month basis in 2024. This steep decline is partly due to mounting operating costs and weakening revenues. From a Buffett perspective, a business with persistent profitability erosion—even one with a storied track record—may have its intrinsic value overstated relative to its current market price.
Earnings Release Timing: Pre‐Market Clarity
Randstad’s Q4 2024 earnings are scheduled for release on February 12, 2025, at 01:00 AM CET—well before the regular trading hours (pre‑market) on the Amsterdam exchange. This timing can sometimes lead to volatility, as the market digests the numbers before the open. In a scenario where the figures further confirm the declining trends in net income and margins, the pre‑market reaction could set the tone for a downtrend next week.

Macroeconomic Headwinds
Beyond company-specific issues, broader economic signals weigh on Randstad’s prospects. Staffing firms are inherently tied to the health of the labor market. Recent reports indicate that while headline figures such as a 143,000-job gain in January might appear robust, underlying trends—including uncertainty over labor market stability and rising concerns over long‑term employment—suggest caution. An environment of higher unemployment (or the fear thereof) can dampen demand for staffing and recruitment services as companies curtail expansion plans. In other words, if fewer people are employed, fewer job openings and less turnover can translate into lower revenues for Randstad over time.

The Technology Disruption Factor
Adding another layer of risk, the accelerating pace of technological advancement—particularly in artificial intelligence—could further disrupt traditional staffing. As AI and automation drive efficiencies, many roles traditionally filled through temporary or permanent placement may become obsolete. This transformation not only dampens the immediate demand for recruitment services but also challenges long‑term earnings growth forecasts. When future cash flows are discounted in a model, even a modest shock to growth expectations can result in a present value that is lower than the current market price.
Index Inclusion and Credit Concerns
Another point to consider is Randstad’s position as the smallest company in the AEX index. Index inclusion is not merely a matter of prestige; it also affects liquidity and investor perception. Losing its spot in the index would heighten uncertainty and could trigger a reassessment of its creditworthiness. A downgraded credit score would raise borrowing costs—further squeezing margins in an already challenging operating environment.
A Cautionary DCF Under a Short‑Term Shock
A refined look at Randstad’s valuation—one that factors in its debt—offers additional perspective on the risks ahead. In our pessimistic scenario—where net income falls to around €300 million, the perpetual growth rate declines to 2.5%, and the discount rate rises to 7% (reflecting increased credit risk)—the resulting firm value (or enterprise value) comes out to approximately €6.67 billion. However, since this figure represents the value of both debt and equity, we must subtract the net debt to determine the value attributable solely to shareholders. Assuming net debt is roughly €1.38 billion, the estimated equity value would be about €5.29 billion. Dividing that by the 175.14 million shares outstanding gives an estimated share price of around €30. This refined approach, which includes the effect of debt, reinforces the view that a short‑term earnings shock combined with a less favorable long‑term outlook could significantly compress Randstad’s share price.
Conclusion
In the spirit of Warren Buffett’s careful, long‑term analysis, the case for Randstad appears to be one of caution rather than opportunity. Persistent declines in profitability, headwinds from both macroeconomic signals and technological disruption, and risks associated with its index position all point toward a stock that may be overpriced relative to its intrinsic value. With the pre‑market earnings release scheduled for February 12 (01:00 AM CET), investors should be prepared for potential downside pressure in the coming week if the results confirm these concerns.
In summary, while Randstad remains a well‑managed company with a solid track record, its recent decline in profitability, exposure to macroeconomic headwinds, and risks from technological disruption suggest that its current price may be overoptimistic. A simple DCF analysis—even one that factors in debt—underscores this caution: under a short‑term earnings shock scenario, the estimated share price could drop to around €30. For value investors who prize long‑term clarity and rational assessment, these multiple signals warrant a careful reassessment of Randstad’s outlook.

VIE - +16% upside with 1:4 RR
Excellent RR ratio
Good Theme with EU stocks moving well
Utilities
And great pattern formation and basing period.

ASML is at its peak 2025ASML at its peak, machine sales to deminish as Quantum computing is taking over

Livestock and Poultry Sector On February 3, 2025The global livestock and poultry sector is grappling with challenges due to escalating feed costs and supply constraints. Key commodities such as corn ACTIVTRADES:CORNH2025 and soybeans CBOT:ZS1! , which constitute a major portion of animal feed, have seen substantial price increases driven by adverse weather conditions, reduced crop yields, and heightened demand for biofuels. These factors are putting pressure on producers, particularly in the U.S., where red meat and poultry production is expected to decline by 2% in the current year compared to the previous one.
In addition to rising feed costs, outbreaks of diseases like Highly Pathogenic Avian Influenza (HPAI) have further strained production capabilities. The U.S., one of the largest exporters of poultry products, has experienced widespread culling of flocks, leading to a reduction in supply and subsequent price hikes. According to the USDA, wholesale prices for chicken breasts have surged by 15%, while beef prices have increased by 8% year-over-year. This trend is likely to persist as producers continue to face elevated input costs and logistical hurdles. All the data can be found in WASDE report .
Impact on Global Trade Dynamics
The contraction in U.S. meat production is reshaping global trade patterns, creating opportunities for alternative suppliers. Countries like Brazil and Argentina, major players in the global meat market, are capitalizing on the situation by increasing their export volumes to traditional U.S. markets, including Asia and Europe. For instance, Brazilian exports of beef BMFBOVESPA:BEEF3 and poultry BMFBOVESPA:BRFS3 rose by 10% in Q4 2024, underscoring the shifting dynamics in international trade. Meanwhile, China's growing self-sufficiency in pork production following the recovery from African Swine Fever (ASF) has reduced its reliance on imports, impacting global demand for pork.
Investors should also note the potential long-term implications of these shifts. As countries diversify their sourcing strategies, regions with lower production costs and robust infrastructure may gain a competitive edge. This could lead to sustained changes in market share distribution among key players.
Investment Implications
For investors, the current environment presents both risks and opportunities. Companies involved in alternative protein sources, such as plant-based meats and aquaculture, may benefit from increasing consumer interest in cost-effective and sustainable options. Additionally, advancements in feed efficiency technologies and genetic improvements in livestock breeding offer promising avenues for investment. On the other hand, traditional meat producers may struggle unless they can effectively manage rising input costs through vertical integration or operational efficiencies.
From a regional perspective, emerging markets with favorable agricultural conditions and supportive government policies are likely to attract capital. Investors should closely monitor developments in countries like India, Thailand, and Vietnam, where poultry and aquaculture sectors are expanding rapidly.
Inference
The livestock and poultry sector faces challenges stemming from high feed costs and disease outbreaks. While these issues are pressuring global meat supplies and influencing trade flows, they also create opportunities for innovation and diversification. By staying informed about market trends and technological advancements, investors can position themselves to capitalize on the evolving landscape of the global protein industry.