use the ruler volatility of options and target for the year
the chart for TLRY has yearly target of 3.88 and implied volatility of 66% which when measured from the dip to the target provides a reference for that dip that you can buy with greater confidence

volatility tip off for bottom fishingthe target for the year is 3.88 , if you measure the range from the dip to the target you get confirmation of you bottom, you won't be flushed if you use this format in conjunction with the risk reward profile for the yearly view timeframe to get your max shares. You can also increase your risk reward ratio should the price drop by adjusting the risk reward line towards the stop price range such that you go from 1 to 1 risk reward to 4 to1, its a great way to fight back the whiplashing that surely will occur

$AMQ very nice uptrend on the chartStrong uptrend, cashed up from recent financing, good bid support.
CSE:AMQ

Long TD. Resistance retest successful on the dailyLong TD. Resistance retest successful on the daily

Nova Leap Healthcare To the MoonNova Leap Health Corp. is a company specialized in home health care services, operating primarily in the United States and Canada. It's known for its growth through acquisitions, particularly in the fast-growing home health care industry. Nova Leap focuses on delivering care with an individual and family-centered approach, with a special emphasis on dementia care. The company has gained recognition for its rapid expansion and has been ranked highly in Canada's Top Growing Companies.
In recent years, Nova Leap has continued its expansion in the U.S., including strategic acquisitions in the Midwest, particularly in Kentucky and Indiana. This move complements their existing operations in Ohio and is part of their strategy to expand their footprint in the Midwest and Southern regions.
The corporate headquarters of Nova Leap Health Corp. is located in Halifax, Nova Scotia, Canada. The company aims to grow further through a combination of more acquisitions and organic growth, mainly focusing on North American companies.


Argonaut Gold - Double Bottom Pattern I noticed that the stock Argonaut Gold followed double bottom pattern and a change in long term down trend to uptrend . Targets may be a double in longer term. This may be one of the life long opportunity to invest in it. I hope this will help to learn or find a double bottom pattern for the profit making trend analysis. All the best

EGLX likely upside from hereThe stock, which plummeted from its peak during the 2021 stock mania, has been in decline for the last few years. Recently delisted from NASDAQ, this small-cap company stands out from others affected by the mania, as it generates income. I believe the selling pressure has subsided, making it a prime time to consider a speculative investment. If management can effectively manage expenses and employee stock issuance, this company has the potential for substantial growth, especially given the rising popularity of Esports and gaming content.

$CBIT bitcoin miner that is lagging, on watch for breakout $0.145 resistance, lagging all other miners that have moved with bitcoin strength this year.

Pond TechnologiesInteresting chart. Parallel channel, getting some support at these lower levels. Risk to reward looks good.. Notable large wick down which was quickly bought back up indicating some volume and interest in this thing.
Referencing this TSXV chart

DMG BLOCKCHAIN #DMGI to 5X Lovely Cup and Handle has formed
5X sounds alot but it has traded to those heights previously soo, not really.
and can go on to smash $5
It's a nano cap #bitcoin miner
so position accordingly.
Good Luck.

BreakoutThe current price is 0.085$. The price may fill the below gap (at 0.075$). If the chart can break the yellows channel it will have potential to go up to the top line of the channel. In the medium term it will touch 0.250$.

Will Aben wake up from the dead or do we plan its funeral?This is one of the most bearish PM charts you'll see. Within this larger perpetual bear market, we are currently in the midst of the longest down leg ever, and it could very well keep going to $0.
The upside: It's market cap is tiny, which means if it breaks out of the long sloping diagonal channel, it could be a quick rise to 60 cents; maybe even a dollar.
But if "ifs and buts" were "candy and nuts" we'd all have a merry Christmas!

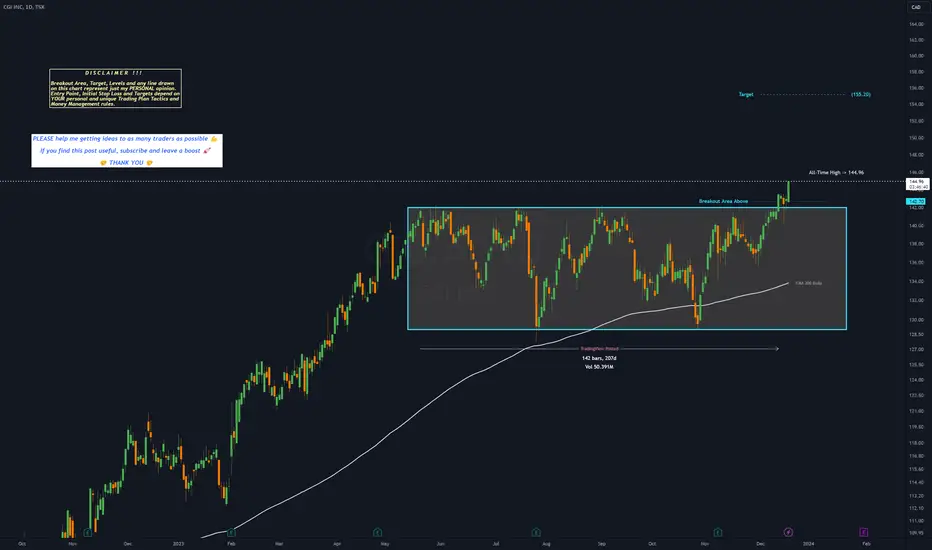
GIB.A - 7 months RECTANGLE══════════════════════════════
Since 2014, my markets approach is to spot
trading opportunities based solely on the
development of
CLASSICAL CHART PATTERNS
🤝Let’s learn and grow together 🤝
══════════════════════════════
Hello Traders ✌
After a careful consideration I came to the conclusion that:
- it is crucial to be quick in alerting you with all the opportunities I spot and often I don't post a good pattern because I don't have the opportunity to write down a proper didactical comment;
- since my parameters to identify a Classical Pattern and its scenario are very well defined, many of my comments were and would be redundant;
- the information that I think is important is very simple and can easily be understood just by looking at charts;
For these reasons and hoping to give you a better help, I decided to write comments only when something very specific or interesting shows up, otherwise all the information is shown on the chart.
Thank you all for your support
🔎🔎🔎 ALWAYS REMEMBER
"A pattern IS NOT a Pattern until the breakout is completed. Before that moment it is just a bunch of colorful candlesticks on a chart of your watchlist"
═════════════════════════════
⚠ DISCLAIMER ⚠
The content is The Art Of Charting's personal opinion and it is posted purely for educational purpose and therefore it must not be taken as a direct or indirect investing recommendations or advices. Any action taken upon these information is at your own risk.
A nice looking base continues for Outcrop!A base has been building for 5-6 years while some diagonal lines are starting to squeeze this base. If we see 50 cents again -- then expect much higher prices shortly thereafter.

FFH is going to bounce like a basketball! H&S pattern too!It appears as though FFH is showing two alternatives, an H&S breaking down, or, sideways trading in a horizontal channel, with a breakout likely happening early 2024.
A horizontal channel is a neutral chart pattern that marks investor indecision. Buyers and sellers fight, and it is only at the exit of the horizontal channel that they agree on a direction; either there are more buyers than sellers or there are more sellers than buyers; hence the strong force of the movement at the horizontal channel’s exit.
This train has left the station.

TargetsWe should wait for a breakout. If it is occurred the price will go up to 0.200$ and if this level is broken the price could touch 0.340$.

Similarities between MJ & Mushroom Markets - There are alot of similarities between mushroom and Mj markets - pop offs and cool downs. currently alot of distractions from this market, but should have big opportunities going from $3.00 to $20 in the next two years

📈 BUY SETUP ON CPCP has created a pattern and has broken out for bullish up side.
Manage your risk and take profits at target levels!

European Energy Metals Corp. trend analysisEuropean Energy Metals Crop. a Lithium and rare earth miner that has a strong trend

Long entry detectedIf price were to drop again around the low 100s again id suggest a long entry to a price target of 135-140. The need for time sensitive premium overnight air cargo services is now.
this company has been recently added to new fund made up by 30 companies from north americas three nations, Canada, United States and Mexico. tied together through the USMCA trade pact and seeking to take advantage of nearshoring.


$43 targetBased on the performance of the last bull market for precious metals, I peg a target at $43. This may be conservative, as the company has less competition that it did in the 2000's.
