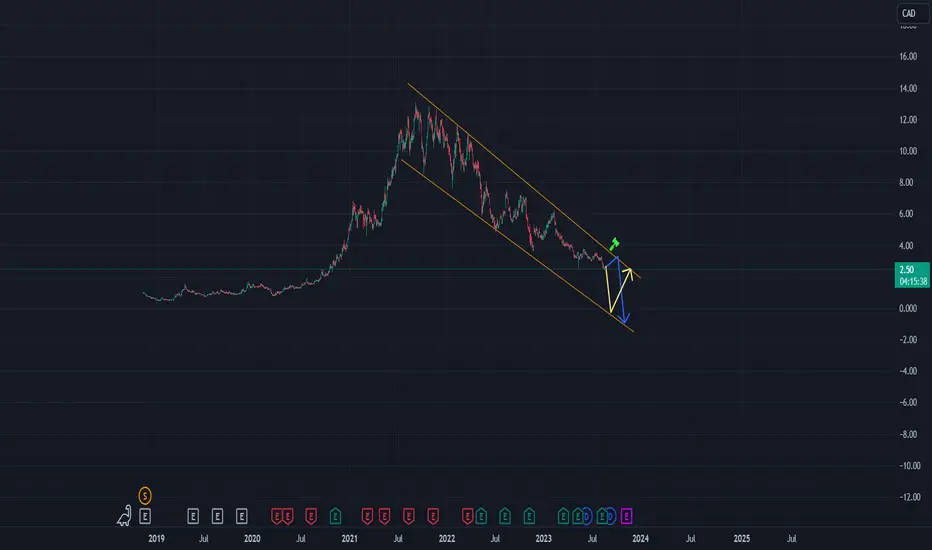
Curaleaf: Rocket launch 🚀Curaleaf's stock price has experienced a rapid increase, surpassing the resistance level at C$5.68. It appears highly likely that the stock is currently within the orange wave iii, which is anticipated to extend beyond C$8. However, this upward movement might not be as meteoric and could follow a more gradual trajectory.

Neo Battery Materials uptrend Neo Battery Materials is on a strong uptrend the blue arrows is giving a buy signal


SOUTHERN ENERGY - Value Investing In Small Cap Co.This is a chart analysis based on history and news. This is a great small cap growth company which has invested in texas area collaboratived with Energy Co. It is supposed to sell through a new built natural gas pipeline and the long high priced oil will bring this company to the first line of earners! Check this out! Do your DD

How do you like them channels?Strong channel from the pandemic lows. Not getting the volume yet, but this may be early. Key is the 55 EMA as it has been strong support along the way. Not oversold daily and running sell divergence monthly. Shorts in this market need to be choosy but this wouldn't be the worst choice.

Telus WEEKLY VOLUME PROFILE Touched! UP WE GO 🚀 Updated I will be buying more shares tomorrow. It will be just rounding it up and then DCA if/when it touches the green lines (POC lines) under the white line ( My average cost)
I expect it to go up from here for a couple of weeks. This may take a year to play out to reach these two red lines. One is a POC line within the golden range using Fibonnaci and second is simply another area I will DCA out if I still have shares left and judge that it can keep going up.
Expected profit from doing this trade after a year from aug 3 is near 25% + dividend of 5-6%. Total expected reward after a year, 30% from current average price.
Max time horizon to reach ATH if green lines are reached: 5 years. But it can happen sooner. This is worth holding onto for that time period. Especially for long term investor who enjoys 5-6% dividends.
Happy trading and investing.

Telus Volume profile tested. Up we go!I suspect we have reached the bottom here. Time to accumulate and hold on. I will decide later on when it's time to sell. But some TP areas can be the 200 MA and DCA out from there in section each time an exit trigger is met. I expect a 30% gain from here on out within a year.

Oversold Bitcoin miners is poised for a breakoutWith Bitcoin reversing from oversold conditions on favourable court ruling for Grayscale ETF, this BTC miner is poised for a big move. It was at .20+ when Bitcoin was at 30K.

Canopy Growth: C'mon, Do Something 👉The price of Canopy Growth is currently relatively flat. However, we believe a significant setback is needed to complete the white wave II in the turquoise target zone between CAD 0.430 and CAD 0.265, as expected. Only then should a significant move higher occur in the form of the turquoise wave 1, which should extend to around CAD 1.20. Alternatively, we see a 47% probability that the price is already in this wave. This scenario would occur if the price breaks the resistance at $0.8000 without reaching our target zone

CNQ - 10 months HEAD & SHOULDERS CONTINUATION══════════════════════════════
Since 2014, my markets approach is to spot
trading opportunities based solely on the
development of
CLASSICAL CHART PATTERNS
🤝Let’s learn and grow together 🤝
══════════════════════════════
Hello Traders ✌
After a careful consideration I came to the conclusion that:
- it is crucial to be quick in alerting you with all the opportunities I spot and often I don't post a good pattern because I don't have the opportunity to write down a proper didactical comment;
- since my parameters to identify a Classical Pattern and its scenario are very well defined, many of my comments were and would be redundant;
- the information that I think is important is very simple and can easily be understood just by looking at charts;
For these reasons and hoping to give you a better help, I decided to write comments only when something very specific or interesting shows up, otherwise all the information is shown on the chart.
Thank you all for your support
🔎🔎🔎 ALWAYS REMEMBER
"A pattern IS NOT a Pattern until the breakout is completed. Before that moment it is just a bunch of colorful candlesticks on a chart of your watchlist"
═════════════════════════════
⚠ DISCLAIMER ⚠
The content is The Art Of Charting's personal opinion and it is posted purely for educational purpose and therefore it must not be taken as a direct or indirect investing recommendations or advices. Any action taken upon these information is at your own risk.

ISO longOne to watch. Still has a bit of work to do. Squashed between the 200wkly and heavy resistance. Has captured the Daily 200. Watching for it to break and hold the 236.

TD at resistanceLooks good for entry if we can hold the 236 - capture the 200MA and get through the trend line.
Fairly plan sailing!

CEU longBroken through the 236 after initial fail. Upper channel may cause a pull back. Plan to play up the FIB ladder once we get an acceptable 4 hour pullback.

CTS inside the channel On the chart we can see a descending falling channel. The price remains inside the channel.
If the price retests the downsloping support, it would be the entry for a long position.
The target would be at the downsloping resistance.
If the price moves higher and retests the resistance, it would be the entry for a short position.
We would target the lower boundary of the channel.
Two possible scenarios are shown on the chart.
Cashed up Nickel junior breaking out on strong volume!QNI is breaking out on strong volume. $4M+ in cash. Big discount to last 0.20 financing! Nickel spot prices have seen positive action recently.


zigzag (GLXY)Galaxy Digital Holdings Ltd. is a limited partner in Galaxy Digital LP, a merchant banking institution dedicated to the digital assets and blockchain technology sector. The firm operates across four business lines: asset management, trading, principle investments, and advisory services.

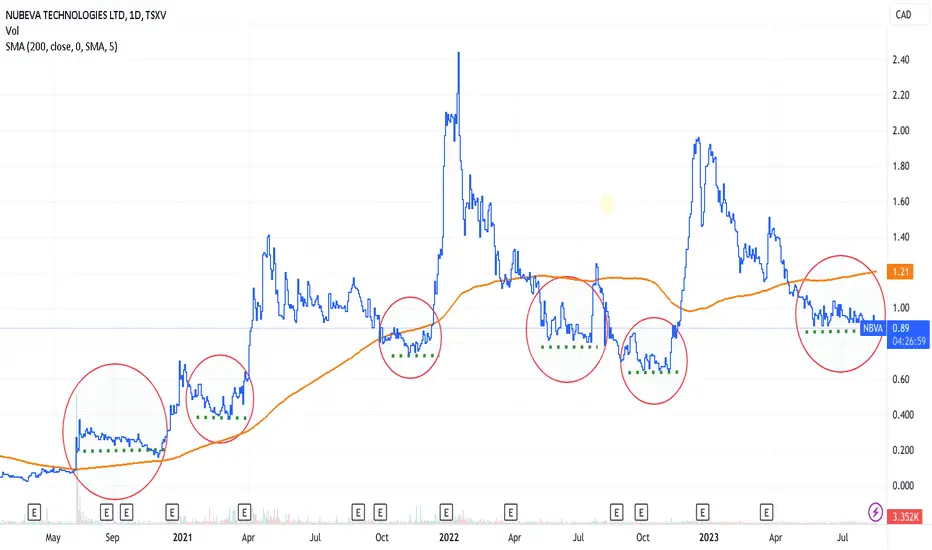
NBVA / NBVAF - Base formation = progress and potential breakoutNBVA / NBVAF - Nubeva Technologies - has patented a solution to ransomware. It is an endpoint software - easily and inexpensively deployable - that intercepts and enables fast, inexpensive and complete reversal of ransomware infection. It has been tested extensively and validated by third parties. Sales numbers may ramp exponentially over the next several quarters. The economic and security benefits of their product are significant. It is an SAAS model.
Thinly traded, the stock has previously formed several bases and tested significant breakouts that sputtered from lack of support.
With increased visibility and an expected improvement in company fundamentals, as well as the potential for meaningful news flow, an explosive move to the upside is possible - support levels will rise accordingly.
NEO formed a triple bottomNEO (Canada) is engaged in the extraction and production of rare earth metals, etc. Other similar companies are e.g. Lynas (Australia) and MP Materials (USA).
My post is preferably a technical analysis.
Neo has been in a declining trend and is still so as the SMA 50 is below the SMA 100 which is below the SMA 200 but they converge. And there is formed a triple bottom, which is a reversing formation (1,2,3). If we get a significant break above the resistance line at 9.04 there is a buy signal. Conversely, if break down at the support line 7.94.
There has been a poor correlation between price peaks and volume peaks, but since the end of June the volume balance has been positive.
RSI 21 follows price and OBV rising from end June.
The sum of Oscillators and MA stands one day to one week on purchase and one month on sale.
Consider the stock technically neutral in the medium term – one to 6 months.
Fundamental analysts (5) are predominantly positive about the stock and have a price target of CAD 13.
NOTE! Liquidity is slightly low at an average of 62,414 per day.
NOTE! There is a geopolitical risk as part of the business is in China. 32% of turnover comes from China.
Keep in mind that you need to do your own research and assessment before buying and selling.
Disclaimer: I have a position in the stock.
Sources: Trading View, Yahoo Finance.

Falling wedge breakout - upside continuationFalling wedge breakout - upside continuation
price crossed 200 DMA

Long on Canadian. Demand zone failed. Risk management The trade setup.
Anytime I enter a trade, key word is trade management. How much am I willing to risk is my first calculation. comparing to my Reward, yield a risk management. In this case I was willing to risk 8 to 10 points for a reward of 20-30 points. a ratio of 2.5 is ok, but I would like to see a Risk Reward of 3-5
Why I took the Trade. The odd Enchanters
- the Stock is Strong one, making a Higher High (HH) in June-2021
- the correction drops into the DZ that is HL of the Week uptrend
- Imbalanced selling into a DZ; nice
Things I can improve on
- time my Enter of the LNG to be tighter (less risk)
Things I learned.
- The Long-term (M) was not with me, meaning technically the monthly chart(M) was in a downtrend. this actually violated my trade plan but I took the trade anyways
- Before the correction. Price did make a HH on the (W) but not a Higher Close (Red Circle);indicating slowing buying momentum

Is it time for numinus to break out?Notice and disclaimer
no financial advice; if you invest, you are investing with your own money for which you are responsible and; you can lose 100% of your money;
Historical returns are not equal to future returns;
no medical advice, go to the health professional you trust for medical advice.
This is for the purpose of knowledge sharing and entertainment.
Best analysis in 3 points from an overall level;
Numinuswellness has been in a declining trend since January 2021 i.e. about 2.5 years;
Normally, stocks that are good tend to turn upwards after such a downward period; bear markets usually do not last longer than 2-3 years as a rule before trend reversal occurs;
We see numinus tried to break 0.25 Cdollar, next step will be 0.30 and 0.40 after that we have a confirmed trend reversal.
We do not yet know if numinus will stay sideways for a while longer;
But much of the psychedelic medicine industry is showing positive fundamental results;
Numinus sales increased by 1000% year on year last quarter and 19% quarter on quarter.
If now numinues went from 0.20 to 2.2 dollars in 2020, it has the potential to take that record with proper measurement this time as the position for such a move is stronger in the economy and the belief and evidence that the products and services work.
I think 16-24 Cdollar is quite reasonable for the next peak trend and the peaks after that will be up to 30,40,50, 100 Cdollar.
The mania is probably at its peak and many will take profits regardless of fundamental results.
Another exciting fact is that numinus wellness is engaged in research on psylocobin fungus and even has experiments on those who have schitzofrini and bipolar diagnoses in a medical context, which we did not see 5-10 years ago.
They also have a podcast that is appreciated where they give a balanced view in the field.
Numinus has also become a partner with MAPS to do studies and work together with mdma and psychadelic therapy, MAPS is the largest psychadelic non-profit organization.
I think we will reach 16-24 dollars by 2027.
Conclusion: it will be exciting when the numinus breaks out of 0.30 and 0.40; as well as a very exciting industry that is demonstrably growing and has the chance to flood in the near future in the next few years.
Sources:
psychedelicinvest.co...rts-q3-2023-results/
numinus.com/research/
numinus.com/podcast/
numinus.com/mapspartnership/
www.youtube.com
www.youtube.com
