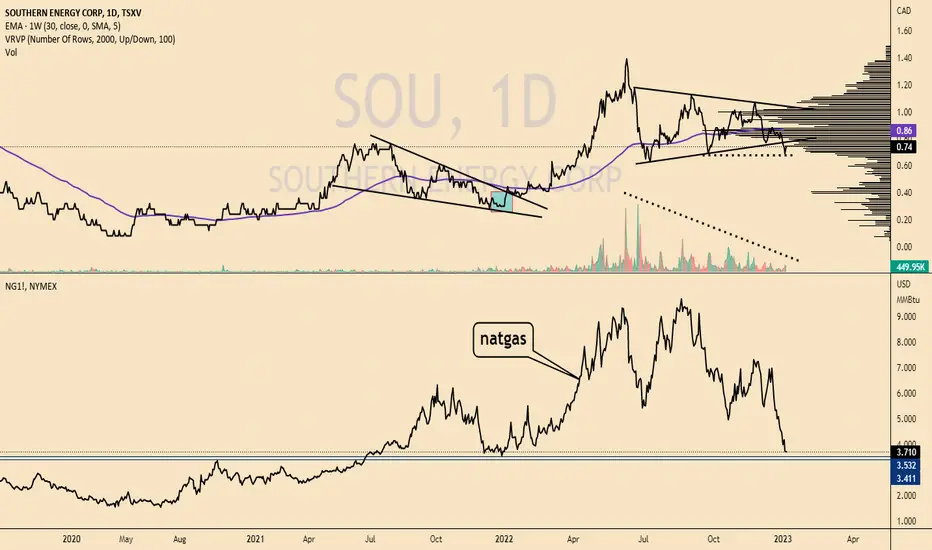
natgas done droppping?I think it has been consolidating bullishly since the July low of 61 cents. Declining volume shows sellers drying up. Possible double-bottom after a false breakdown.
#Natgas approaching huge support. Isn't $sou.v printing money already/soon?
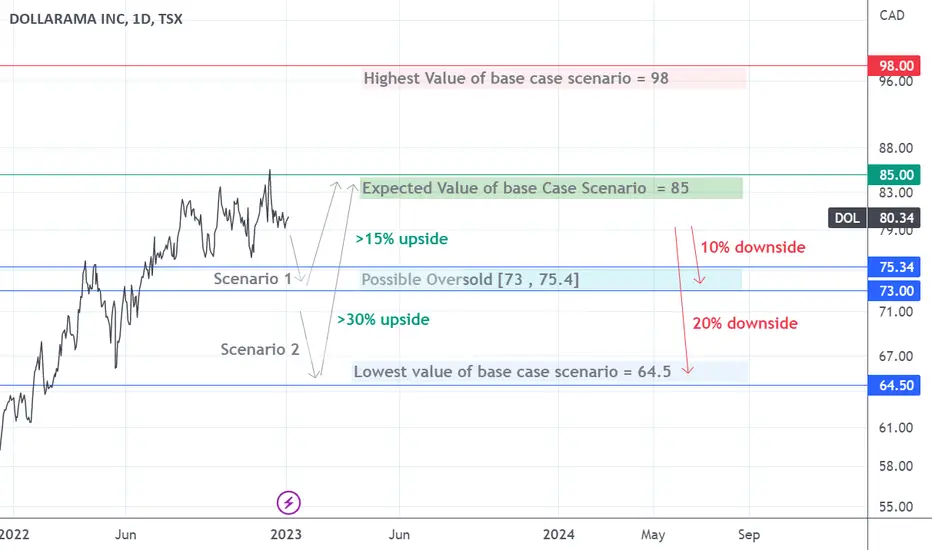
DOL: signs of upside exhaustionsDollarama steadily rising trend seems to have stalled since Aug 2022 when stock price struggled to move above 83.5. Although the long-term bullish trend still is intact, however some signs of upside exhaustions indicate the possible downside risk toward a range between 73 and 75.4.
Dollarama’s stock price is currently trading above 200-day moving average which suggests the long-term sentiment is not bearish; however, as stock has started to show some sings of weakness the risk of a downward move within the first quarter of 2023 has increased. A resistance zone ranges from 83.45 and 86 while supports are seen around 75.4 and 74.1. At current level Dollarama’s stock price offers a poor risk-reward given our base case scenario of 79.4 and 85 for March and Dec 2023 respectively.
If price falls between 75.4 and 73, it would offer 10 to 30% upside potential while the downside risk is estimated to be around 10%.
GIGA Metals Corp. Nickel stockGiga metals 3D chart
-Bollinger squeeze forming
-I am bullish Nickel
-has consolidated for months
-small 30mil Mcap compared to project NPV
-looking for a pop in price if Nickel price remains are increases
None of this should be interpreted as financial advice, I am not a professional or certified financial adviser! all charts, and or analysis' are my personal opinions and observations only!

Klondike Silver may be on the cusp of something BIG!I believe we are on the cusp of a major decision. Retesting the descending trendline has potentially created a strong bull flag. If it bounces above 30 cents I think $1.00 is inevitable and the setup for the 5th elliot impulse wave is strong. Of course, a huge rise in the silver spot price is a must for this to be possible.

Canopy Growth: Ball Drop 🪩Just like the Ball in Times Square every New Year's Eve, the Canopy Growth stock is currently dropping it low. We expect the course to dig deeper into the blue trading area between C$3.49 and C$0.70 until it finishes the grey wave II. After completion, we're expecting the course to rise further North in the longterm. In our alternative scenario, the Canopy Growth stock course might exceed the C$5.55-mark already now, without pushing for further lows below the support line.

DAILY SECTOR WATCH🟢WEED STOCKS TOP 10
Teradyne
Curaleaf Holdings
Green Thumb Industries
Trulieve Cannabis Corp
Canopy Growth Corp
Verano Holdings Corp
Cronos Group Inc
Tilray Brands Inc
Cresco Labs Inc
SNDL Inc
🔴CRYPTO COINS TOP 10
Bitcoin
Ethereum
Binance Coin
XRP
Dogecoin
ADA
Matic
Tron
Dot
Solana
🟣INDEXES
US30
S&P 500
FRA40
GER30
NTH25
ASX200
EUSTX50
JPN225
HK50
Banknifty
🔵SPACE STOCKS TOP 10
Iridium Communications Inc
Ses
Rocket Lab USA Inc
Aerojet Rocketdyne Holdings Inc
Viasat
Maxar Technologies
Eutelsat Communications
Astra Space Inc
Sats
Planet Labs
🟤RETAIL FOOD STOCKS TOP 10
Kroger Company
Albertsons Company
Sendras Distribiduira S A
Sprouts Farmers Market
Grocery Outlet Holdings
Weis Market Inc
Ingles Markets Inc
Arko Corp
Companhia Brasileira De Distribuidao American
Beyond Meat

OTEX LongDidnt post this one on entry as felt unsure. Looks to be moving but may still be flat. Targets are the 236 1st. Smaller position. Usual SL management.


IMG - Bullish MomentumBullish Momentum:
IMG established a double top and then retraced around 0.38 levels on Fibs. And bounced back beautifully. And maintaining its upward channel.

CNR - Canadian National Railway Long Idea Looking to take a shot Longing CNR at the 50% Retracement, also a support level, waiting to see how the next few days go.
Coming straight down to the 50% Retracement would put RSIs on lower time frames in a more favorable position as well

PNE Long-Term Bear Market starting within a few years?My Momentum Master indicator is showing extremely overbought levels on the Monthly, so when the red/white/green histogram falls below 15 it will signal the likely beginning of a tremendous bear market that could last 3-6 years overall.
We can see what happened last time this signal occurred on PNE as indicated in my drawings here.
Of course based on the previous high and higher high making an ascending resistance means there is more potential upside first.

BITF cyclical trade/investment (3-5 years)There a strong probability that the price can break lows $0.28 lows. But buying at these prices unleveraged is still great opportunity.
In terms of sentiment on financial blogs and social media, most are wholeheartedly predicting the future demise of this stock. Personally, this exact same mentality surrounding this stock at its highs in terms of how they somehow knew it was underpriced and that it had upside potential. As usual the crowd is often wrong. Always a hard pill to swallow for them...
(no bullish sentiment in terms of price action)
There's a lot of uncertainty surrounding bitcoin miners and many are not able to keep up with how things are going.
The risk are undoubtedly high and reward is EXTREMELY high... If they are able to manage this and survive.
Obviously, the need to keep up to date with the crypto market and this stock is needed to determine if the risks are not worth the investment. example -> If something occurs with BITF and they seem to be going the wrong direction and if BTC drops extensively.
I highly doubt that though seems like the majority of the pain and washout has been done and those who got burned left and those who survived will thrive.
Mostly leaves it how macro develops and when it will allow BTC to thrive.


ATZ short-term pull backATZ breaking of daily timeframe trend line with bearish RSI divergence and increasing MACD histogram level.
Momentum to the downside will likely to drive price lower to $43 area (10% downside) and if that breaks next target around $36. If rebound from $43 then look to long again.
Fundamentals remain strong, but requires confirmation of ability to sail through excess inventory in the next earnings call

Niocorps Developments - the Big One CountThis Eliott Wave Count of Niocoorp Develoopments reflects a bullish longterm Supercycle upward impuls pattern of the marcet.
Wave 3 upward impuls pattern should lead the PPS of the shares above 106 Dollar propably higher, after the a-b-c running correction of the past months. If the abc correction should last a little bit longer the 0.84 Dollar are an exiting entry point. Bu this scenario of a wave c extension within the running correction is not necessary. PPS can explode anytime within the start of the Wave 3 upward impuls.
Note: This is no advice to buy or to sell a stock. Stock can rise or fall. Each investor is acting on his own risk.

Cenovus Energy Inc. oilCVE stock on the 3Day time frame.
-Looks like a double top to me
-I am bearish to neutral on CVE
-48MA turning down, if the 13MA crosses also I'd be more bearish
-Highly dependant on Oil price but when main market sells off its a double wammy
None of this should be interpreted as financial advice, I am not a professional or certified financial adviser! all charts, and or analysis' are my personal opinions and observations only!

Silver stocks BCM DSVSilver stocks on the 1hr time frame.
-big volume coming in to some quality stocks here.
-waiting for small pullback to enter
None of this should be interpreted as financial advice, I am not a professional or certified financial adviser! all charts, and or analysis' are my personal opinions and observations only!

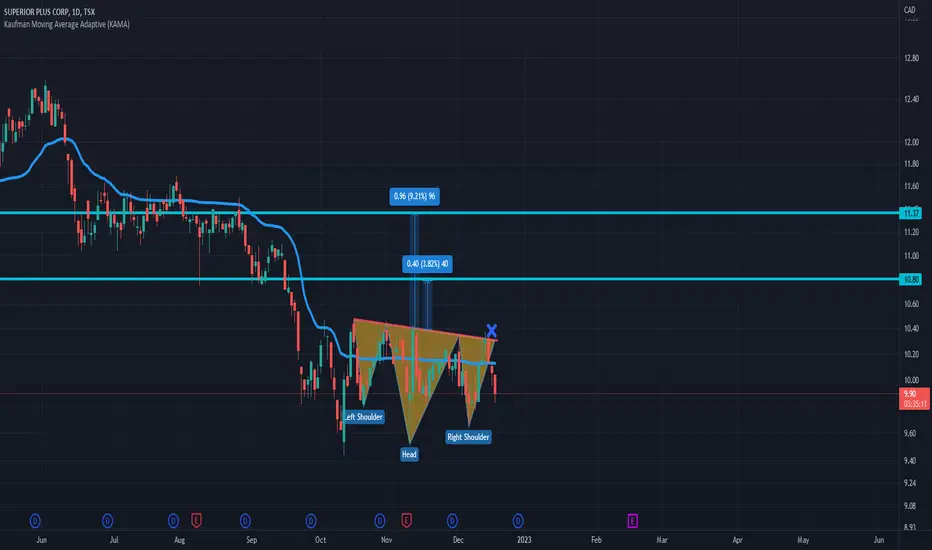
SPB // Inverted shoulder-to-shoulder formationLet's look for closures where I indicated with X. The targets are determined according to Fibonacci.
There is Hope I got my love for TA first in Crypto, so of course I would want to get in on WNDR,
WNDR is a long hold for me and also one I gather for future plans,
as a new stock we have the opportunity to watch it as time pass and understand how it flows
its also nice that if it plays in the same trendline its only until the end of Feb until it hits 0.005 cents lol
so it has to do something by then lol
but I love the easy to see resistance and support going back up to Feb 2022 prices
lots of opportunity to double up on stocks just by selling and buying.
but that's only if you think Crypto is going make a come back like I think it will in time but mort likely not with out one or two more dips

$27M mkt cap, $27M in cash. In historical support area.Trading at cash value (as of last financials). In historical support area. Active share buyback program. Good news flow. History of big bounces.

PEY // Triangle pattern Resistance breakdown requiredIn case of closing where I indicated with X, the targets are determined according to Fibonacci.

AQN // Resistance breakdown requiredIn case of at least 2 closures above the wedge indicator, the targets are determined according to Fibonacci.
