BAM, Short, 2h✅ BAM is overbought and showing signs of retracement. The price is expected to move lower, targeting the key support level at 83.80.
SHORT 🔥
✅Like and subscribe to never miss a new analysis! ✅

WCN, Short, 2h✅ WCN is currently forming a Cup and Handle pattern, signaling a potential bearish setup in the short term.
SHORT 🔥
✅ Like and subscribe to never miss a new analysis! ✅

Enbridge Setting Up For An Inside Bar Entry On A PullbackWe are going back to well after previously recommending TSX:ENB in one of my other one good trade videos. In this video, I cover the concept of swing trading pullbacks. I got into depth of the price action on the pullback and I explain where I would put my stop and take profit.


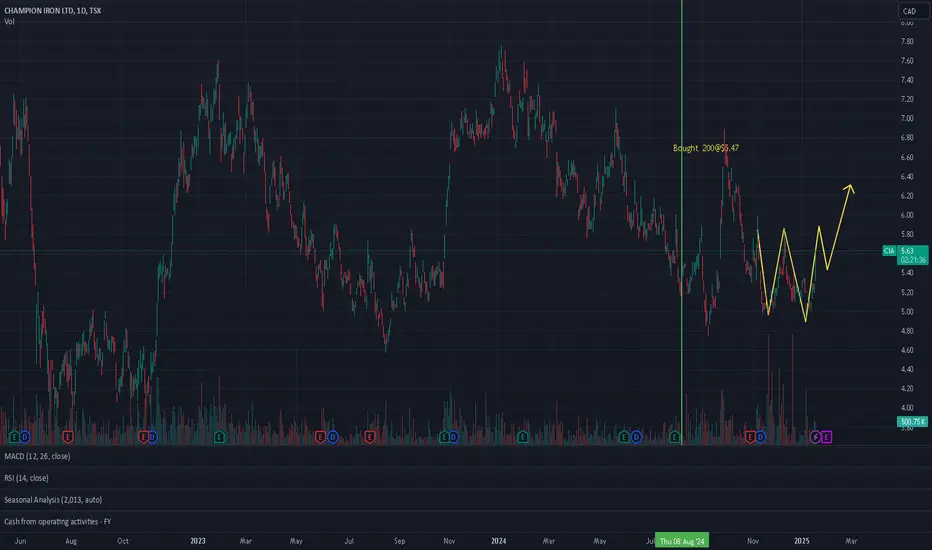
This seems like a total slam dunk 0.50 is the first targetFollowed this stock for a while and Don Durrett brought it to my attention again see youtube search the name "Optionality Update (January 2025)"
After the spike in Lion One I will move some of my funds here.
Also the Gold/ Silver ratio is now 91 and I expect it to move to 50 in 2027

A decade of gold is coming up.Lion One is THE Fuji miner, nowhere in the world higher grades.
This should be valued as a B2Gold @ 2.00 instead of 0.36

TASEKO Mines LTD Buying Opportunity ?I'm very interested in investing in Taseko Mines, as I believe it's poised for a significant upward move. From a technical perspective, I strongly feel we’re on the verge of a healthy retest before marching higher. On the fundamental side, I’ve been closely monitoring their financials, and they appear quite promising. I’d love to hear your thoughts on this.

$ZTE.C finding support on recent pullbackAfter breaking out to new 52 weeks highs over $0.40, resistance was found at $0.47. Share price has pulled back, attempting to fill a gap at $0.37.

A trade can be a small winner or loser, big winner or loser.In a world of 50/50 probability. flipping a coin for instance. it can go either way, a head or a tail is a game of probability. likewise. A trade can be a small winner or loser, big winner or loser. as the small winner and small losers even themselves out. how to eliminate the Big loser than you are only left with big winners
The Setup
- Current chart(W) is an uptrend
- Long-term(M) is unclear
- Price comes into the Demand Zone (DZ) which is HL of the (W) uptrend.
- Good place to ENTR the LNG
The Probability enhancers
- Clear STP Loss below the DZ
- Room for profit to run with little selling resistance
The trade went as planned. I had a nice profit of over 1000 dollars when the price peaked, however my profit target was set too high & I never got to cash in. The price crashed this morning below my trailing trigger STP of 18.40 and I sold making hefty 183 dollars. but i feel good about it. I respected the rules and the market won. Looks like the price is forming a channel. I am setting at 17.50 waiting to go LNG at the bottom of the price channel

KEEP TRADING SIMPLE - DRMNot giving us much to work with on the volume side. 3 Bottoms - Not convinced it is fully landed but keeping on eye on it. Will enter trade at support confirmation.

HODL on a little longer before buying more.... Just an idea of HODL's current pattern. It appears to be built on shaky foundation...still a bunch of noise about CHIA on the boards however the figures are so wildly entertaining it would be a 1 - mil long shot that Tony scored the deal the way people are talking.
Currently we are bleeding based on BTC cost...how long can the soccer star keep up the appearance before he has to unload some to cover costs? I was a fan...now I'm a skeptic....still holding for an exit but not happy with the current situation.

Canopy Growth LIFTOFF NOW! Be ready!Canopy Growth looking amazing - all 5 waves are done. Bullish signals are here NOW.
Dont be a looser, buy a .. stop loss. Safu your capital!

Canopy Growth LIFTOFF NOW!Canopy Growth looking amazing - all 5 waves are done.
Bullish signals are here NOW.

LIF-- Bullish SignalThis chart illustrates a classic double bottom pattern. The price also cross the neckline, the bullish momentum takes over, suggesting a potential target around $31.42 based on the pattern's height. Seasonal and volume shows very strong.

CGX (Cineplex Inc.) - Potential Pullback After Breaking TrendlinOn the 4-hour timeframe, CGX has recently broken below a key trendline that originated in late November, signaling potential weakness ahead. Here’s the detailed analysis:
1. Overbought Conditions: The RSI has climbed above 80, indicating overbought levels that often precede price corrections. This aligns with a bearish divergence seen in the MACD, which is starting to curve downward.
2. Support Target: If the pullback continues, I anticipate a move down to around $11.20, a level that aligns with prior support and Fibonacci retracement zones. This area could serve as a critical level to watch for potential reversal or consolidation.
3. Bearish Momentum: Moving averages on this timeframe are beginning to reflect weakening momentum, though the broader trend on the daily chart remains bullish.
Key Levels to Watch:
• Resistance: $12.00 (a failure to break below this might attract buyers early).
• Support: $11.20 (critical for confirming the pullback and setting the stage for a potential rebound).
Risk Factors:
While the technicals lean bearish short-term, a return of strong buying pressure or broader market positivity could invalidate the correction and see CGX resume its upward trajectory.
Let me know your thoughts—does $11.20 align with your analysis, or are you watching other levels?


AND- looking bullishAND- looking bullish - With Year on Year & QoQ increased Earnings with DOUBLE BOTTOM pattern developing on charts - looking for a bullish trades

PSI looking bullishPSI looking bullish - looking bullish - With Year on Year & QoQ increased Earnings with cup & handle pattern developing on charts - looking for a bullish trades

Altius Minerals – Looking Great for the Long TermAfter 4 months of consolidation, we’ve finally broken out, retested the level, and confirmed the move.
This is a solid company with a strong balance sheet, great management, and good fundamentals. Definitely worth keeping an eye on if you’re thinking long term!
Always do your own research before investing.

One Good Trade: ENB Trapping Bears On Solid Price ActionThis one is simple, I covered it more in-depth on my Market Overview (shorter version on YouTube). This trade is setting up nicely with a touch of the keltner channel and a pullback that essentially trapped bears with a really nice setup bar.

BUYTSXV:QNC After a week of significant decline, the asset seems to be showing promising signs of recovery. Today, the delta has turned positive, a signal that could indicate a possible reversal to an uptrend. or even gradual growth in the short term.
TO THE MOOOOOOOON 🚀🌕
