Fortune MineralsInteresting day. The volume is low, but has crept up every so slightly over the last couple of days, and then today’s announcement, which puts the project forward a bit, but doesn’t really clear hurdles. Looking to March for news on the sample testing. The price itself may clear hurdles though, as it looks to test the 200 day ma. We shall see. Return to $.10us, and you could see $0.25 pretty quickly.

GSY on TSX - a buyReason for Entering This Stock Today:
This stock is currently showing strong bullish momentum across multiple timeframes. Here's my rationale for entering:
Weekly and Daily Uptrend: The stock is trending higher on both the weekly and daily charts, confirming sustained strength in the bigger picture. I'm looking to align my trade with the dominant trend.
Testing Key Anchored VWAP and Demand Zone: Price is testing an important anchored VWAP level and a prior demand zone, areas that historically attract buyers. This confluence of support strengthens the probability of a move higher.
Intraday Structure: On the 30-minute timeframe, the stock is forming higher highs and higher lows, a clear sign that buyers are stepping in and maintaining control. This adds further confidence to the bullish setup.
Trade Execution: I entered this position this morning with my stop placed at the low of the 30-minute timeframe, keeping my risk defined and manageable. Remember, trading is personal—pick your own stop level and adapt the trade to fit your own strategy and risk tolerance.
This setup looks ready to go, and I’m eager to see how it plays out! Always trade with a plan and manage your risk effectively. 🚀


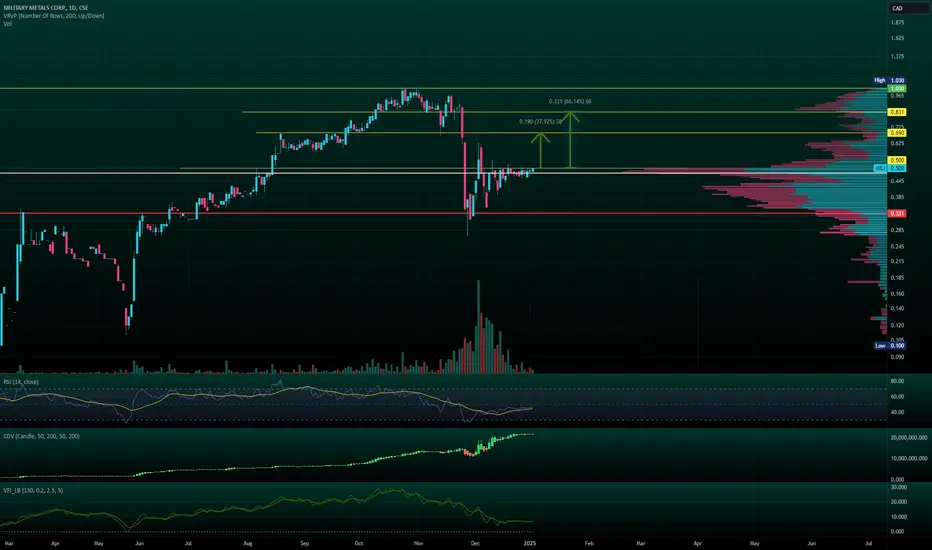
Support formed after selloff, up from here(My other post broke my chart) After a particularly ugly selloff, the price has stabilized around 0.5CAD. I believe the price will move, potentially next week, ultimately reaching 0.69CAD, followed by 0.83CAD. There is certainly potential to move higher, but I wouldn't expect a move past the recent highs until MILF (huehue) shares their economic report for their Trojarova deposit, hopefully this spring. At that point, it could be game on for higher.
You can see a wedge? triangle? pointy polygon shape, with lower lows and a resistance level at 0.5CAD that will be broken through soon.
Pyrogenesis a sustainable solution
Pyrogenesis is a company that works with pyrolysis. Pyrolysis is the thermal decomposition of materials at high temperatures in an inert atmosphere, producing gases, liquids, and solid residues, that can be used as energy resources. This can be done with plastic meterials which makes it very sustanible. This could be a protential for a good future.
For the technical analysis, the prices has hitted a double buttom at 0.40 and the RSI is beginning to stabilize. It had its peak just before corona at 12 which means that the company ones had the ability to be at that rate. Companies like NYSE:CVNA , NASDAQ:UPST , OMXCOP:NETC has shown sign of reversal. Why wouldn't pyrogenesis fly?

FSZ Analysis: Potential Breakout from Downtrend📉 Overview:
Since early November, FSZ (Fiera Capital Corp.) has been in a clear downtrend, forming lower highs and lower lows. However, recent price action indicates consolidation near the $8.50 support level, forming a symmetrical triangle pattern on the 4-hour chart. This could signal a potential trend reversal.
Key Observations:
1. Symmetrical Triangle Pattern:
• FSZ is consolidating, with price action compressing toward an apex.
• A breakout above $9.00 could confirm bullish momentum.
2. Indicators Point to Recovery:
• RSI: Recovering from oversold territory, indicating easing bearish pressure.
• MACD: Showing signs of a bullish crossover, with diminishing bearish momentum.
• Volume: Low during consolidation. A breakout needs volume confirmation.
3. Moving Averages:
• FSZ remains below both the 50-day and 200-day moving averages. A breakout above these levels would validate a reversal.
Key Levels:
• Resistance: $9.00 (short-term), $9.50.
• Support: $8.50. A breakdown below this could target $8.00.
Price Projection:
• Bullish Case: Breakout above $9.00 could target $9.50 - $9.75.
• Bearish Case: Failure to hold $8.50 might lead to further declines, potentially testing $8.00.
FSZ is at a critical juncture. If the RSI recovery and MACD bullish signal align with a breakout above $9.00, it could indicate a trend reversal. However, caution is warranted without volume confirmation.
Disclaimer: This analysis is for informational purposes only and not financial advice. Please conduct your own research or consult a financial advisor before making investment decisions.

Volt Lithium ready for healthy uptrendVolt Lithium recently announced the successful deployment of their new DLE field unit in the Delaware Basin in partnership with a significant oil and gas producer. These units can be tailored and scaled for production at individual oil and gas well sites, making Volt's production flexible, geographically decentralized, and cost effective (Volt has one of, it not, the lowest lithium production costs as well as the lowest recoverable PPM that I have seen). Volt is a leader in current DLE production and has the benefit of maintaining a very low all-in sustaining cost- and ability to start small and scale upward. Volt's management team comes from the oil and gas industry and understand the business, giving them an edge on their competitors.
Looking at the charts - the price trend is holding strong and is touching both against the upper boundary of a wedge as well as bumping against a significant price level. I have hidden the much older price action that happened prior to the restructuring of the company into a pure lithium-focused company. I am expecting an eventual price breakout to the upside where the market cap reaches ~$250M USD or greater in the coming months and year. In the short term the price may either experience a modest pullback into this year's trading range or generally hold at this level prior to a breakout upward. Breakout above the wedge and holding steady above ~$0.5 CAD for a few days or weeks will be a clear indicator to me that we will see upward price movement over the coming months.

1.1.25 Brookfield 82.62 CAD - Danger!I stated on another analysis the big advanteges of this fine and exceptionell company.
But as a matter of fact, the share is in a very special situation, which does not give an optimistic outllook for the next monthes.
I expect sharp correction for about minimum 15%. Only reason: charttechnical situation, which we saw in the past three times. And in every case, a correction for about mininum 15% was the result.

Buyers soaked up MILI sales in DecemberSimple post - looking at the monthly, the volume in December and notable price stabilization following the massive sell-off in November makes me lean bullish for the short term.
Folks seem to like taking profits in January, but it looks like MILI has already seen its share of profit taking.

Who remembers the cannabis mania?Who remembers the cannabis mania?
Canopy Growth went up over 152000% percent in 8 years.
Now has given most of it back, down a whopping 99.5%.
Not everything that goes up violently, stays up.
Remember this lesson.

NILI.V Possible Trend Reversal & Entry - First AnalysisNILI.V (Surge Battery Metals)
Candlesticks:
This past week NILI.V closed Thursday with a dragonfly doji candle, followed by a bullish engulfing on friday. The last time a dragonfly doji appeared was on September 9th, which marked a trend reversal that resulted in a 90% in price over 45 days.
Technical Indicators:
MACD on the daily is about to crossover indicating a possible shift in momentum from bearish to bullish.
Possible Entry:
looking for a confirmation on the trend reversal on Monday with a candle closing above the downward channel that Nili has been trading in over the past couple weeks. If that happens I will take a long position and be looking for profit taking opportunities at .40, .45, and .50 cent price ranges.
I am new to trading and this is my first analysis. Let me know what you think and if I got anything wrong here, any feedback is appreciated!

19.12.24 Brookfield 79.88 CAD: Correction in progress!
Brookfield, one of the best Fund of Funds. Super positioned in various markets and sectors.
Top CEO with lot of money in his company, strong and stable earnings and revenue.
No hype, no scandal - pure and hard brainworkers, with excellent human factors.
Perfect share for everyone, who will not spend all the time for market screening.
Put it right time in pocket, and let the rocket rising with patience for years.

FTRecord low volatility as recovery Adam and Eve is contained under all-time overhead. This has the effect of compressing the eve, or inverse head and shoulder component of the formation as it gets late, as we are now. Low volatility begets high volatility. I’m betting big that the floor holds, and imaginary overheads evaporate.

FTThis ticker begins with a descending triangle, into a price capitulation, which sets the low. Then, the recovery looks like a Adam and Eve formation, where the Eve is an inverse H&S. That puts us at the right inverse shoulder. En den? Yes, an den.

EXN ready for a little rallyGold Silver and all the other miners got slaughtered recently, so I'm curious how this will work. Excellon is in a good jurisdiction well financed insider buying all that stuff. Technicals show increased volume price keeping pretty steady despite the sector sell off. We have been consolidating inside a triangle and a wedge giving us two targets. If gold and silver reverse losses, fed cuts EXN might catch a nice bid.

Upside for BlackBerry?Reversal pattern found on BlackBerry. Confirmation low on the three rising valleys pattern with huge potential upside.

A little more down, then watch for itI’m analysing GO Easy on the 30-minute time frame, focusing on three anchored VWAPs and several identified support levels. My expectation is for continued downside movement, with potential reversals at key areas of interest. I’ll be monitoring for a shift to higher highs at these levels before considering an entry.
In the short term, I anticipate that price action may test support-turned-resistance (or resistance-turned-support) zones, possibly with a liquidity spike. Following this, I’ll watch for interaction with the downtrend line, looking for a breakout and retest.
The longer-term outlook suggests the possibility of a cup-and-handle formation developing. However, in the short term, I’m focused on waiting for confirmation of a reversal on the 30-minute chart before making any trades.

Aftermath, silver minerI think there would be another leg to the downside and it provides a good entry point for long position.


A signal so bullish it might make you $CMKey Stats
P/E Ratio: 12.86 (below the sector average of 11.8)
Dividend Yield: 3.89%, with consistent payout history
Next Earnings Date: Feb 27, 2025
Recent Upgrade: Barclays raised target to $98 (Nov 30, 2024)
Revenue Growth: 7% YoY
Top 3 Technical Reasons for Bullish Bias
Breakout Zone Approaching: Price testing $94, a critical resistance from August. Break here unlocks $100+.
Golden Crossover Incoming: The 50-day SMA is edging toward a crossover with the 200-day SMA—classic bullish signal.
Strong RSI Rebound: RSI at 58, climbing but not yet overbought, suggesting more room to run.
Top 3 Fundamental Reasons for Bullish Bias
Undervalued vs Peers: Low P/E and price-to-book ratio make CM a bargain in the Canadian banking sector.
Dividends Make It Rain: 3.89% yield at this valuation is a fortress for income investors, even if growth slows.
Economic Recovery Boost: Canada's improving GDP and housing markets directly benefit CM’s retail and mortgage banking units.
Potential Paths to Profit
1️⃣ Lowest Risk: Buy shares outright and collect that juicy dibadend while waiting for the move to $101.
2️⃣ Options Play: Buy LEAPs.
Disclaimer: We are not a brokerage or investment firm. We do not offer financial advice or investment advice and/or signals. This is not certified financial education. We offer access to the daily thought process of an individual and his experiences. We do not offer refunds. All sales are final.

Cineplex $CGX making a comeback!Key Stats
Price: $12.63 (as of Dec 1, 2024)
Market Cap: 798M CAD
Revenue (TTM): 1.39B CAD (+1.95% YoY)
P/S Ratio: 0.78
Next Earnings Date: February 2025
Top 3 Technical Reasons (Bullish Bias)
Strong support near $12.50: CGX has been testing this zone, forming a solid base with potential for a bounce.
Breakout Watch: A bullish ascending triangle is forming, signalling a possible breakout towards $16.
Volume Uptick: Recent trading days show increased volume on up moves—buyers are stepping in.
Top 3 Fundamental Reasons (Bullish Bias)
Revenue Growth Resilience: Despite sector struggles, Cineplex's revenue rose 1.95% YoY, outpacing some peers.
Deep Value Play: A P/S ratio of 0.78 highlights undervaluation compared to broader industry averages.
Canada’s Cinematic Recovery: Increased box office sales as tentpole releases and audience confidence return post-pandemic.
Potential Paths to Profit
Low-risk: Buy shares outright and aim for the $16 target.
Options Play: Consider $15 strike calls expiring in May 2025 for leverage.
Disclaimer: We are not a brokerage or investment firm. We do not offer financial or investment advice. This is not certified financial education. All sales are final, and refunds are not offered.

Get ready for the upsideThe stock appears to be in a pullback phase. I anticipate it will find support around the previous monthly highs, keeping prices contained between that level and the anchored VWAP (Volume-Weighted Average Price) from the recent swing high. Once the price advances back up toward this anchored VWAP and experiences a slight pullback, the key will be to break through it. If the stock establishes a pattern of higher highs and higher lows on the 30-minute chart, it would strengthen the bullish outlook.

Looks like good set upPosted this for a follower on twitter:
I'm default bullish when price is over weekly EMA30. I've seen a lot of charts with this set up recently. If you think price can higher than all time highs (upcoming catalysts, macro), then buying anywhere here would be a good DCA starting point.
Lowest risk entry shown.
$ivn.to
OTC:IVPAF
