China Stock - 688167 - Bull run may end by the middle of Dec688167 has experienced a bull run in Nov. According to the time cycle and Aroon indicator, the bullish window may close soon, before the middle of Dec.
Today the RSI climbs back above the MAs, unveiling a short-term window.
Opened a position at 123.8.

China Stock - 002993 - Pivotal MomentIt is currently at a pivotal moment where RSI walks under MAs in CBIndex. Other indicators such as Aroon and Derivative Oscillator also indicate bearish movement.
The time cycle suggests a potential end at this moment of the current fall. The next fall will happen around the beginning of Jan, which may lead to a bullish opportunity this month.
We'll see.

China Stock - Pivotal Moment of 002993The symbol seems to be in a pivotal moment, where the price level was steadily climbing while the DO indicated a down-term trend.
A possible ending may be reached by the end of November.
For an uptrend opportunity, wait to see if the RSI line can pivot upside and cross the two MAs in CBIdex.

China Stock - Potential Uptrend, Need More ObservationIf there's an upside pivot in CBIdx that RSI can cross the two MAs, as well as an upside cross in Aroon, then an uptrend is formed aiming for a peak by the end of November.

One Month Up Trend of 300809Picked by my open source algo at github.com .
RSI and CB Idx indicate a potential uptrend if successfully crossing upwards to the moving average. DO_LB indicates a potential end of the current downtrend period.
Time cycles indicate that there may be a low point by the end of December, therefore the end of this short-term uptrend will possibly end by the end of November.

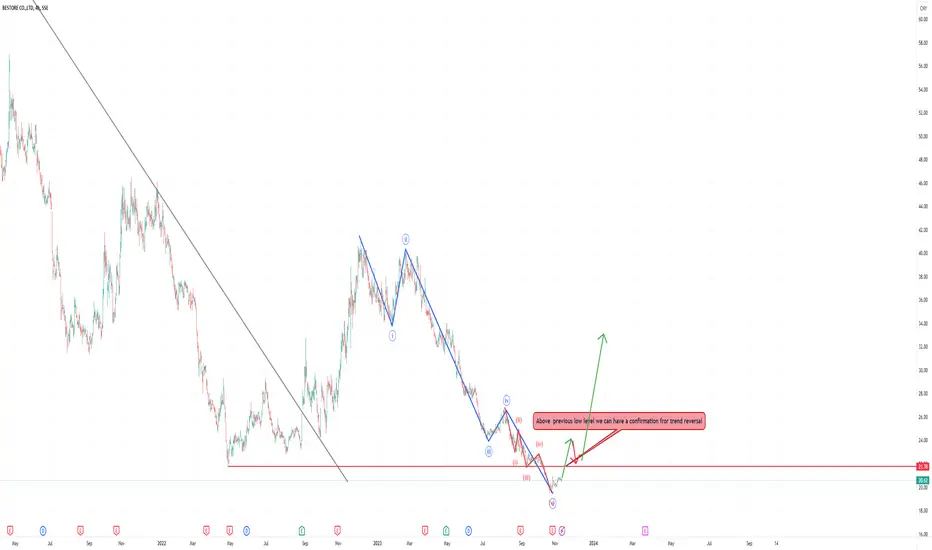
Bottomed?Nǐmen hǎo
We have nice Elliott wave formation ready for trend reversal!
Sure, price always can go deeper but opportunity in this moment for trend reversal is more than good.
Above previous low level is free zone to the upside.
Confirmation can be after breaking and beck test!
Good luck traders
China Stock - Uptrend until the end of November for 688395This stock is picked by my app, please search qingxuantang/chinese_stock_picker on Github.
There will be a short-term uptrend that may end by the end of November. The target price may be around 25-25.3.

Looking for new entry at lower level!Nǐmen hǎo
If our scenario will work, we can cache the big wave 3 and buy and hold can be the best what we can do for long term!
Good luck traders.

Possible big triangle scenarioNǐmen hǎo
If you want to buy and hold than be patience!
The best place to buy level is the lower in this case in wave D area!
good luck traders

Good opportunity for buy and hold!Nǐmen hǎo
We have nice formation with high probability strong movement to the upside in next few months!
Take care around critical level! Possible rejection in that area! Breaking the critical level our next target is the "main target"!
Good luck traders

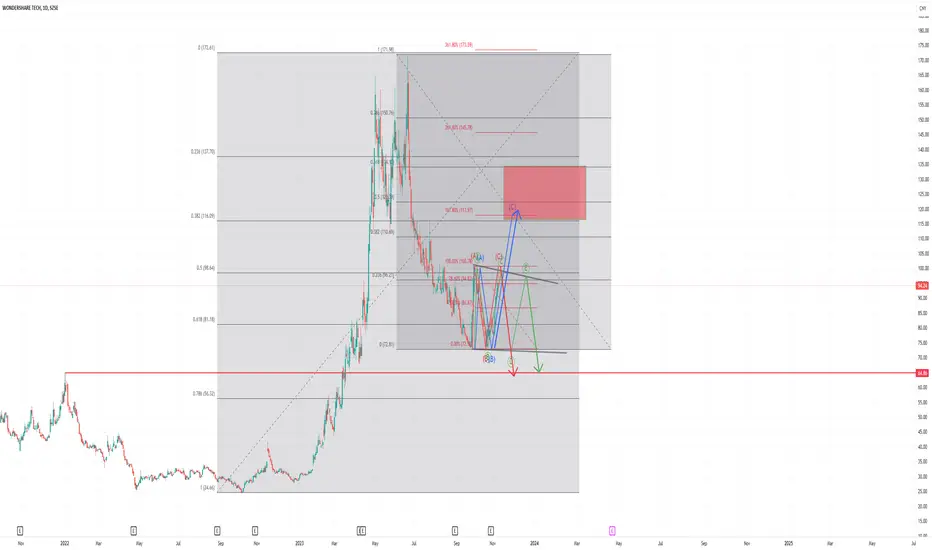
3 possible scenarios!Nǐmen hǎo!
Red, green or blue scenario?
All the 3 scenarios have high probability in this moment, I stay independent in this case.
The green scenario is triangle scenario ABCDE when the decline start line is usually come from wave E.
Blue and red scenario are ABC one to 100% extension and other one to 161.8% extension!
Good luck traders
Backtest and up!!!Nǐmen hǎo!!
We can see a nice breakout from wedge and our main target area is our goal!
Wait for backtest for new buys, buy at correction!
Good luck traders!!!
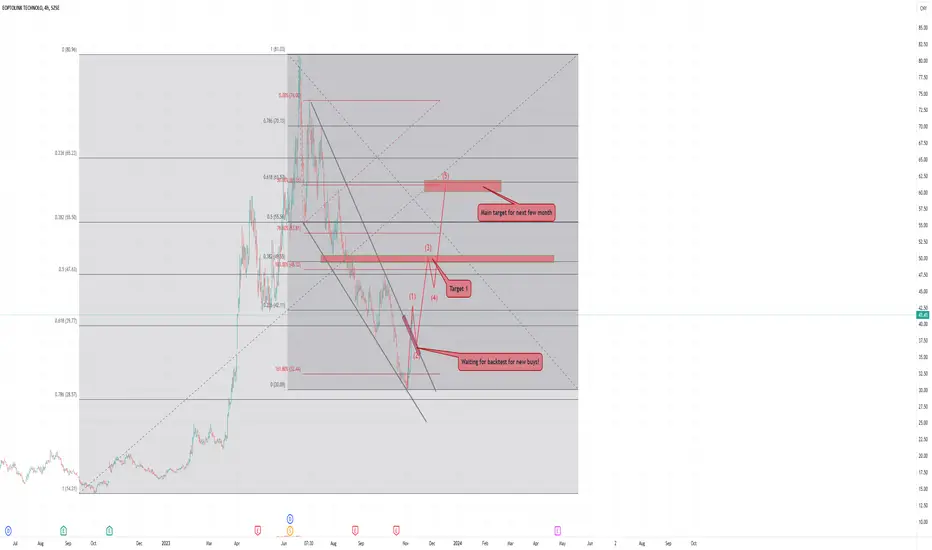
One more wave left to our main target area!Nǐmen hǎo!!
This can be the next buy opportunity.
A very simple Elliott wave setup.
Good luck traders

China Stock - Uptrend in this week for 688433This stock is picked by my app, please search qingxuantang/chinese_stock_picker on Github.
The uptrend has begun since last week and may continue for another week. The selling date is set to be between 13-15 Nov.

Half-a-month Uptrend of 688667Picked by my open source algo at github.com .
RSI and CB Idx indicate a potential uptrend if successfully crossing upwards to the moving average, while the already overbought RSI position should not be ignored.
DO_LB indicates a potential end of the current downtrend period.
Time cycles indicate that there may be a low point by the end of November, therefore the end of this short-term uptrend will possibly end before the first half of November.

Half-a-month Uptrend of 300969Picked by my open source algo at github.com .
RSI and CB Idx indicate a potential uptrend if successfully crossing upwards to the moving average. DO_LB indicates a potential end of the current downtrend period.
Time cycles indicate that there may be a low point by the end of November, therefore the end of this short-term uptrend will possibly end before the first half of November.

300892 Long1.Bullish engulfing pattern
2.Triple Bottom
3.Kweichow Moutai's Distributors Can Absorb Higher Prices

600502 Long1.Bullish engulfing pattern
2.high volume
3.TD Buy Setup 9
4.Shares of Chinese infrastructure companies rise after China approved a 1 trln yuan ($137 bln) sovereign bond issue to for infrastructure construction

How-to use L3 Six-color Divine DragonNOTE: this indicator is optimized for stocks which include financial data, for forex and crypto, it may not work as well as stocks.
**L3 Six-color Divine Dragon** Indicator consists of red profit holders, yellow floating chips, and green trapped holders, along with their 10-day moving averages, totaling six colors, hence the name Six Color Dragon. The dynamic chips reflect the trading and movement of the main chips within a certain range. Purple represents the stock price entering the oversold zone, and yellow represents the stock price in a normal trend. The Six Color Dragon Indicator calculates the price and volume data over a period of time to display the buyer/seller activity. It analyzes the possible behavior of institutional funds based on the price and volume data of each trading day.
- Deep red bars: the current proportion of profitable holders.
- Red line: the moving average of the red bars.
- Deep green bars: the current proportion of losing holders.
- Light green line: the moving average of the green bars.
- Yellow bars: the proportion of daily traders (buying and selling on that day).
- Yellow line: the moving average of the yellow bars.
When the deep red bars > 50%, it indicates strong control of institutional funds and an easier continuation of the uptrend. When the deep green bars < 50%, it indicates retail investors are trapped inside, making it easier for the downtrend to continue.
The intersection of moving averages indicates a trend reversal signal:
1. Red line crossing above the green line: uptrend.
2. Green line crossing above the red line: downtrend.
The process of major manipulation of stock prices can be roughly divided into the following stages:
1. Accumulation stage: before the start of the main uptrend, the main players repeatedly clean up the chips to obtain more cheap chips; trial actions before the rise are also essential. When the selling pressure from external sources exceeds the expectations of the main players, they will continue to clean up the chips until their desired goal is achieved. After breaking through the platform, they choose to rise. During the rise, the main players will choose to lift, clean up, lift again, clean up again... When most investors feel that every pullback of this stock is a buying opportunity, often the top of this stock is not far away, and the main players have quietly started to exit.
By using the Six Color Dragon Indicator and dynamic chips together, we can effectively grasp the various stages of the main manipulation of stock prices:
1. Accumulation - initial rise: in this stage, the typical features of the Six Color Dragon Indicator are a decrease in trapped holders (green bars), an increase in floating chips (yellow bars), and occasional appearance of profit holders. The dynamic chips show that the stock price always fluctuates around the dense peak area of the chips. This stage is more difficult to operate, so it is recommended to wait for the appearance of a buying signal.
Buying signal: the stock price breaks through the consolidation pattern with increased volume, the 10-day moving average of the profit holders in the Six Color Dragon Indicator is moving upward, and the red bars of the profit holders break through the purple moving average of the profit holders; the stock price is more than 10% away from the dense peak area.
2. Trial trading, chip cleaning: after the main accumulation is completed, before a significant rise, there is often a trial trading phase. If a large amount of selling pressure is observed, it is usually necessary to clean up the floating chips, which is called chip cleaning. The chip cleaning is manifested in the stock price as significant fluctuations.
The main features of this stage are: the 10-day moving average of the profit holders in the Six Color Dragon Indicator changes from an upward trend to a flat or smaller angle, indicating a decrease in profit holders, and the stock price experiences a certain amount of decline. However, the dense peak of the dynamic chips remains unchanged, and the stock price usually fluctuates above the corresponding price level of the dense chip area, rarely falling below the dense peak or quickly recovering after falling below.
At this time, we can choose to buy a portion of the stock near the dense peak of the dynamic chips when the stock price stabilizes. We can then add more positions when there is another significant volume breakthrough of the previous high point, and the dense peak of the dynamic chips does not shift upward.
3. Main rise stage: this stage is the main profit-making stage of significant rise.
- The main features in the early stage of the rise are steadily increasing red bars in the Six Color Dragon Indicator and a steady upward trend of the 10-day moving average of the profit holders.
- In the later stage of the rise, the red bars are mostly above the 10-day moving average of the profit holders or around it. The dense peak of the dynamic chips does not clearly shift upward, or even after the shift, the stock price continues to run above the new dense peak, indicating that the stock still has upside potential and can be held.
4. Distribution stage: the main features of this stage are a slow decrease in profit holders, red bars retracting within the 10-day moving average, accompanied by a decline in the stock price and the emergence of trapped holders; the dense peak of the dynamic chips shifts upward, and the stock price falls below the newly formed dense peak, leading to an increase in trapped holders and profit-taking.
Note: when analyzing weak rebounds, the selected range, the time span on the x-axis, and the turnover statistics may vary, resulting in different effects in dynamic chip analysis. Specifically, the range from the most recent point to the highest point within 3 weeks or more is usually a reasonable range. Remember to identify the high point of a rebound that lasted for 3 weeks or more, otherwise, the accuracy of the analysis will be reduced.
In addition, when using the Six Color Dragon Indicator and dynamic chip analysis, it is necessary to combine other technical analysis tools and market conditions for comprehensive judgment in order to improve the accuracy and reliability of the analysis.

KWEICHOW: to BUYbreakout of strong resistance with strength, and with a strong green candle.
high probability that KWEICHOW is going up

603683 forming cup and handleForming cup and handle over 12 months highs, with handle in the upper 50% range, entry over 10ma bounce, with stop under 10ma bounce lows

002292 cup-n-handleForming a cup and handle over the 1 year high levels that were recently broken. Handle well in the upper 50% range.

601801 high volume cup-n-handleForming cup and handle on very high volume, currently a handle with dried up volume (no sellers left), ideally bounce over the 10ma and moves 20-30% higher. Entry on bounce break, stop on handle lows. Handle forming perfectly in the upper 50% of the cup.
