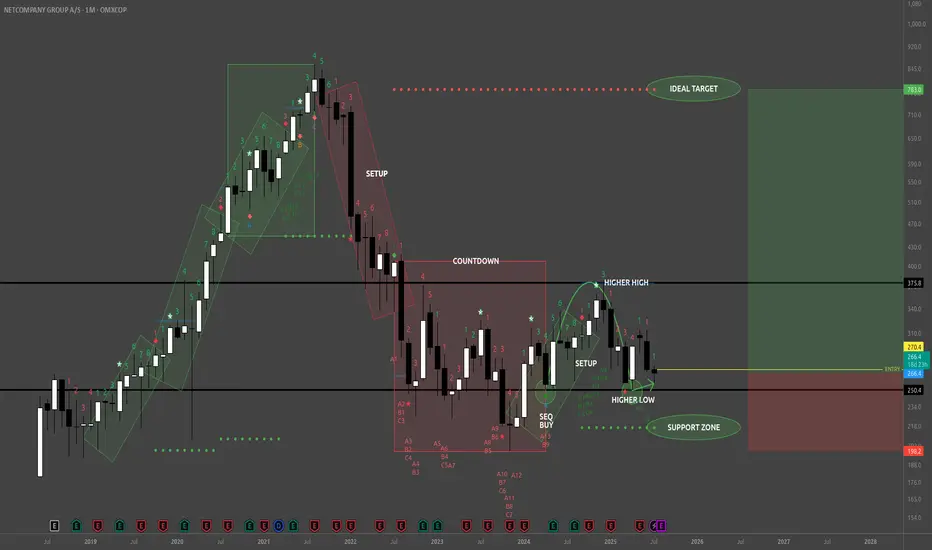
NETC - BuyReading the NETC Monthly chart from the left to right look at that remarkably strong bullish trend (green rotated rectangles) which spanned 3 consecutive TD 1-9 Setups. That's 9 strong months of uptrend culminating in the beginning of the bearish trend with a TD Sequential 13 Sell signal at the apex, a Bearish Engulfing Pattern, and a large Doji immediately preceding the TD 1-9 Setup (red rotated rectangle) which exhausted the downward momentum, and dissipated the downward momentum with the TD Sequential 13 Buy signal (first green circle).
From the TD 13 Buy signal (first green circle) buyers created a higher high, followed by 4 consecutive red TD counts, whose bearish implications were disrupted by the strong Bull Sash pattern. I really like this spot for opening a long position. One caveat is that the Weekly TD Buy Setup is on 7/9 so the next two weeks could bring the price lower, potentially even tapping the TDST support zone, but whether that happens or not look left on the chart everywhere from my entry price and below. This is all wholesale pricing territory!
TDST up at 783 is a nice upside target just shy of the ATH traders will be gunning for.
Now on fundamentals here's where things are really nice. NETC just bought themselves the Danish IT banking company SDC (for 1 Billion DKK) which serves about 100 Nordic banks. That's going to be bringing in sticky, recurring revenues in a critical financial sector. NETC revenues are also not materially tied to the U.S., and doesn't rely on American consumer sentiment, regulatory policy, or supply chains.
Whether price falls from here or not I'm holding on to my shares until this pays off big. Maybe this is a trade for your trading temperament too.
DSV – Potential reversal after break down from uptrend
DSV was in a rising trend but formed a small head-and-shoulders formation (HS), which led to a negative breakout. In the following three months, the price development can be interpreted either as a rectangular consolidation (REC) or a short-term downtrend. The price then dropped sharply to a pointed V-shaped bottom on April 9, followed by a strong rebound. Volume increases and falls in a V-shape – the development resembles a final rally, although such a rally typically follows a longer calm uptrend or downtrend.
The price has now established itself higher, with rounded tops and pointed bottoms. Volume balance has been negative since the HS formation, with increased volume at the bottom. Price momentum indicators are, however, positive.
The price is above a green cloud in the Ichimoku.
The stock is considered technically slightly positive for the next one to six months.
From a fundamental perspective, analysts are generally very positive about DSV. The company is regarded as highly competitive compared to industry peers. DSV is one of the largest global logistics operators, but rising import duties are expected to limit the volume of goods to be transported.
The company is highly scalable, as it owns few of the trucks, ships, and planes it uses itself.
Recently, there have been critical articles in the Danish newspaper Børsen, highlighting a tough management culture at DSV.
Disclaimer: I hold a position in DSV.
Note: Always do your own research and evaluation before buying or selling stocks.

NOVO expected to reach ATH during 2026Based on EW count and general knowledge about the company, it is expected that Novo will get back to the top (approx x2 from here) during 2026. Lets see

Novo Nordisk: Massive buying opportunityNovo has been struggling big time, december and march hit especially hard.
American institutions have held large positions in Novo, and this was felt when they had to sell off due to risk management with the looming tariffs.
However, the sheer devaluation & importance of their export, is going to create a massive wave following a risk-on environment, which i firmly believe is coming.
One of the few large EU based firms worth investing heavy in.

Genmab 4h longZone + 1st measured move PB.
Could potentially go all the way up to the expanding triangle top?

Novo 1h longShould get up and at least break the neckline from the bigger SHS/IHS.
Stop below zone or lower trendline.

Novo Nordisk Stock Chart Fibonacci Analysis 050925Trading Idea
1) Find a FIBO slingshot
2) Check FIBO 61.80% level
3) Entry Point > 411/61.80%
Chart time frame: D
A) 15 min(1W-3M)
B) 1 hr(3M-6M)
C) 4 hr(6M-1year)
D) 1 day(1-3years)
Stock progress: A
A) Keep rising over 61.80% resistance
B) 61.80% resistance
C) 61.80% support
D) Hit the bottom
E) Hit the top
Stocks rise as they rise from support and fall from resistance. Our goal is to find a low support point and enter. It can be referred to as buying at the pullback point. The pullback point can be found with a Fibonacci extension of 61.80%. This is a step to find entry level. 1) Find a triangle (Fibonacci Speed Fan Line) that connects the high (resistance) and low (support) points of the stock in progress, where it is continuously expressed as a Slingshot, 2) and create a Fibonacci extension level for the first rising wave from the start point of slingshot pattern.
When the current price goes over 61.80% level , that can be a good entry point, especially if the SMA 100 and 200 curves are gathered together at 61.80%, it is a very good entry point.
As a great help, tradingview provides these Fibonacci speed fan lines and extension levels with ease. So if you use the Fibonacci fan line, the extension level, and the SMA 100/200 curve well, you can find an entry point for the stock market. At least you have to enter at this low point to avoid trading failure, and if you are skilled at entering this low point, with fibonacci6180 technique, your reading skill to chart will be greatly improved.
If you want to do day trading, please set the time frame to 5 minutes or 15 minutes, and you will see many of the low point of rising stocks.
If want to prefer long term range trading, you can set the time frame to 1 hr or 1 day.

Novo Nordisk's The recent drop in Novo Nordisk's stock price is attributed to several factors. A key issue is the company’s struggle to meet the surging demand for its weight-loss drugs, such as Wegovy. Although demand remains strong, investors are concerned about Novo Nordisk's ability to scale up production and deliveries, which is creating downward pressure on the stock.
Additionally, some recent financial results failed to meet Wall Street expectations. Despite revenue growth in key product categories, overall revenues in some reports came in below forecasts. This underperformance has contributed to a negative investor sentiment.
However, analysts emphasize that Novo Nordisk's core products remain in high demand, and the company has significant long-term growth potential if it addresses its supply chain and production challenges

NVO absolutely sweet levelThis downturn is attributed to disappointing clinical trial results for some of its drugs and concerns over potential tariffs affecting Denmark. Additionally, competition from Eli Lilly's successful weight-loss drug trials has impacted investor confidence.
Despite these challenges, analysts note that Novo Nordisk maintains strong fundamentals and a positive long-term outlook, particularly in its core areas of diabetes and obesity treatments.

Looking kind of LongAfter a really red day for Maersk it reached the main lower trendline and right away bounced back up.
I will first see if the price respects the lower main trend and the be looking for a good Long position for the coming days until it reaches the upper trendline on the lower timeline.
So far so good.. share you thoughts!

Maersk keeps following trend-line, potential short position.Right after the latest Ex-day for dividends it breached the lower trend-line, but worked its way back to it. Yesterday it hit the roof of the upper trend-line and MACD switched to bearish.
I will be looking for a short position and expecting a low price around 11200 DK.
Share your thoughts, maybe I am missing something big?

Short-term idea for upcoming days after Ex-day of DevidendsI will be looking for the passing of the short-term trendline for a short-position tomorrow on Ex-day. My MACD-signal has flipped and yesterday ended right before a potential breakout or Head and Shoulders.
Downward trend were confirmed March 14th and has been respected three times already. If continued we could expect price down to 11500 DKK.
This is my first printed "idea" on TradingView and in general, take this with a pinch of salt.
Please share your thoughts and counter-ideas if any!

A.P. Møller – Mærsk A/S Bullish Sentiment OMXCOP:MAERSK_A is approaching a major supply zone around 12,800–13,200 DKK, which has previously acted as strong resistance.
The stock has been forming higher lows, respecting a long-term ascending trendline, indicating overall bullish structure unless that trendline is broken. In the short term, a W-pattern is forming, indicating bullish momentum towards the supply zone. However, there is a risk of forming a Head and Shoulders pattern, which would be bearish if confirmed. It is also important to note that after the dividend payment, a price drop is expected, possibly due to the adjustment of share price post-dividend distribution.
The company continues to beat earnings and increased their dividend payout. Recent news suggests a strong partnership with DP World to expand maritime services in Brazil, which could enhance long-term revenue stability.
Bullish Scenario: A break and close above 13,200 DKK with strong volume would confirm further upside potential.
Bearish Scenario: If resistance holds and a Head & Shoulders pattern forms, expect a drop toward 10,950 DKK or lower after dividend payments.

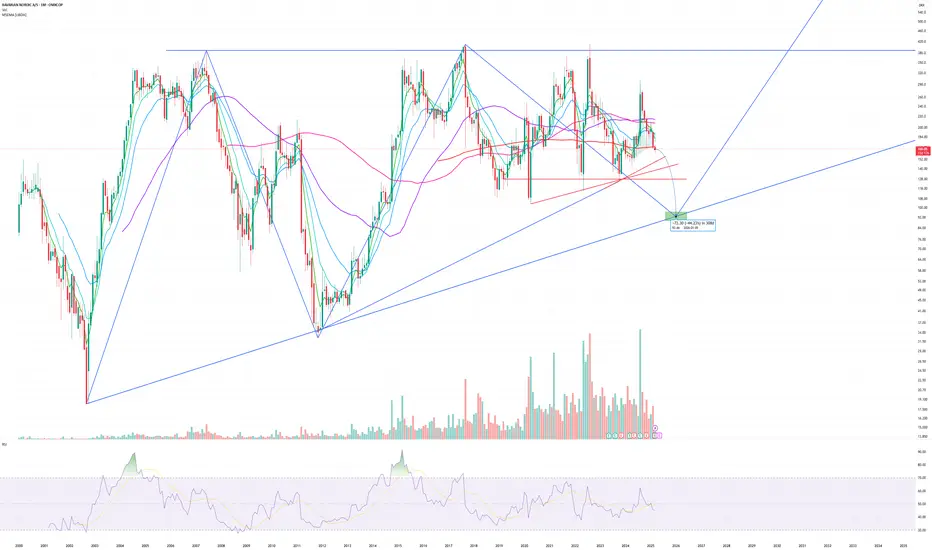
BAVARIAN NORDIC BAVA LARGE ASCENDING TRIANGLE FORMATIONHello Traders,
Here is my chart idea for Bavarian Nordic. This idea is solely based on me looking at the chart formation and no research has been done into the companies financials, potential upcoming vaccines or anything like that.
The price has been going sideways inside a large ascending triangle for about 22 years now and price movement still looks to be corrective waves not impulsive waves. It looks like the price wants to come down to the bottom trendline and bounce from there. This would also print a low, oversold value on the monthly RSI.
On the weekly chart it looks like the price has just broke down from a head and shoulders.
Lets see what happens.

DFDS bearish target hit -> bottom?As shown on an older chart, this was the target for the down trend.. Symmetry + ab=cd reached at channel low and a zone. 54% to the first upside target! Let's go.
SL might be too optimistic, but I'm willing to try a few times.
Would be f'ing epic :D
/edit.. There's a minor first target at gap close at 130


Solar.eu searching for the bottomAnalyzing RSI divergence, EW Solar.eu seems to be nearing the bottom. Healthy economy. The stock is expected to bottom at around 250 this summer. Then it should be good buy

Novo is going to 480. Wait for it!OMXCOP:NOVO_B Is declining to 480. I think that will be a good price to buy. It has a lot of bad news ahead. But this bad news is not that bad. So see you at 480!

Last chance for DNORD at this lvl - 4hI have nothing below, so if this doesn't hold I'd suggest it'll continue to at least 175 DKK. I don't trade harmonic patterns any more and haven't got a clue on their win rate these days, but it is a nice bat pattern too ;)
Haven't got too much trust in this lvl, but I thought I'd share it since there's a decent drop to the next area of interest.

Vestas turning bullish Given strong divergence on RSI, correlation on wave extensions, high volume below and EW count the target for the earnings date 5. feb is about 90.
From there Vestas is expected to turn bullish.
Beware that current P/E is about 250
There is some correlation to the Ørsted count

Ørsted expected to be bullish from hereIt seems that Ørsted has completed the correction and now will start a bullish move during from here. There is missing volume at 500 and it is expected that this area will be reached during 2025. Earnings coming up soon.

MAERSK - End of roadIn the short term, very high selling pressure.
In the long term, it looks like there is a plenty of space upward.
