
Learning TAHi,
Follow along while I'm trying to learn TA - first time using TA indicators.
This is only for learning purposes and therefore does not hold any relevancy to anything.
x
LS

Learning how to do TAHi,
Follow me along while I'm trying to learn TA.
This is for my own learning purposes, as I'm trying to learn TA.
x
LS

Genmab $GMAB all time high after Q3 earnings beat #biotechNovember 4, 2020; Copenhagen, Denmark;
Interim Report for the First Nine Months Ended September 30, 2020
Highlights
Novartis granted U.S. FDA approval for Kesimpta® (ofatumumab) in relapsing multiple sclerosis
Janssen and European Myeloma Network achieved positive topline results from Phase 3 APOLLO study of daratumumab in relapsed or refractory multiple myeloma
Janssen was granted U.S. FDA approval for DARZALEX® (daratumumab) in combination with carfilzomib and dexamethasone in relapsed or refractory multiple myeloma based on Phase 3 CANDOR study
DARZALEX net sales increased 35% compared to the first nine months of 2019 to USD 2,937 million, resulting in royalty income of DKK 2,898 million for the first nine months of 2020
Genmab (GNMSF) commenced binding arbitration of two matters under daratumumab license agreement with Janssen
Announcement of plan to transition Arzerra® (ofatumumab) to an oncology access program for chronic lymphocytic leukemia patients in the U.S.
“Genmab continued to deliver on the promise of improving the lives of patients, with multiple regulatory milestones for Genmab-created products under development by our partners, including the exciting U.S. FDA’s approval of Kesimpta and the 8th U.S. FDA approval for DARZALEX,” said Jan van de Winkel, Ph.D., Chief Executive Officer of Genmab. “During the first nine months of 2020, with our solid financial footing Genmab has continued its focused investment in advancing its proprietary antibody product pipeline and building its capabilities as we evolve into a fully integrated biotech.”
Financial Performance First Nine Months of 2020
Revenue was DKK 8,067 million in the first nine months of 2020 compared to DKK 2,405 million in the first nine months of 2019. The increase of DKK 5,662 million, or 235%, was primarily driven by the upfront payment from AbbVie pursuant to our new collaboration announced in June and higher DARZALEX royalties.
Net sales of DARZALEX by Janssen Biotech Inc. (Janssen) were USD 2,937 million in the first nine months of 2020 compared to USD 2,168 million in the first nine months of 2019, an increase of USD 769 million, or 35%.
Operating expenses were DKK 2,641 million in the first nine months of 2020 compared to DKK 1,943 million in the first nine months of 2019. The increase of DKK 698 million, or 36%, was driven by the advancement of epcoritamab (DuoBody®-CD3xCD20) and DuoBody-PD-L1x4-1BB, additional investments in our product pipeline, and the increase in new employees to support the expansion of our product pipeline.
Operating income was DKK 5,426 million in the first nine months of 2020 compared to DKK 462 million in the first nine months of 2019. The increase of DKK 4,964 million was driven by higher revenue, which was partly offset by increased operating expenses.
Outlook
Genmab is maintaining its 2020 financial guidance published on August 20, 2020.

Perfect time to go longThis is a low risk area, and the earning is going to come out in 2-3 days. Good time to go long.


Update Analyse on SimcorpAs you can see we got the breakthrough at the green supportline. Now we can be sure that the stock is starting a new trend.

Simcorp Analyse Hello this is my analyse of Simcorp. As you can see i have both maked a long- and short opportunity. Before we can see a new trend coming we need to see it brake through the green support line.
We could maybe see a shoulder head shoulder formation coming.

NetCompany - LONG IdeaI would like to see the stock to bounce a little bit up before buying to confirm its gonna stop at the line.

GN Store Nord - LONG IdeaThis is my analyse of GN Store Nord. If you have something that you would like to tell then write a massage to me :)


Vestas Long term bullish - But need to retrace down to 1035-1065RSI overbought - need to retracement
CMF +0,50 showing the buyingpresure, but turning down
MACD Bullish
Long term uptrend based on MA200.
I think this is long term bullish, but first we need a retracement down to 1035-1065.

Ørsted - Retracement to 970 - then BullishStrong overbought on RSI
Moving averages looking good
Strong MACD
The stock have to make a minor breathe down to 970 area. Long term strong stock.

North Media - Might consolidate between 65-75 until Christmas. Moving averages looking strong
RSI can't get away from 50
MACD long term bearish turning to bullish.
I think we will see a consolidation between 65 - 75 next 2-3 months, then it start to move again.

Novozymes - bullish longRSI looking strong
MACD bearish, but might turn soon
Moving averages positive.

FLS - Currently Bearish. Might consolidate around 180-200 RSI close to 30.
MACD bearish
Moving averages bad
Might fall a bit, and later consolidate around 180-200 for next 3-6 months.

Consolidation between 90-100 RSI building up
MACD turned Bullish
Moving averages getting better, but far from good.
Small increase, but might consolidate between 90-100 until 2021.

D/S Norden - Bullish moveRSI close to 70, but looking strong
MACD Positive
Positive moving averages
Last resistance at 105 (closed 105,20 thursday).
Strong support near 86-92.

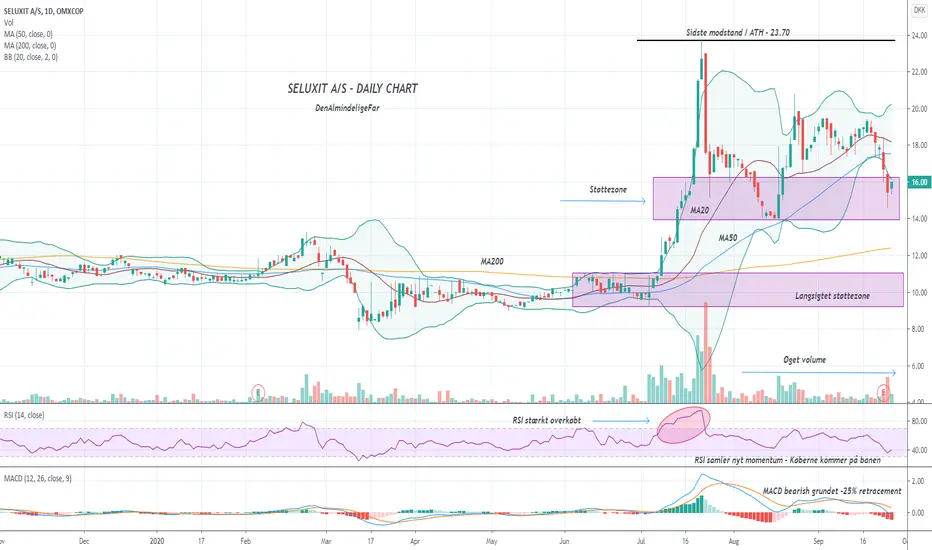
Seluxit waiting for reversal around 16RSI moving up.
MOving averages looking fine.
MACD bearish due to -25% retracement
Building up for another run
AMBU - Bullish long termAmbu har fået sin længe ventet reversal og bevæger sig i den rigtige retning. Jeg tror vi skal op omkring kurs 200 stille og roligt.
