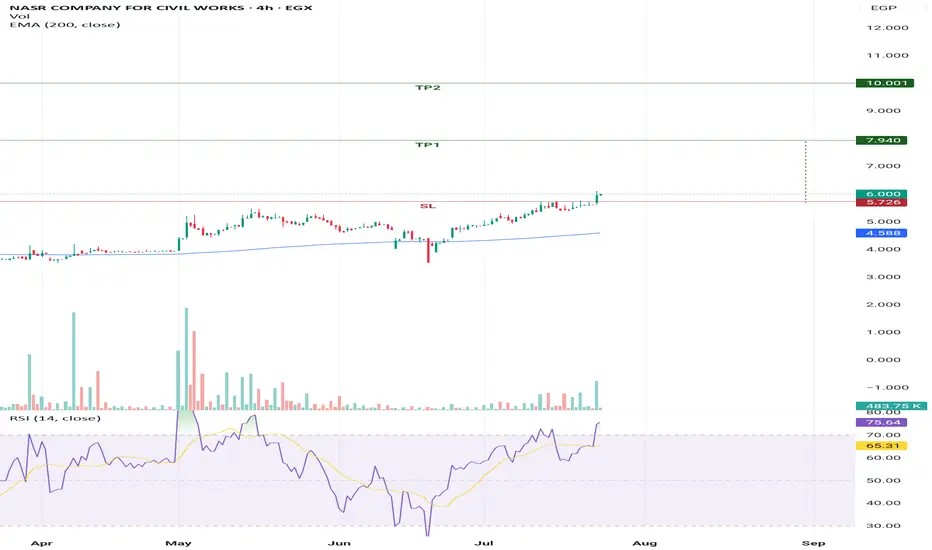
Cup and handle patternNCCW successfully breakthrough significant resistance level which also considered the resistance level of "cup and handle pattern" targeting the below targets:
- Potential buy range: 5.7 - 5.9
- TP1: 7.9
- TP2: 10
- SL: below 5.6 " require confirmation"
It is considered medium to long term target.
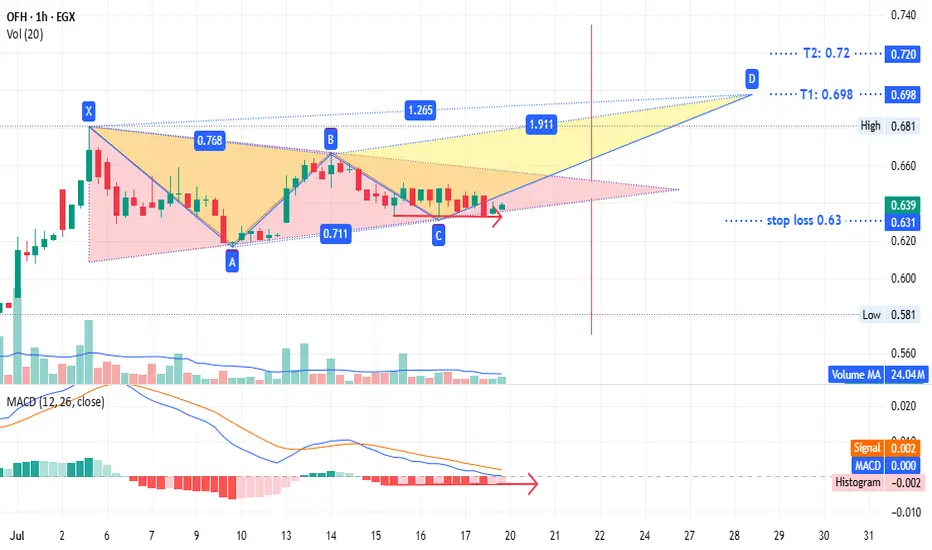
#OFH - it have a great future GETTEX:OFH timeframe is 1 hour,
showing a potential triangle pattern with targets at
0.72 if prices close above the upper line or
0.57 if they close below the lower line.
Alternatively, a bearish pattern could target 0.698 to 0.72.
The stop loss is set at 0.63 to 0.624 (the gap from July 13) based on your strategy.
A long position here offers low risk (2% loss vs. ~10% profit potential).
This is not investment advice—only my chart analysis. Consult your account manager before investing. Good luck.
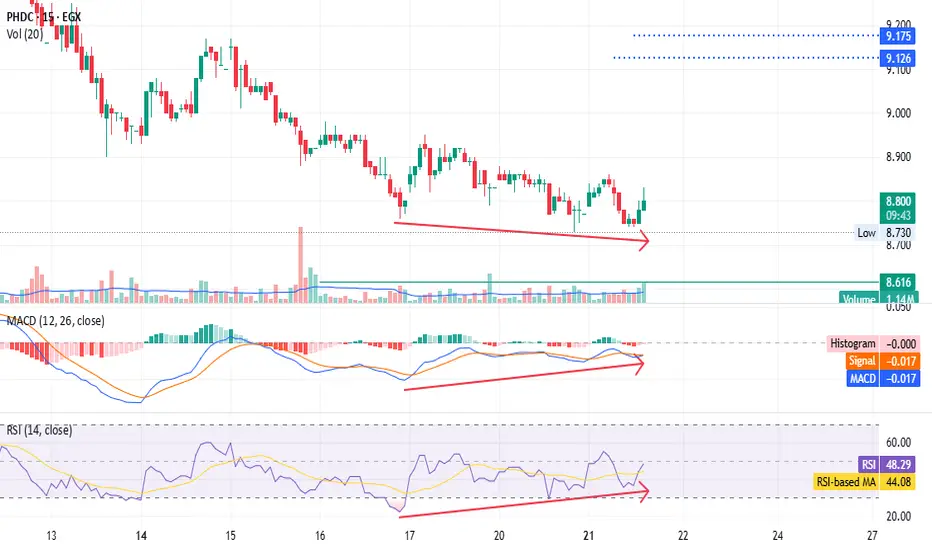
PHDC - don't give them away for free - only for shareholders EGX:PHDC - 15m timeframe
Hold your shares; don't give them away for free.
MACD and RSI show positive divergences.
Set a stop loss at 8.74.
Targets: 9.14 and 9.50.
*Not investment advice—just my chart analysis. Consult your account manager before investing. Good luck.*
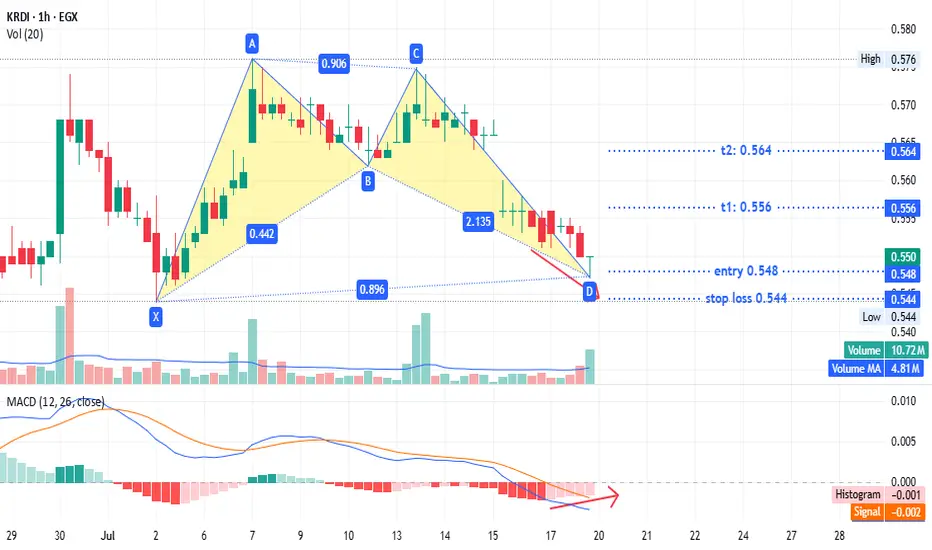
KRDI - just for fun but secured TASE:KRDI timeframe 1 hour
created bullish pattern
entry 0.548
stop loss : 0.544
T1: 0.556
T2: 0.564
MACD show positive diversion may that support our idea
Its not an advice for investing only my vision according to the data on chart
Please consult your account manager before investing
Thanks and good luck
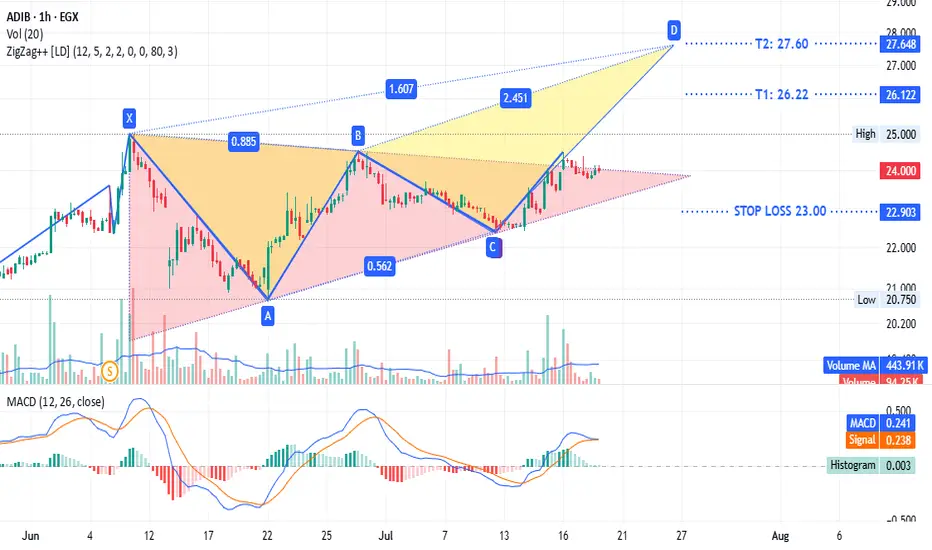
ADIB - same $comi patternADX:ADIB timeframe 1 hour
Is showing a triangle pattern with a potential bearish trend. It is currently testing the upper line of the triangle. The stop loss is at 23.00, and the target sell point ranges from 26.22 to 27.60.
This is not investment advice, only my analysis based on the chart data. Consult your account manager before making any investment decisions. Good luck.
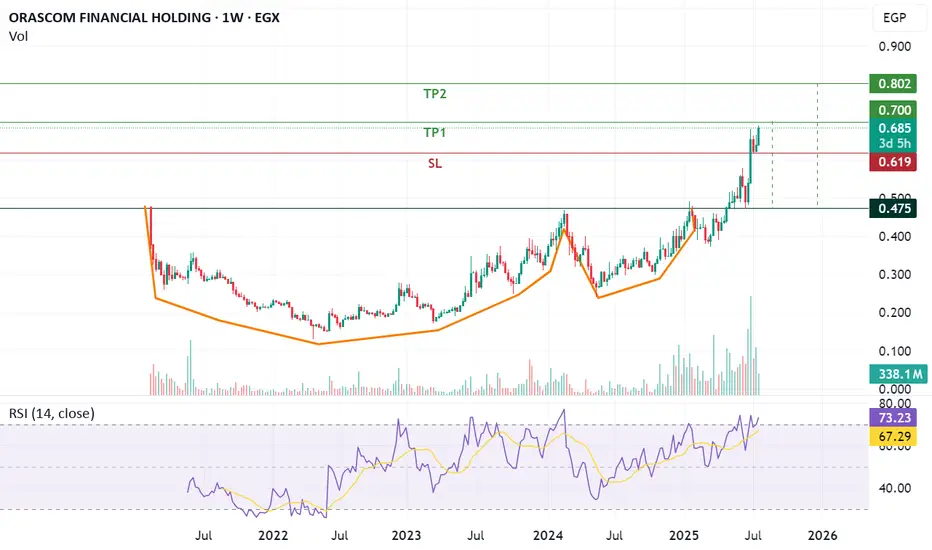
Cup and Handle pattern OFH has breakthrough a significant resistance line which represents the neck of the pattern "Cup & Handle" leading the stock to achieve the below targets on the medium to long term.
- Potential buy range: 0.64 - 0.66
- TP1: 0.7
- TP2: 0.8
- SL: below 0.62
copran impulse wave is in its way to make new highs ,, i think 0.87 will be easy to be shocked very soon ,,,, 61% level is a strong support now

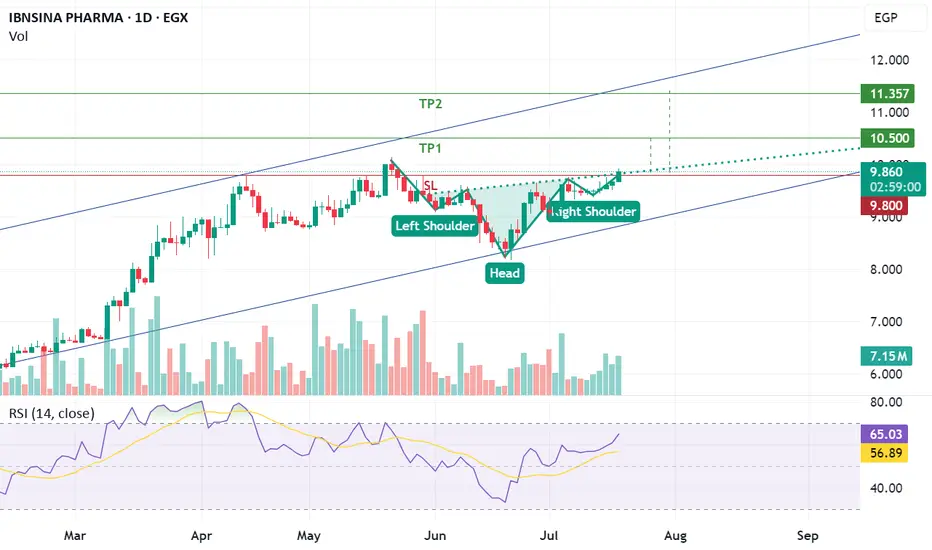
Inverted head and sholder patternISPH just breakthrough a significant resistance line which is considered inverted head and shoulders resistance line, if the price closed higher than 9.8 this will result in achieving the below targets.
- Potential buy range: 9.75 - 9.83
- TP1: 10.5
- TP2: 11.3
- SL: below 9.7 "require confirmation"
ELEC Trade Plan Entry Trigger:
✅ Break and strong close above 3.00
✅ with volume surge
⸻
Risk Management
🔸 Stop-Loss:
2.79
⸻
Profit Targets
🎯 Target 1: 3.15-3.20
🎯 Target 2: 3.40 – 3.50

#EMFD - Egyptian stock#EMFD time frame 1 DAY
Created Gartley Bullish pattern ,
Entry level around 6.45
Stop loss 5.90 ( estimated loss - 8% )
First target at 7.35 ( estimated profit 13% )
Second target 7.85 ( estimated profit 22% )
Third target 8.25 ( with profit 27% )
MACD and RSI show positive diversion that is may support our idea
NOTE : this data according to time frame I DAY , it`s may take period up to 3 months to achieve targets , you must study well the Alternative opportunities before invest in this stock .
In addition EGX30 is negative.
Its not an advice for investing only my vision according to the data on chart
Please consult your account manager before investing
Thanks and good luck

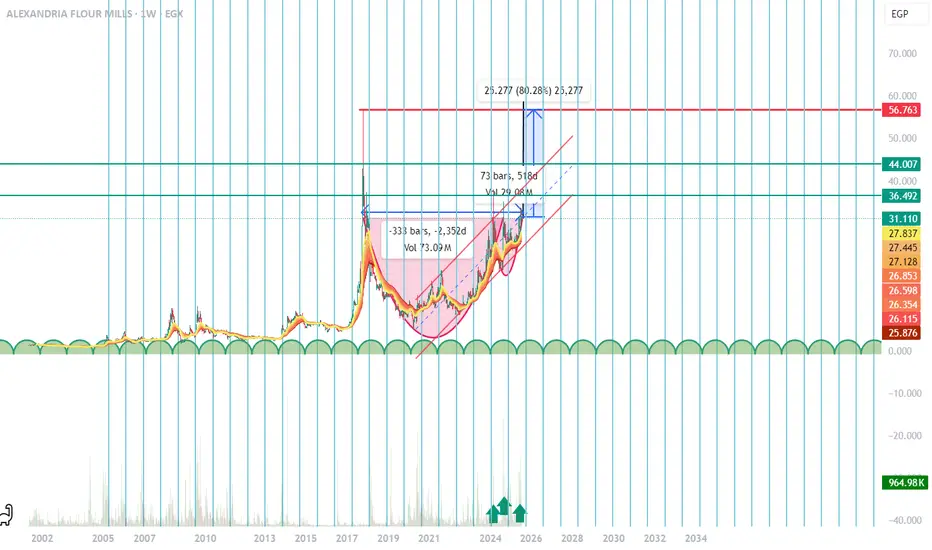
Cup And Handle with big potential Hello Traders,
i believe that is stock in the next year will make huge profits as a medium investor and long one for us as Dailly to week trade we can take advantage from this coming two month as a huge move will happen as it align with the money cycles and the pattern any down move is new opportunity to dca again targets as mentioned its just my opinion not more good luck.entry is from 28 to 33 and take profit one is 36 and the 2nd is 44 and last is 56 with stop loss 25
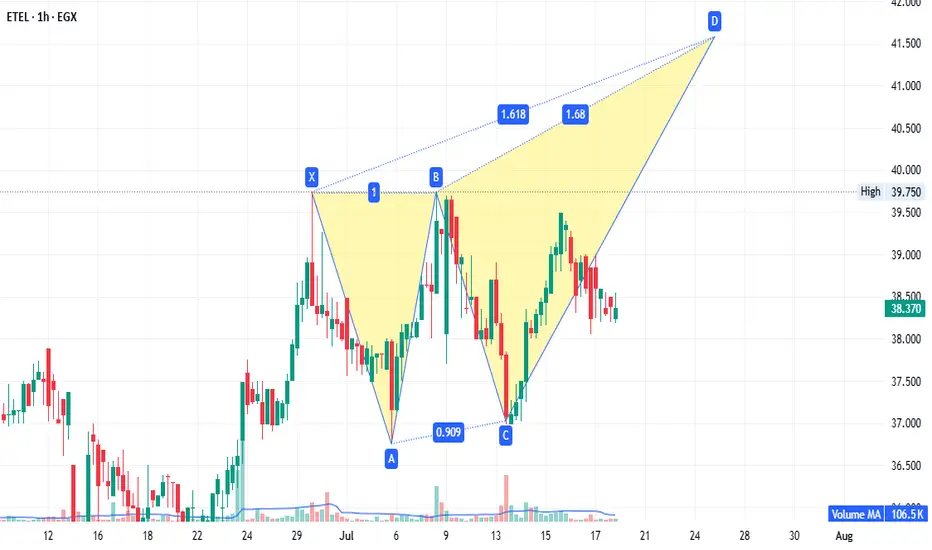
ETEL - strong fundamentals.EGX:ETEL 1-hour timeframe:
A potential bearish Gartley pattern targets 41.50. If prices reach 41.55 (without breaking 37.00), it becomes a sell point with targets at 39.73 and 38.60. Conversely, if prices continue rising and close above 42.70, rebuy what was sold at 41.50, targeting 52.00. This setup is both strategic and supported by strong fundamentals.
Disclaimer: This is not financial advice, only our analysis based on chart data. Consult your account manager before investing.
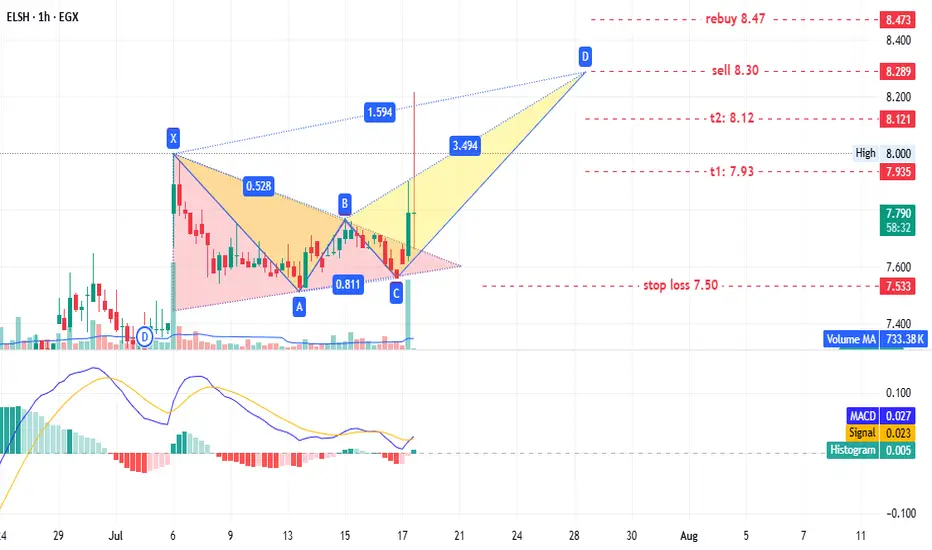
ELSH - old player EGX:ELSH timeframe: 1 hour.
A triangle pattern was identified, targeting 8.20. No new entry is recommended for shareholders, but if prices retest the triangle pattern at 7.65–7.60, it could present a low-risk entry opportunity.
This may also form a potential bearish Gartley pattern with targets:
- T1: 7.93
- T2: 8.12
- T3: 8.30 (sell point)
Stop loss: 7.50.
If prices continue rising and close above 8.47, consider rebuying what was sold at 8.30.
Disclaimer: This is not financial advice, only our analysis based on chart data. Consult your account manager before investing.
Good luck!
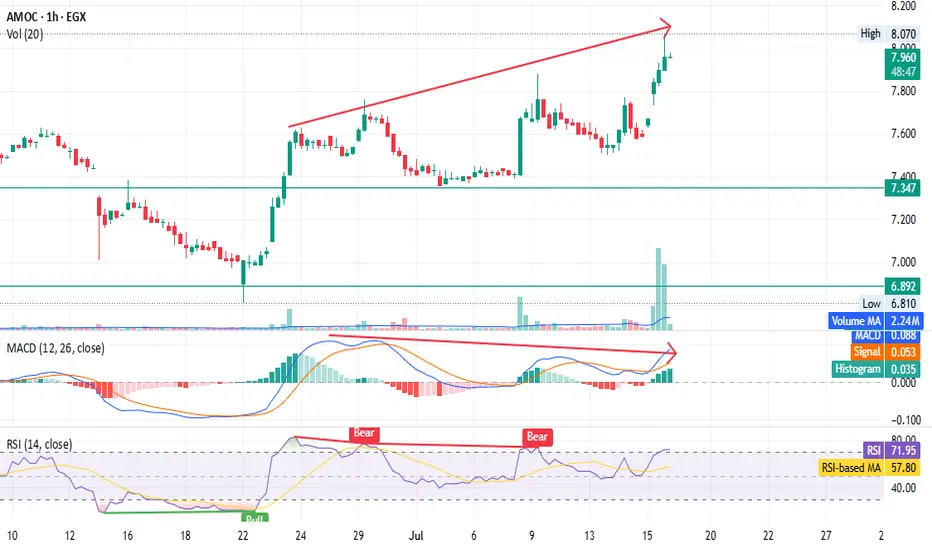
AMOC - Beware of the bear trap - only for shareholders EGX:AMOC timeframe: 1 hour
Prices continue to rise, forming a higher top than the previous one,
but MACD shows a negative divergence.
RSI indicates bearish dominance despite the price increase.
High volume with a gap, unsupported by other indicators, suggests possible distribution.
Stop loss (profit-saving) at 7.62.
This is not financial advice, just our analysis based on chart data. Consult your account manager before investing.
Thanks and good luck!
Breakthrough significant downtrend resistance line - EMA200 AMOC has successfully penetrated significant downtrend resistance line and EMA200 supported by volume exceeding average 30 days vol, targeting the bellow level:
- Potential buy range: 7.8 - 7.9
- TP1: 8.7
- TP2: 9.8
- SL: below 7.5

Breakthrough inverted head and shoulders and downtrend lineABUK has successfully breakthrough inverted head and shoulders pattern and downtrend resistance line supported with volume exceeding average 30 days allowing the stock to achieve the below targets:
- Potential buy range: 51 - 51.5
- TP1: 56
- TP2: 61.5
- SL: below 50.70 "Require confirmation"

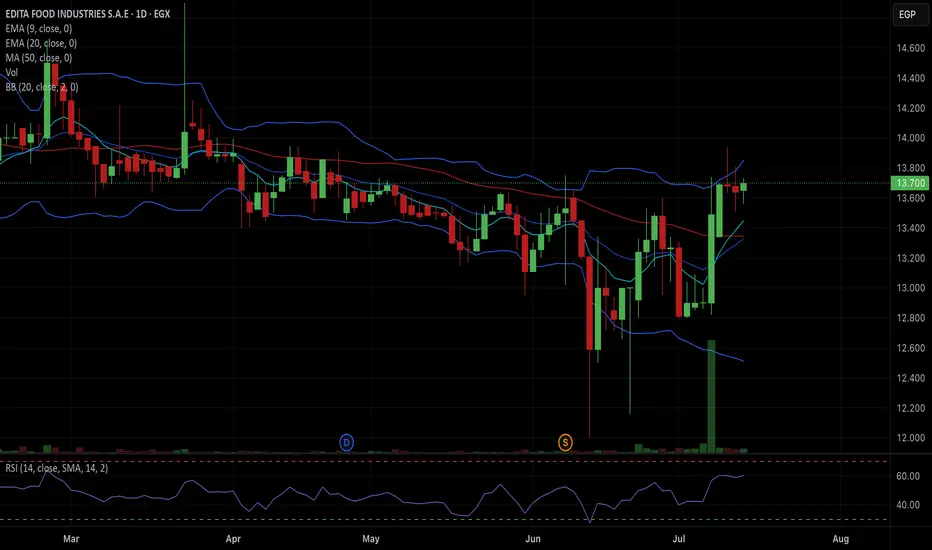
EFID Trade plan🔹 Entry: Above 13.85 (confirmed breakout of upper BB and resistance zone)
🔹 Stop-Loss: 13.33
🔹 Profit Target:
• TP1: 14.20 (next resistance zone – upper wick from mid-March)
• TP2: 14.60 (monthly resistance)
Breakthrough sideways price channelTAQA has been moving in sideways price channel ranged from 11.60 to 12.90 in the past 7 month, and successfully breakthrough the significant upper resistance line of the sideways channel supported with trading volume higher than the past 10 month potentially targeting the below:
- TP1: 14.3
- TP2: 15.4
- TP3: 16.5
- SL: Below 12.9 "Confirmation required"

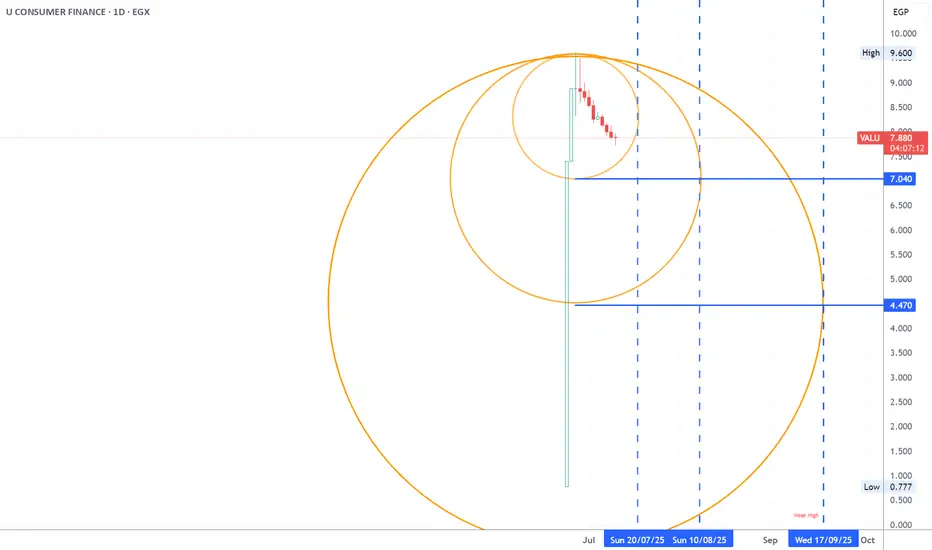
valu suport level and time lines this is a possible support level and time line of the new stock VALU using W.D Gann method
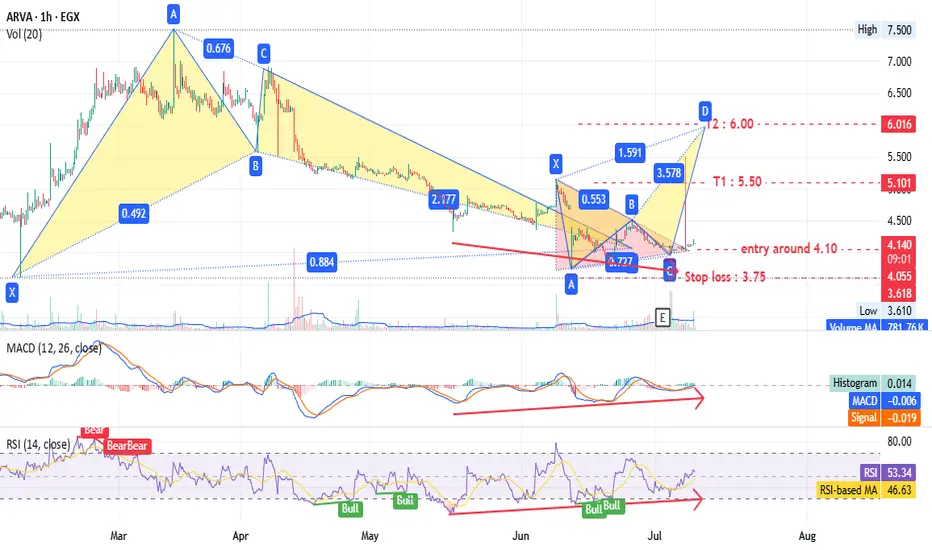
ARVA - many patterns give one target - Amazing EGX:ARVA timeframe 1 hour
Entry around 4.10
Stop loss at 3.75 (10% loss).
Targets at 5.50 and 6.00 (up to 44% profit).
Hourly chart shows a triangle pattern and bearish Gartley pattern.
Daily timeframe also indicates a bullish pattern with the same targets.
MACD and RSI support this analysis.
Note: This is not investment advice—only my analysis based on chart data. Consult your account manager before investing. Good luck!
Upside wedge + breakthrough short term downtrend resistance linCCAP has been moving in an upside wedge since May 2024 and faced a downtrend resistance line which it succeeded to breakthrough today with a volume exceeding the past 12 month.
- Potential buy range: 2.97:3.05
- TP1: 3.2
- TP2: 3.5
- SL: 2.97 "confirmation required"
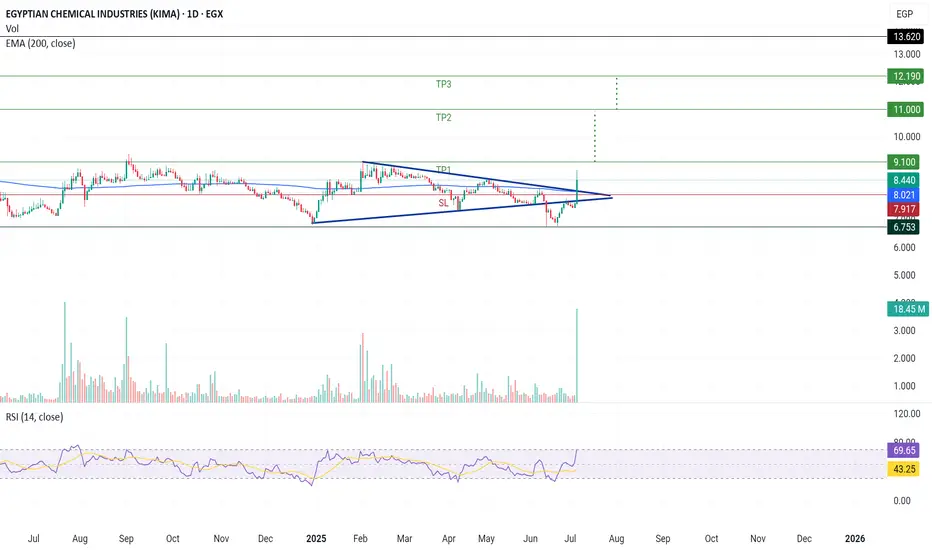
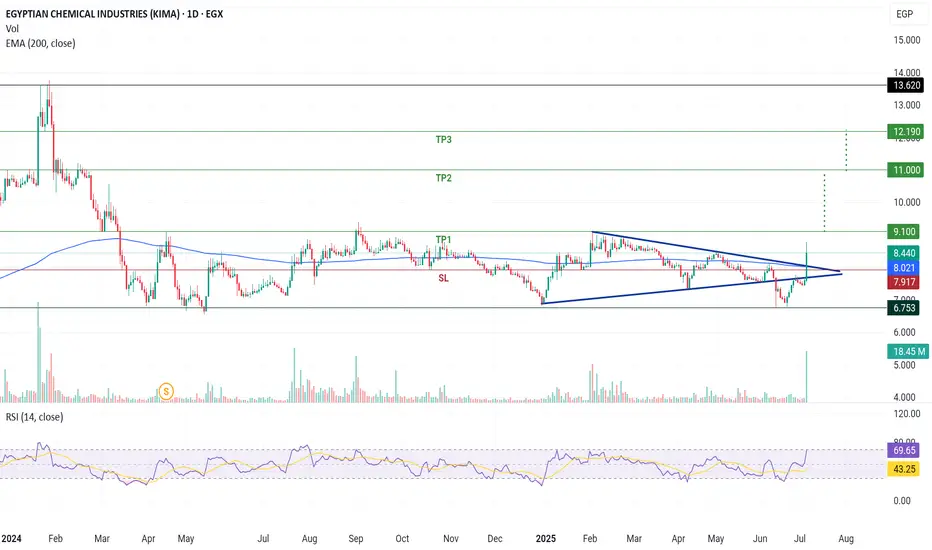
Simitric triangle pattern breakthrough + vol.The stock has been moving sideways since March 2024, and today succeeded to breakthrough a simitric triangle pattern with volume exceeding the past 6 month.
- Potential buy range: 8:8.4
- TP1: 9.1
- TP2: 11
- TP3: 12.2
- SL: Below 7.9
Simitric triangle pattern breakthrough + volThe stock has been moving in sideways since March 2024, and formed a simitric triangle pattern which succeeded to breakthrough today with volume exceeding past 6 month.
- Potential buy range: 8 : 8.30
- TP1: 9.1
- TP2: 11
- TP3: 12.2
- SL: 7.9