77K bought @14:25 will change the market structureBuyers' confidence that MPCO reached its bottom price @74.6 -74.9, will lead to the upswing

Targeting 156EGP .. still uptrendingone complete Marubozo above 128.4 EGP is the driver to short term target of 135 EGP, and the the ultimate outbreak to the Golden target of 156 EGP

one complete Marubozo on daily timeframe will make my dayone complete Marubozo on daily timeframe will make my day @24.5 EGP will lead to a breakout toward the all-time high

ASCM is expected to target 78.9 after beating ResistanceDaily chart, trading in a triangle, the stock is expected to target 78.9 after crossing the Resistance..
After closing for 2 days above 57, the target will be 91.5
Stop loss below 48 should be considered.

Will ETRS cross the Resistance and see the 6 level?30-min chart, the stock is trading in a tough zone; there are 2 strong Resistance levels 4.84 and 5.19
So, be careful with this stock; as it flips quickly!
Closing and trading 3 candlesticks above 5.21 will activate the target of 6.04, then 6.20
Stop loss below 4.68 - should be considered.

EPCO Jinny GANNJinny Gann Fan Levels are on the Chart possible Trendlines my WAY.
Jinny Gann Fan/Horizontal Lines Works as Support / Resistance.
Current Support: 5.06 - 4.81
Resistance:5.38 , 5.97
Important levels for the Big Cycle on the chart.
Long Term Target 8.66
Trade Wisely.
Wish You Best of LUCK.

ICID is trading in a rising channel1-hour chart, the stock is trading inside a rising channel.
Breakout (crossing upwards), the target will be crossing price + 0.38
Breakdown (crossing downwards), the target will be crossing price - 0.38
Be careful with this stock - it flips up and down quickly!

ISMQ is near a critical zone!1-hour chart, the stock is near the support line S, and should rebound to the Resistance line R (around 5.0)
Below support line, it can fall down to 4.13 then 3.75, 3.5 and 3.35
Be careful!
Stop loss below 4.48

ETRS : Raising the target to 5.7Weekly chart, the stock formed a chart pattern and the target is 5.7
On the smaller time-frame, there are ups and downs, so you can trade daily and be careful with the profit protection / stop loss levels.

Waiting a new entry after crossing Resistance line R..Daily chart, I am expecting some zigzag trading inside this triangle pattern between R and S lines.
Positively, the price is still inside the last green candlestick.
After crossing R, the target will be 6.25 then 7.35
Below S, stop loss

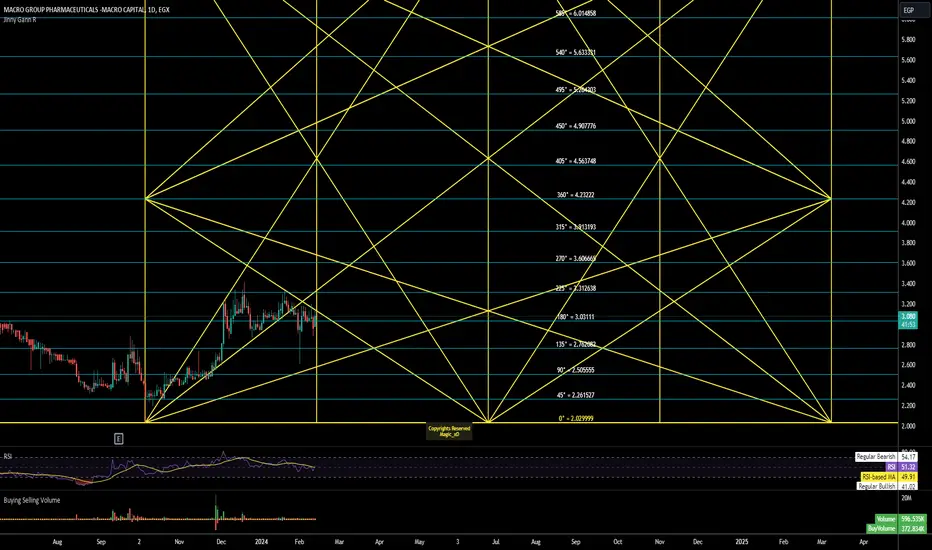
Mcro Important levelsJinny Gann Star Levels are on the Chart possible Trendlines my WAY.
Jinny Gann Star /Horizontal Lines Works as Support / Resistance.
Important levels for the Big 2 Cycles on the chart.
Trade Wisely.
Wish You Best of LUCK.

Mcro Updated.Updated previous Chart Had Lil Calculation Mistake..
Jinny Gann Star Levels are on the Chart possible Trendlines my WAY.
Jinny Gann Star /Horizontal Lines Works as Support / Resistance.
Important levels for the Big 2 Cycles on the chart.
Trade Wisely.
Wish You Best of LUCK.
CIEB Jinny Gann Fan LevelsJinny Gann Fan Levels are on the Chart possible Trendlines my WAY.
Jinny Gann Fan/Horizontal Lines Works as Support / Resistance.
Important levels for the Big 2 Cycles on the chart.
Trade Wisely.
Wish You Best of LUCK.


another unexpected hick-up5M timeframe
below KUMO
Chikou span downward facing
Rebound breaking point 119.6-120.17EGP

ALL TIME Records achievedstill up-trending
Price channel 6.36-7.5 , Equilibrium 6.9EGP
Red Hammer 6.78
Liq sweep 6.35
FVG 6.64

COMI ending correction & starting consolidation MTF, COMI ending correction & starting consolidation
Price Channel 84.5 - 79.5 ; Equilibrium 81.9EGP
Take position @ lower end of price channel

Mystery shopper @14:10 changed the ending50% of the trading volume was @14:10 .. This is THE happy ending & game changer.
detailed MTF analysis.
I am already investing in ADIB, and is my first choice.
I am biased toward ADIB, and have great confidence in his management & BoD.

Liquidity isn't presentTrading above the the bullish order block
Poor daily volume
Resistance + 75.20, 75.75, and 76EGP
RULE of THUMB: comi breakout leads to FERTILIZERS eclipse

ABUK ending correction .. heading to accomplish pending businessMTF indicating ending the correction
Market structure Bull
FVGs filled
still some business are non-completed @90.5 EGP
once crossing this price band, heading toward 105EGP


EMAR MISR Yesterday Hick-up is a buy opportunity11-2-2024 started positive, the 2nd H the market relaxed.
this lead to intraday consolidation & correction.
Opportunity is confirmed.
Intraday Targets: 6.09, 6.19, 6.25, 6.28.
Support zones: 4.84, 5.92, 5.98.

CIB ending correction CIB ending correction with one green Bar on a daily timeframe.
Target setting on 1 hour timeframe
Market entry on 5 minutes timeframe
Suggested Buy position @ 79 EGP
Stop Loss @ 78 EGP
Take profit @ 84.5EGP
Disclaimer:
The information and publications are not meant to be, and do not constitute, financial, investment, trading, or other types of advice or recommendations. it is just for education purpose.
