MFPC UP TO 1000 !Buy MFPC TO TARGET 1 = 540
After rising and stabilizing above the 540 EGY, the price targets the 1000 EGY
NOTE This is not should not be construed as an offer to sell or the solicitation of an offer to purchase or subscribe for any investment.

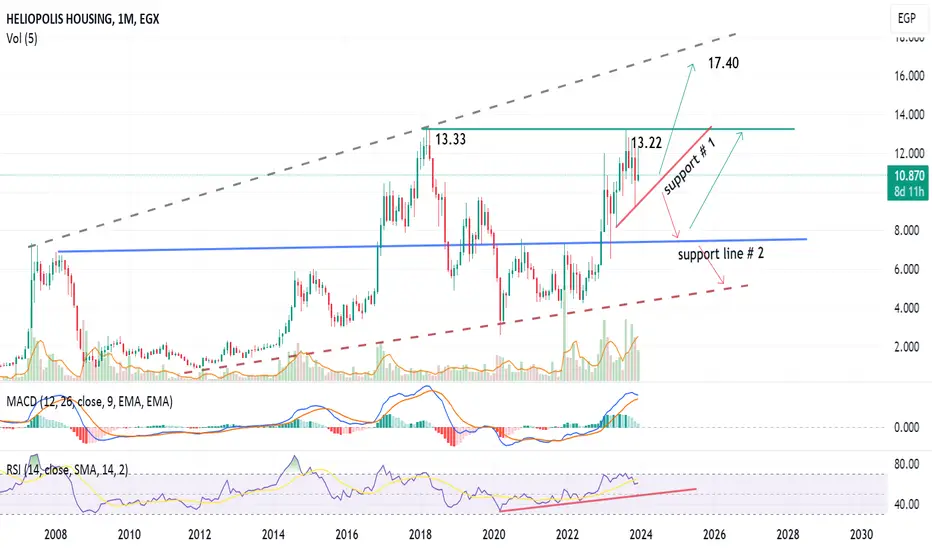
Which scenario will Heliopolis Housing (HELI) choose?Monthly chart, Heliopolis Housing (HELI) stock seems to have 2 scenarios.
Either to cross 13.22 - 13.33 up and target 17.4 - 17.5
Or to break support # 1 down to support # 2
The indicators RSI is still positive, MACD is signalling a tendency for correction.
Note: this is long term trading map..
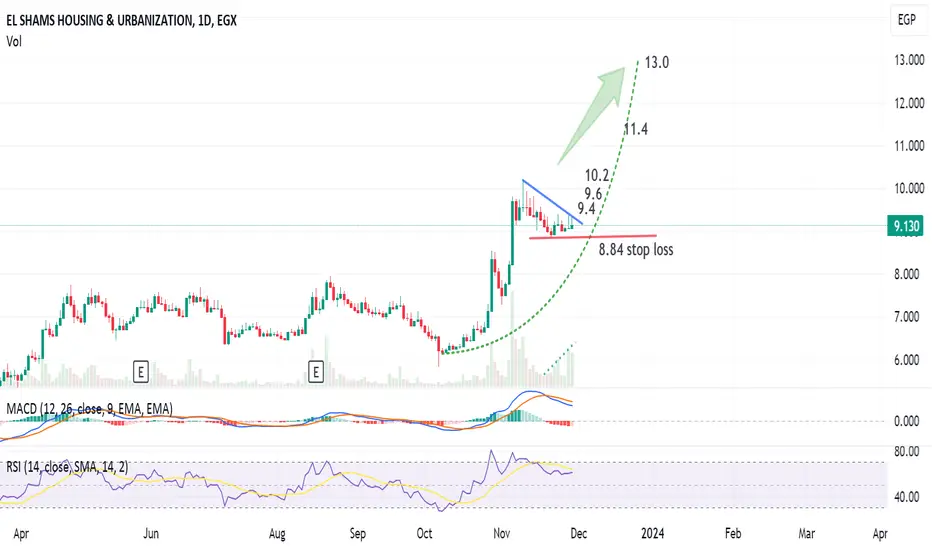
ELSH to target 13 after crossing 9.4Daily chart, the stock has almost completed the pattern (pennant), and the target will be 13
Some resistance at 9.4 , 9.6 , 10.2 , 11.4
Stop loss at 8.84
GET READY FOR ASCOMHuge profit announcement today published by ASCOM, +2.2 Billion revenue increase in just 3 quarters, i think also because of the latest gold Mine sell this huge pop in share prise went up.
Share went up again Above the 51 pounds, expected Targets
T1: 75
T2: 102
If the above are broken and price still breaking new ATH
T3: 202
Lets see:)
Good Luck

COSG to rebound to 0.280, then 0.30530-min chart, COSG should rebound to the resistance line at 0.280, as the last hammer candlestick tells.
Crossing the resistance, the target will be 0.305, extending to 0.325
The dotted RED line should be considered for stop loss (below 0.255) for this time frame.

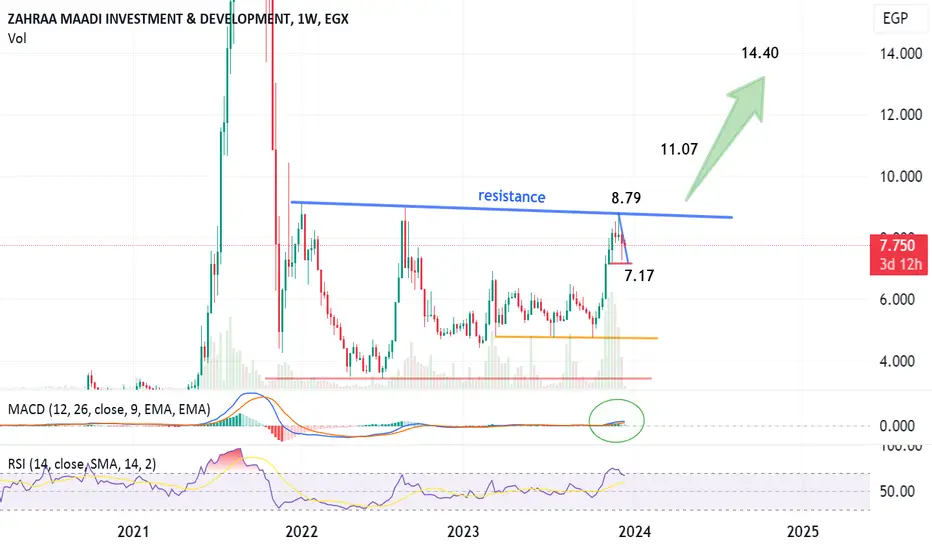
Zahraa ZMID - Trying to beat a 2-year resistance!Weekly chart, Zahraa ZMID is showing good potential for high targets.
Above the 2-year resistance level (at 8.80), the target will be 11.07 then 14.40
MACD is positive. RSI is almost over-bought --> The stock may need some flat trading before crossing up / or some very minor corrections to cool down the indicator.
Can Arab Polvara cross the long-term resistance?Monthly chart, Arab Polvara tested resistance line 1, and could not cross, rebounded to line 2.
The technical indicator MACD is positive, but RSI is in over-bought zone. So, a correction may happen.
Note: Recent trading volume is low.
I see the stock is currently trading in a critical price level, and needs to be above 7.10 to go next level to target 13.8 (long term)

ISMQ to rebound from 1.52 - Target 1.581-hour chart, ISMQ should re-test the support line (red) at 1.52, then rebound to 1.58
After crossing up the resistance line (blue), the target will be 1.66
Stop loss at 1.52

MOED is targeting 0.442Monthly chart, MOED has formed a double bottom pattern, the target is 0.442, extending to 0.510
MACD indicator crossed the zero line upwards: positive signal
Stop loss below 295

OBOUR LAND is targeting 11.6, then 13.4 after crossing30-min chart, OLFI is seen as rebounding from the support line (red) to target the resistance line (blue) at 11.6
Above 11.6, the target will be 13.4
Stop loss at 10.5

ICID crossed the resistance and will target 5.56 1-hour chart, ICID stock has formed a chart pattern and crossed the resistance, the target is 5.56
RSI is positive in the BUY levels, MACD still needs to cross the zero line.
Stop loss 4.10
Note this stock is volatile - Be careful

SVCE to rebound to 1.87, then 2.10 after crossing GREY line30-min chart,
SVCE should rebound to 1.87, and after crossing the dashed GREY line at 1.89, the target will be 2.10 - as a chart pattern will be formed.
RSI is in the BUY area

MICH to target 54.7 after crossing BLUE resistance lineDaily chart,
After crossing the resistance line (BLUE), at 41 - 40.7 , the chart triangle pattern will be formed, and MICH will target 54.7
Stop loss should be considered below the support (RED) line.

Egal 1 Full Cycle DoneHello Dear Traders,
Egal Finished its 1st Big Cycle from 2020 Bottom.
You have The important levels on the chart Each level Will work as Either support or Resistance
Also you Have Jinny Gann Fans.
Gann Square of 9
Script Used "Jinny Gann" invite only script
Best Regards

ZMID, EGX, to target 5.6 and 6.2ZMID , Egypt
On 30-min chart, a high potential to hit 5.6, then target 6.2 in the short term.
RSI is showing a buy area.
Stop loss at 5.15 - 5.10 should be considered.

ETRS formed a triangle pattern - to target 5Weekly chart, Egy Trans (ETRS) has crossed the resistance line (blue) and made a triangle chart pattern, the target is 5.0 passing through resistance 3.4 (GREY dashed line) and 3.7
Stop loss 3.0

Say hi to the new rocketAs we can see, there’s two confirmation first we are in the third wave of Elliot second thing that it Shows inverted head and shoulders tomorrow. If we crossed the final stage of the right shoulder, it will be the rocket lounge so stay tuned.

ORHD targets 15.7 (weekly chart)Weekly chart, ORHD is pushing towards the resistance line. Trading above 12.8 drives the price to 15.7
Stop loss 12.1
Technical indicators RSI and MACE are supporting this view.

MCRO - As you see on the chart we are in a downtrend with a beautiful green candle with a big body . This candle tells us that we would have a very high probability of having a reversal of the trend (bullish trend). But for this to be possible, all the analysis conditions must be met. The vwap indicator as well as the resistance line must be broken forcefully by a large green candle and followed by a large green volume. As soon as this is done, we can enter a buy position as soon as the second green candle appears with green volume for added assurance.Thanks!

EEII to cross the resistance at 1.50, target 1.6030-min chart, EEII is trying to cross the resistance line (blue). After crossing around 1.50, the target will be 1.60 passing through the shown resistance levels.
Stop loss below 1.47

ICID to target 11.7 after crossing resistance ICID is preparing to cross the resistance line (blue) at 7.10 - 7.05, the target will be 8 then 9 then 11.7
I think the the stock will test down 6.75 - 6.70 before rebound and crossing up.
Stop loss should be considered.

SWDY is pushing against resistance to target 30.330-min chart, the stock reached an area of multiple resistance lines.
Above 27.9 will target 30.3, then up to 32
Watch the stop loss.
The stock needs a strong push to cross the GREY line - above which a far target will be seen.

SWDYtrading is hard and it’s not something you can expect to get good at overnight. So if you’re serious about becoming a master of making money on the markets, you’re going to need some top-level schooling
