GBCO (AUTO), To target 5.95 soonGBCO (AUTO formerly), EGX, on 30-min chart
has a support at 5.30
crossing 5.5 will lead to target 5.95, with sub-targets 5.7, 5.80.
Crossing 5.95 will target 7

ATLC to target 4.40 after crossing 4.11ATLC, on the 30-min chart, there are positive indicators RSI and MACD for reaching 4.08
Crossing the resistance level of 4.11 will push the stock to target 4.40
The stop loss level should be considered.

csag is in supply end/ descending wedge reversal23.5 then 14.00
those are zones where it will rebound

ElwaHello Dear Friends,
Elwa Bottomed and is heading for a long term run.
On chart Fib Channel
each line will work as Resistance or Support
Example for todays candle:
resistance which is probably gonna break .437
above it .474
etc...
Good Luck to you all.

HRHO, to target 16.8 in 2 weeksHRHO, is going to high over-sold area, and the technical indicators are telling the stock is targeting 16.6 then 16.8 soon.
This is a 30-min chart technical analysis.
Stop-loss at 15.60 should be considered for this time frame reference.
On the bigger time frame, I have a forecast for 20% up in 2 months.

BTFH, to target 3.24 soonBTFH, on the 15-min chart has positive technical indicators to cross 3.18, then 3.24
The stock is targeting 3.68 on daily timeframe.
Note this stock is volatile and your profit protection and stop loss levels should be considered.

sweedy is correcting >>sweedy is sold on supply zone and now correcting the big up move so it has two key levels
rebound zone 13.75-9.15
demand zone 8.00-5.60

moltaqa is rebounded from the strong d.zone targets 3.28-4.50A newly formed uptrend is growing started from the strong demand zone, targets 3.28 then 4.50

Beltone is expected in a strong uptrend till 5.60 & 8.00BEltone financial is to reverse and hit first resistance at 5.60 , the test of 5.60 may be strong and a breakout may occur and a next resistance is 8.00 .

EEII.EGX moving in a ascending triangle.The stock is still in a neutral range on the ascending triangle pattern between the two major support or demand areas and between a nearby secondary supply area, and the price movement is waiting for the penetration of any of the two ends of the pattern so that we can talk about the expected targets

MEPA.EGX undergoes a big corrective journey The stock chart shows that during the 13 months from April 2022 until May 2023, a large movement during which it completed the five Elliott motive waves, and since this date it began to form corrective waves until the golden ratios of Fibonacci, and therefore it is now heading to the shown lower demand area, which is between 0.41 and perhaps a little below , the current trend is a bearish correction to the demand areas or the strongest support areas .

ADPC.EGX short term targetsThis stock chart adpc is showing a newly formed uptrend with a unique and observable retracement till the demand zone shown on the chart and new rebound is formed from that demand zone on the short term trading chances ,
the first target at 1.74 and second target at 1.90 approximately,
nice trading

EGCH, long uptrend to 11.3 , 15.5EGCH, Egypt
One the weekly chart, a technical pattern flag was formed, and the target is 11.3
Once we cross up this level, the stock should target 15.5
This is a medium term view in few months.
Profit protection should be considered.

ORWE, EGX, to target 16.4 in few hoursOn the 30-minute chart, ORWE is showing a short term rebound..
Above 16.24 to target 16.4 soon.
Breakingout 16.4 level, the stock will target 17.2, 17.5 in few days.

HRHO, EGX, To target 21.4 , 25.2 in few weeksHRHO, Egypt
On the daily chart, the technical indicators RSI and MACD are showing positive up direction.
Once the stock crosses up 20.4, easy target will come 20.7 and 21.4
Above this resistance zone, we will have 25.2 in few weeks.
Note 1: Stop loss at 19 should be considered - short term, and at 14 after 25% discount
Note 2: The coming free stocks distribution will affect the prices. But, this stock will most probably discount and then rebound quickly.

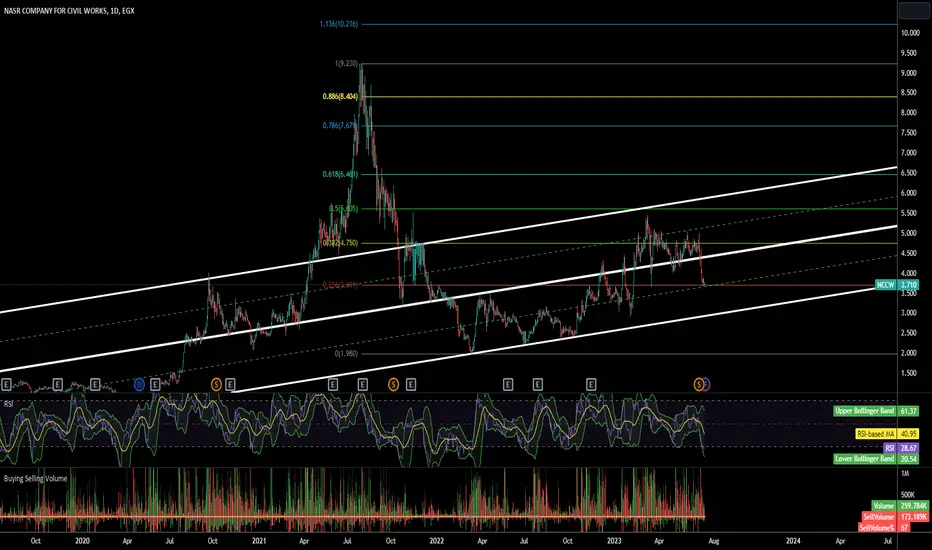
NCCWOn Chart Fib Retracments
Channels
Every Pivot on Channel will work as support or Resistance based on where the price is located
When u have a Fib Level + Channel Mid/Lower/Higer Band thats a strong Area to Consider Buying/Selling.
Atm Its good Entry with a tight Stoploss 3.66
Kinda Bullish For Long Term.
Investor stop Would be Close Lower than 2.91


ABUK - LONGABU KIR is expected to move side ways for couple of weeks before reaching potential 53 within few weeks. Good range for buying even though EGX30 is going down

