#menamena is good opportunity make model of reverse head ^shoulder supported by symmetric triangle and it above up trend
target 1.60 pass with resistances that is indecated in chart

#ameramer good trade
entry point 0.88 EGP
stop loss closing under 0.8 EGP
targets brown line 1.02 / 1.10 /1.17


COMI EGX30 Huorly chartThe Commercial International Bank, on the hourly curve, confirmed that there had been a reversal between the price movement and momentum, and retested the confirmation level at 43 Egyptian pounds, and the price is likely to reach the level of the demand area at 37.80-37.00


GAS EGYPTIt is expected to drop to the specified areas between the 14th to the 18th as a final corrective decline, and then to launch motive waves to make another historical peak.

CIB-EGYPTThe trend for CIB Egypt weekly - The trend for CIB Egypt weekly - The trend for CIB Egypt weekly


MepaLooking at the Important Trendlines.
Possible resistance and support Levels on The Chart.
Near Term, Breaking and Stabilizing above .327 is good to go to next levels.
Near Support : .288
long term Investment.
Previous bottom Considered Support waiting for a Double bottom if retouched would be great buy and stop Under .18 for

Amoc Long TermSchiff Pitchfork
The Schiff Pitchfork is a drawing tool used in technical analysis that is derived from the standard pitchfork. There are three basic components of a standard pitchfork. There is a center median line (trend line) as well as two more sets of lines above and below that median line. The additional lines are set a specified number of standard deviations away from the median. Where the Schiff Pitchfork differs is that its origin's location is modified from a standard pitchfork. The Schiff Pitchfork's origin is located at 1/2 the vertical distance and 1/2 the horizontal distance between the high and low points (first two points set).
A Schiff pitchfork (just like a standard pitchfork) is created by first drawing a trend line between two extreme points. A third point is then set either above or below the second point depending on the analyst's desired Schiff Pitchfork location. Keep in mind that the default Schiff Pitchfork setting calls for two additional sets of lines to be drawn. Tradingview allows for up to 9 sets of lines to be added. If additional lines are added, the user can save this setup as a template for later use.
The basic idea behind the use of a Schiff Pitchfork and a standard pitchfork is that it essentially creates a type of trend channel. A trend is considered active as long as price stays within the Schiff Pitchfork channel. Reversals occur when price breaks out of a Schiff Pitchfork channel.

AREH Still In DowntrendHello, according to my graphical analysis Of the EGYPTIAN REAL ESTATE GROUP
, there is a high probability of a drop in the coming weeks.

AspiWe can see the Wolfe wave has been completed and the price is above the strongest level in pivot so we are targeting 0.265 with stop loss 0.237

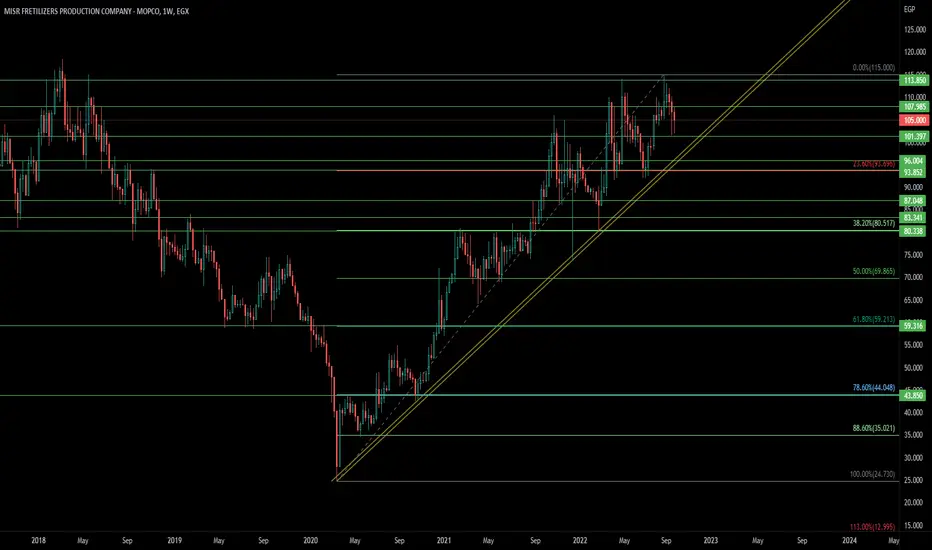
MFPC WeeklyPlease be aware of breaking below the Yellow UP Trendline That will be Bearish.
Levels for possible support and resistance depending where price is located to the level on the chart.
Near Resistance 108
Near support 102
Breaking below 83 Consider it officially Bear Trend.

#prmhgood opportunity for long term target up to 1.80 EGP
and short term target up to 0.75 EGP
stop loss 0.44 EGP

ATLAS- Channel - part 2 As shared last week, I guess. The stock is moving down and will continue to reach the area around 0.26 depending on whether the whole market continues falling the next week based on today's market session or will bounce back up if the market stops rectification.

ARVA Rounding bottom and channel chartAs we can see down below the stock is moving between the prices of a channel and is continuing with the rounding bottom chart formation. Almost hit the high of the channel might test it again and might go to the down line to bounce back to a higher high accordingly. to be followed

Reversed head and shoulders confirmedAs we can seen now and speculated yesterday that the pattern will continue to be formed on the chart. We can now see a clear reversed head and shoulders with the target. pattern is 100% confirmed once it breaks the shoulder lines upwards. an order to buy will be put around 0.198 and 0.20. Best of luck

Reversed head and shouldersAs we can see, we can speculate that the char will continue to form the other shoulder so a reversed head and shoulder is drawn and can set a goal for it around 0.23-0.24
Anyway chart is not completed yet however a trade can be done till the other shoulder is drawn on the chart and if it continues, you will have bought the stock in a lower price than u would have got it if you bought after waiting for the other shoulder to appear

ETRSCorrection levels.
and possible Channel.
Fib levels
Support & Resistance Lines Depends on Where the price is to the line.


ATLAS - up trend channel ATLAS can be seen moving in an uptrend channel, best time to buy when touching the down line for the channel, sell by moving down from this channel, keep when moving up till hit (near) the upward channel.
