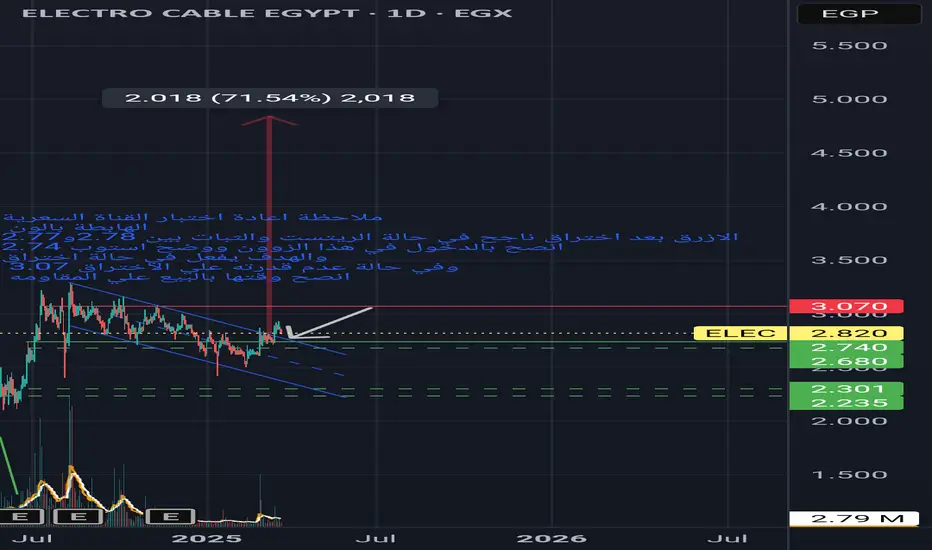
#AFMC#AFMC
entry point 13.15
fist target red zone 16.25/16.50 profit *25.75%*
second target 17.70 profit *35.35%*
stop loss closing under 11.90 loss *9%*

EDBMtrend up
falling wedge on 1H frame
bulish Gartely on Daliy frame entry point 0.288 EGP stop loss 0.26 EGP
target 0.338 EGP then 0.385 EGP then .57 EGP

#ccapstrong chart its up from strong demand yellow zone it forms large bullish harmonic butterfly pattern
its target 1.74 EGP
ADD on it forms large inverted head and shoulders pattern its target 1.93 EGP

#OFHGood signals for buy
1/ green up trend test 3times
2/ small tringle breaked through then success in test it again
3/large inverted head and shoulders breaked through then it has tested
4/ large bulish butterflly pattern its target 0.26 EGP

#AIHgreat opportiunity pentration down trend plus penetration triangle entry point 0.372
target 0.69
stop loss 0.30

#PrmhPrmh good chance is penetrated down channel and in small scale is penetrated sym triangle it has short term target 0.93
long target 1.25 stop loss 0.55

#RREIRREI is Penetrated Symmetric Tringle and down channel Entry point 0.84 Targrt 1.24 Stop loss 0.61

#REACREAC
it will make new high above 8.60 EGP because it above up trend and is making bridge has target 6.5 EGP stop loss 3 EGP

#SVCEIt is Good Chance To Make Profit With Very Small Stop loss
Entry point 2.60 EGP
Stop loss 2.00 EGP
Target 5.55 to 5.63 EGP

EPPKit good chance with very low stop loss 6% to profit 45%
entry point 7.5EGP stop loss closing below 7EGP
target red zone between (10.71_10.85 EGP)

TANM (Tanmia for Real Estate Investment) – Cup & Handle Formatio📈 TANM (Tanmia for Real Estate Investment) – Cup & Handle Formation! 🚀**
🔎 **Technical Analysis (1D Chart):**
TANM appears to be forming a **Cup & Handle** pattern, which is a classic bullish continuation setup. This pattern suggests the potential for an upward breakout if the price successfully clears resistance.
- **Cup & Handle Formation:** The stock has completed the "cup" phase with a rounded bottom, and now it's forming a "handle," typically a consolidation before a breakout.
- **Moving Averages Support:** The price is fluctuating around key moving averages, which may provide dynamic support.
- **RSI Near Neutral Zone:** The RSI is around 49-54, indicating no extreme overbought or oversold conditions, leaving room for a move in either direction.
- **MACD Neutral:** The MACD is hovering near the zero line, and a bullish crossover could confirm momentum shift.
- **Volume Considerations:** A volume surge upon breakout would strengthen the bullish case.
🔑 **Key Levels to Watch:**
- **Resistance:** **3.93 EGP** (Cup & Handle breakout confirmation level)
- **Current Support:** **3.31 - 3.30 EGP** (Crucial zone to hold)
- **Major Support:** **2.50 EGP** (Break below would invalidate the pattern)
📊 **Market Sentiment & Potential Scenarios:**
- **Bullish Breakout:** If price closes above **3.93 EGP** with strong volume, the next target could be **4.50+ EGP** based on the cup depth projection.
- **Bearish Breakdown:** A failure to hold **3.30 EGP** could lead to a retest of **2.50 EGP**, invalidating the bullish setup.
- **Neutral Consolidation:** If volume remains low, the price may continue forming the handle before a breakout attempt.
⚠️ **Risk Management & Disclaimer:**
This is **NOT financial advice**. Always conduct your own research, set stop losses, and manage risk appropriately. Patterns indicate probabilities, not certainties.
🔥 **What’s Next?**
Traders should watch for a breakout with volume confirmation. If the cup & handle pattern plays out, the stock may see a strong bullish move in the coming weeks.
📢 **What do you think? Will TANM break out? Share your thoughts below!** 👇
#TANM #EGX #CupAndHandle #Trading #StockMarket #Investing

E-Finance for Digital and Financial Investments (EGX) - PotentiaHere’s a trading idea you can publish on TradingView based on the image:
---
**E-Finance for Digital and Financial Investments (EGX) - Potential Reversal Setup**
📉 **Technical Analysis:**
The stock has been in a strong downtrend, forming a falling wedge pattern, which is typically a bullish reversal signal. Currently, the price is testing a key support level, and a breakout above the trendline could indicate the beginning of an upward move.
📌 **Trade Plan:**
- **Entry:** Upon confirmation of a breakout and close above the trendline.
- **Stop Loss:** Below recent lows to minimize risk.
- **Target Levels (3 Stages):**
1️⃣ **First Target:** Near the next resistance level (previous support).
2️⃣ **Second Target:** Around the mid-range resistance zone.
3️⃣ **Final Target:** At the major resistance level from previous highs.
📊 **Indicators & Confirmation:**
- Price is near a strong demand zone.
- Potential bullish divergence in volume/momentum indicators.
- Watching for confirmation from moving averages.
🚀 **Final Thought:**
A successful breakout could provide a great risk-to-reward opportunity. Always manage risk and adjust targets accordingly!
#Trading #StockMarket #TechnicalAnalysis #EGX
---
You can tweak this based on your exact targets and trading style. not financial advice ! 🚀

RAYA Approaching Trendline with Bullish DivergenceRAYA is currently testing a key ascending trendline, showing signs of a potential reversal. The price action is forming bullish divergence on the RSI and other momentum indicators, suggesting a possible bounce toward previous resistance levels.
Key Observations:
✅ Price is nearing strong trendline support.
✅ Bullish divergence forming on RSI and other indicators.
✅ Volume is stabilizing, indicating potential accumulation.
✅ First target: 2.58 (major resistance), then 3.24+ if momentum continues.
✅ Stop-loss below 2.10 to manage risk.
A confirmed breakout above short-term resistance could trigger a stronger upside move. Waiting for confirmation before entering a position is crucial!
What are your thoughts? 🚀📈not financial advice

bullish with signs of accumulation and Tweezer Bottom Yes! The chart is showing **bullish potential** with signs of **accumulation in a sideways range**.
### **Bullish Scenario & Accumulation Zone**
- The price is trading within a **sideways range (accumulation phase)** between **0.339 EGP (support) and 0.411 EGP (resistance)**.
- **High volume near 0.384 EGP** indicates strong buying interest in this area.
- A breakout above **0.411 EGP** could trigger a **strong uptrend**, targeting **0.459 EGP and beyond**.
### **Tweezer Bottom Confirmation**
- The presence of **tweezer bottom candlestick patterns** at support levels strengthens the bullish bias.
- If price **rejects the lower boundary (0.384 EGP) multiple times**, it confirms accumulation and potential upside movement.
### **Key Trading Strategy**
- **Entry:** Buy within the **0.384 - 0.395 EGP** zone.
- **Stop-Loss:** Below **0.339 EGP** (if accumulation fails).
- **Take-Profit Targets:**
- **0.411 EGP** (resistance breakout level).
- **0.459 EGP** (strong supply area, high-volume node).
- **0.60+ EGP** (if bullish momentum continues).
### **Final Confirmation**
- Watch for **breakout volume above 0.411 EGP** to confirm the **bullish breakout** from accumulation.
- If price **rejects 0.411 EGP again**, it might stay in accumulation longer.
💡 **If the accumulation breakout happens, this trade has great upside potential.** Would you like me to mark these zones on the chart visually? 🚀

# **CONTACT Financial Holding | Bullish Reversal from Golden Fib# **CONTACT Financial Holding | Bullish Reversal from Golden Fibonacci Zone 🚀**
**Ticker**: EGX:CNFN
**Timeframe**: 1D
**Pattern**: Fibonacci Golden Ratio Reversal + Descending Trendline Breakout
### **📌 Key Analysis:**
- The price has approached the **Golden Fibonacci retracement level (0.618 - 0.705)**, a key area where buyers tend to step in.
- There is a strong **historical support zone** aligning with this golden pocket, increasing the probability of a rebound.
- The **descending trendline** is acting as resistance. A breakout above this level would confirm the bullish reversal.
- **RSI** is at a relatively low level, indicating that the stock may be oversold and primed for a reversal.
### **🎯 Targets:**
1. **4.18 EGP (0.618 Fib Retest)**
2. **4.45 EGP (0.5 Fib Level)**
3. **4.94 EGP (0.382 Fib Resistance)**
4. **6.43 EGP (Major Long-term Target from Previous Highs)**
### **🛑 Stop Loss:**
- A break below **3.25 EGP (0.79 Fib Level)** would invalidate the bullish setup.
### **🔥 Bullish Confirmation:**
- A breakout above **4.18 EGP** with strong volume.
- Positive momentum and RSI turning upwards.
If confirmed, this setup presents a **great risk-reward ratio** for a potential upside move. 🚀📈
What do you think? Let me know your thoughts in the comments! NOT FINANCIAL ADVICE⬇️

MASR: Riding the New Wave to 6 EGPMASR: Riding the Bullish Wave to 6 EGP 🚀**
MASR is forming a strong **ascending triangle pattern**, respecting its **bullish trendline** while consolidating within a key range. The price recently bounced off support and is now pushing higher, showing signs of accumulation.
### **Technical Analysis:**
🔹 The price is holding above the long-term **trendline support**, signaling strength.
🔹 The **triangle pattern** suggests a breakout could be approaching.
🔹 **MACD & RSI are bullish**, indicating growing momentum.
🔹 **Volume Profile** shows strong interest around 4.00 EGP, reinforcing support.
### **Key Levels to Watch:**
📌 **Resistance Levels:** 4.36 – 4.75 EGP → **Breakout Target: 6.00 EGP**
📌 **Support Levels:** 4.00 – 3.46 EGP → **Invalidation below trendline**
A confirmed breakout above **4.75 EGP** could pave the way for a rally toward **6.00 EGP**, following the broader bullish trend. However, patience is key, as price action should be monitored for confirmation.
🚨 **Not Financial Advice – Always Do Your Own Research!** 🚨
What are your thoughts on this setup? 📈🔥

ACT FINANCIAL (EGX) – Sideways Trade with Breakout PotentialHere’s a TradingView idea for your sideways trade setup with a potential breakout:
---
**ACT FINANCIAL (EGX) – Sideways Trade with Breakout Potential**
📉 **Technical Analysis:**
The stock is currently trading within a sideways range, showing strong support and resistance levels. The price is bouncing between these levels, offering a short-term trading opportunity. However, the presence of a bullish divergence in the MACD suggests a possible breakout.
📌 **Trade Plan:**
- **Entry:** Near the lower boundary of the range, aiming for a small upward move.
- **Stop Loss:** Below the recent support zone.
- **Target Levels:**
1️⃣ **First Target:** Minor resistance within the range.
2️⃣ **Second Target:** Upper boundary of the sideways channel.
3️⃣ **Breakout Target:** If a breakout occurs, aiming for a new resistance level above the range.
📊 **Indicators & Confirmation:**
- MACD showing bullish divergence, signaling potential upside.
- Watching for volume increase as a breakout confirmation.
- Risk/Reward ratio looks favorable within the range.
🚀 **Final Thought:**
A range-bound trade with small targets offers a controlled risk setup. However, if the stock gains momentum and breaks out, it could lead to a strong bullish move. Keep an eye on key levels!
#Trading #StockMarket #TechnicalAnalysis #EGX
---
not financial advice 🚀

Long,Pioneers Holding (EGX: ASPI) Pioneers Holding (EGX: ASPI) has several key financial indicators that you should consider before making any investment decisions. Here's a breakdown of the company's financial position and
performance:
fundamentals Analysis
1. Stock Performance & Valuation:
• Current Price: 0.278 EGP
• Book Value Per Share: 0.35 EGP (suggests the stock is trading below book value, which could indicate undervaluation)
• Based on Book Value Multiple → 0.60 EGP
• Based on P/E Ratio → 0.41 EGP
• The stock is currently trading at a significant discount compared to both valuation benchmarks:
o 53.7% discount to the book value multiple (0.278 vs. 0.60 EGP).
o 32.2% discount to the fair value based on the sector’s P/E ratio (0.278 vs. 0.41 EGP).
• EPS: 0.07 EGP
• 52-Week Price Change: -32.05% (significant decline, suggesting weak market sentiment or financial concerns)
2. Financial Health & Liquidity:
• Cash: 498.11M EGP
• Debt: 875.23M EGP (debt exceeds cash, leading to a net debt of -377.12M EGP)
• Net Cash Per Share: -0.19 EGP (indicating a negative net cash position, which raises concerns about liquidity and financial stability)
• Working Capital: -134.22M EGP (negative, suggesting possible short-term liquidity issues)
3. Profitability & Margins:
• Revenue: 345.92M EGP
• Net Income: 76.01M EGP (net margin of 21.97%, which is decent)
• Gross Margin: 22.94% (moderate, indicating the company retains a reasonable portion of revenue after direct costs)
• Operating Margin: 16.82% (suggesting the company has good cost control, but interest expenses may be a concern given the high debt levels)
4. Key Takeaways:
✅ Positive Factors:
• Profitable with a 21.97% net profit margin
• Trading below book value (0.278 EGP vs. 0.35 EGP), which might indicate undervaluation
• Stable earnings per share (EPS: 0.07 EGP)
⚠️ Concerns:
• High debt (875.23M EGP) relative to cash reserves
• Negative working capital (-134.22M EGP), which could pose liquidity risks
• Stock has underperformed significantly in the last year (-32.05%)
Investment Consideration:
According to Tracxn, Pioneers Holding has a Tracxn score of 34 out of 100, positioning it ahead of Beltone (29/100) but indicating room for growth compared to leading firms in the sector.
• Value Perspective: If you believe the company can improve its balance sheet and market sentiment shifts, this could be an undervalued opportunity.
• Risk Consideration: The negative cash position and high debt may pose risks, especially if interest rates rise or earnings decline.
Tech. Analysis
see the chart mark refer to GANN & Elliot wave

MM Group Egypt - Quick trading between S & R lines 1-hour chart,
the stock EGX:MTIE is trading in a rising wedge. While this is a bearish chart pattern, we can trade between the support and resistance lines (7.60 - 8.00) for the next few weeks - or until breaking either boundaries.
In case of:
closing 3 hours below line S, the target will be 7.10
closing 3 hours above line R, the target will be 8.66
A near stop loss level should be considered.

ASCM BUY ASCM break the trend and it will go up as 50% MIN AT 58-60 with stop loss at 33 which means 13% stop loss AND take profit 50%

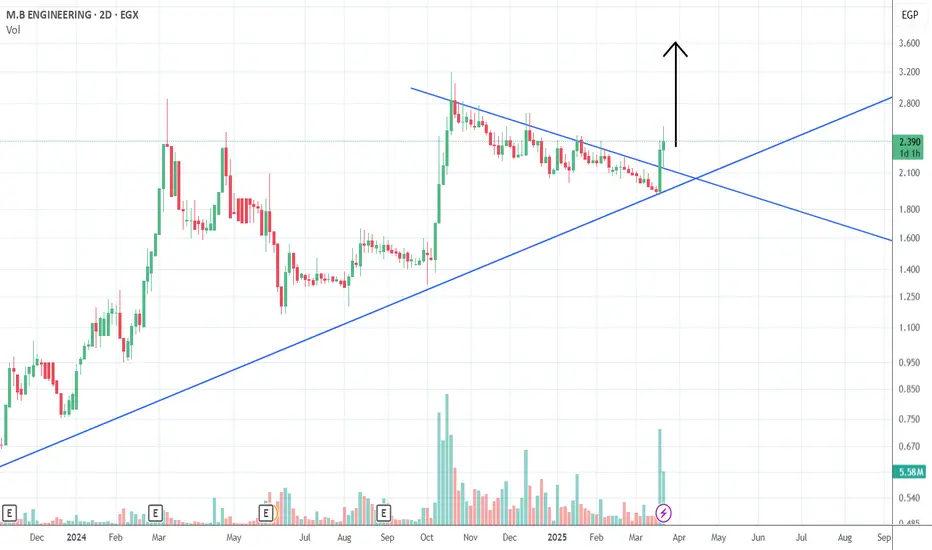
MBEG Buy MBEG breaks the main trend wihch means t will go up tp 3.60 as min 50% profit so we will take buy position with sl 15% and tp 50%
atlc buy signal ATLC break the trend and it will go up as 40% with stop loss at 4 whcich means 40% take profit and 10% stop loss