METSB: Possible Buy AreaPrice is currently holding above an old price range. Such prior resistance/pivot levels often act as good support levels. This analysis is purely technical. Weekly candles chart.

Is the Finnish Bank OmaSp about to collapse?The charts are suggesting caution. On the above 10-day chart:
1) Double top in price.
2) Regular bearish divergence.
The higher the timeframe you look the more ugly this divergence is.
Laterally I’m wondering if the small banking crisis that hit the US is now venturing to other parts of the world. OmaSp does not appear to be in isolation.
There were some tell-tell signs before the collapses of Silicon Valley and Signature Banks. (No one in Europe heard of those banks!) They were:
1) Strong bond market exposure.
AND
2) Same TA as above.
“OmaSp has been active in the bond market since 2013” says their website. Very true..
Until recently you could get the information on their Bond market exposure.. You click on the WebPage today and you get:
www.omasp.fi
“Unfortunately the webpage you were looking for can not be found”
Oh dear…
Ww
Type: Trade, short
Risk: <=3%
Timeframe: Candles closing at 19 and under.
10-day Silicon Valley Bank
before
after
10-day Signature Bank
before
after

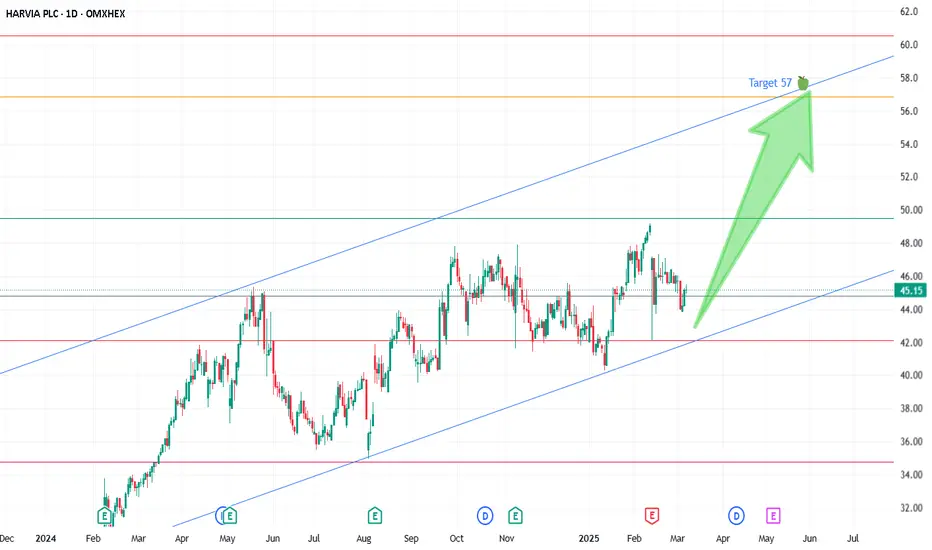
Harvia PLC(FINLAND STOCK)I have analyzed this Harvia PLC using trend, candle patter & Gann technique. Then reached the conclusion for target(57). And i have mentioned the entry as well. It is a Finland stock. This stock is in uptrend.
Nuclear new goldAll this talk about nuclear energy, i think that its the new gold. It seems like a sustainable solution, especially with data center for AI's. OMXHEX:FORTUM and OMXSTO:SVIK is two candidates, they work with nuclear waste, and does some jobs in Sweden where 10 new reactors is planed to be build.
These two are a bit slow in price swings, why i post them. Under the blue line sell out or if they dont follow the arrows.
If you dont mind big swings, i would DEFINITLEY! reccoment NYSE:SMR and NASDAQ:NNE

$Tokmanni Technical OutlookTokmanni is showing a bullish trend on the daily and lower timeframes, respecting supply and support levels. As seen before, when the price broke above 12, it made a natural pullback before continuing to break new highs.
With the trend still bullish, riding the wave makes sense. The stock seems to have solid momentum towards 18, where some selling pressure could appear.
However, one key thing to watch is that whenever the trend shifts bullish, it struggles to sustain positive momentum and quickly turns bearish. This pattern has repeated multiple times.
⚠️ Be cautious: if the wave turns bearish again, we could see a sharp sell-off.

INCAP (INP1V): Possible Retest Area!
Liquidity has been taken.
Back above the round number €10, confirmed with a strong candle in May
Nice descending nature to the retest area
Do your own work, and if it aligns with mine, then you're likely ready to go.
Good luck,
Vaido

Upside potential 3 year long position Rapala Rapala stock has been under a lot of sales pressure and are currently trading 0.05 eur below all time low. Inventory are valued at 84.7MEUR while MCAP is 88 MEUR. As the worlds leading fishing equipment manufacturer I find the valuation to be very attractive. Trading volume is low, only 2 analysts cover Rapala and has a price target of 2.7EUR.
EBITDA H1 2024 was 16.9MEUR compared to 10MEUR for H1 2023.
Dept is sinking while cash and cash equivalents remains solid at 27.6 MEUR at June 30, 2024.

NESTE Corporation: Falling Knife! Put on The Steel Gloves!Neste Corp. is a Finnish company founded in 1948, headquartered in Espoo, that specializes in petroleum products and renewable diesel. It operates in four main segments:
Renewable Products: Produces and sells renewable diesel, jet fuel, solvents, and bioplastics raw materials.
Oil Products: Supplies a range of fuel products, including diesel, gasoline, aviation and marine fuels, oils, and solvents.
Marketing & Services: Sells petroleum products and services to end-users, including motorists, industries, transport companies, and heating oil customers.
Others: Includes Neste Jacobs (engineering and technology services), Nynas (joint venture), and corporate expenses.
Neste focuses on expanding renewable energy solutions alongside traditional oil products.
Fundamentally, the current price doesn’t present an ideal buying opportunity, as indicated by recent analysis. The chart, technically speaking, also suggests that key areas of interest lie slightly below the current price levels.
The steel gloves should be on because the downforce has been quite strong but still, I would like to try to catch it using my skills ;) Lezz see!
Good luck,
Vaido

NESTE has potential to doubleDivergence on all timeframes, looks like an ABC retracement, reached 61.8 fib of the whole move up. Good place to buy, in my oppinion

NDA_FI: Buy ideaOn NDA_FI we have a buy idea because we have the breakout of vwap indicator and also we have a spring effect on vwap.

FINNAIR: Fakeout IdeaIf you believe Tuesday's move to the downside to be a fakeout, one potential play could be as shown on the chart. Target would be range highs. Personally would not consider trading this move.

Finnair: Heading for new lows?Price has failed to break above the descending trend line and currently struggling to hold the support area.

WITH: Potential BuyCurrently in a range consolidating above the 1 EUR psychological level, we'll see if it holds supported by a trend line. Personally I'd consider WithSecure as a long term buy. S/R zones marked to look out for.

NESTE: Potential BuyPrice has broken the descending short term trend line while holding the key level area supported by a trend line. A confirmation of the direction could be a short term range breakout with price closing above the range highs. Areas marked to look out for.

STERV - 10 months HEAD & SHOULDERS══════════════════════════════
Since 2014, my markets approach is to spot
trading opportunities based solely on the
development of
CLASSICAL CHART PATTERNS
🤝Let’s learn and grow together 🤝
══════════════════════════════
Hello Traders ✌
After a careful consideration I came to the conclusion that:
- it is crucial to be quick in alerting you with all the opportunities I spot and often I don't post a good pattern because I don't have the opportunity to write down a proper didactical comment;
- since my parameters to identify a Classical Pattern and its scenario are very well defined, many of my comments were and would be redundant;
- the information that I think is important is very simple and can easily be understood just by looking at charts;
For these reasons and hoping to give you a better help, I decided to write comments only when something very specific or interesting shows up, otherwise all the information is shown on the chart.
Thank you all for your support
🔎🔎🔎 ALWAYS REMEMBER
"A pattern IS NOT a Pattern until the breakout is completed. Before that moment it is just a bunch of colorful candlesticks on a chart of your watchlist"
═════════════════════════════
⚠ DISCLAIMER ⚠
The content is The Art Of Charting's personal opinion and it is posted purely for educational purpose and therefore it must not be taken as a direct or indirect investing recommendations or advices. Any action taken upon these information is at your own risk.

Finnair: Pennant pattern on 1h chartFinnair has broken the 4h TL and 1h pennant pattern. For this reason I'm short term bullish. In case we break the most recent support zone, the pennant pattern has failed.

NOKIA: Daily Chart UpdateNews are shaking the price so good luck trying to guess the direction. Based on the trend lines I'd still expect upside coming in the next few weeks if we keep diving lower.

NOKIA: Intraday UpdateAfter testing the strong daily key level multiple times the price is heading lower towards next support zones.

NOKIA: Areas to look out for on a 4h chartCurrently in a downtrend, things might take a turn as we're going towards strong key levels.

FIA1S December OutlookLooking out for the regression and RSI trend. Expecting pullbacks or reversal from the highlighted zones.

Nokia catch this wave up!!I guess we cant go lower and we are about to break out upwards. Lest see how it will go.

Are you blind!?Previous Close 4.4545
Open 4.4700
Bid 4.4480 x 0
Ask 4.4495 x 0
Day's Range 4.4410 - 4.4925
52 Week Range 4.1180 - 5.7690
Volume 3,407,332
Avg. Volume 10,904,368
Market Cap 25.032B
Beta (5Y Monthly) 0.57
PE Ratio (TTM) 16.47
EPS (TTM) 0.2700
Earnings Date Jul 21, 2022
Forward Dividend & Yield 0.08 (1.80%)
Ex-Dividend Date May 02, 2022
1y Target Est 57.72
No sell only buy

