


QT Group in good up trend ?quite nice looking fork from QT Group, that was painted as nice picture during Jan 14th.

Sampo Analyst recomm 38EurSampo Analyst recomm 38Eur
buy 34-35eur
It was 33EUR in Dec, so it has been upward (see blue channel)
- downtrend reversed ? (black line)
- high from spring 2020: 42 EUR (black dotted line)
- bottom from Apr2020: 22-23 EUR (black dotted line)
Note
- Earnings mid-February
- potential sell of Nordea shares (dragging earnings) summertime
- one of the top traded shares in OMX
- fin. government owns 7-8% of shares
- fin. insurance companies own 5% of shares

Wartsila possible bull movementHello!
The first "real" stock I have ever bought. Wuhuu! (for long term) 5th of january 2021
Had to make a small analysis about it ;)
Okay. So we can see from the left chart (weekly) how we have been under this supressing trend line from the year 2018, 30th of july. Price hit the trend line 4 times and the fifth time broke it. Atleast for now.
RSI has given us also this beatiful price action and a trend line which had been hit 4 times. Right now we can see from the chart that fifth hit seems like it's going to break it, so the trend might turn to bull.
On the right chart (daily) we can see 200 ema (red line) under the price and how the price used it as a support (other than before). RSI did also break the short time downward trend line.
This also gives me a bullish view. If we break them we might go lower.
(left picture) First target we need to break is that 9 euro resistance then we get good space maybe move towards 11,3 euro where there is again 200 ema waiting on us.
I don't think this is a good stock to trade, or maybe it is, but if you do take TRADES always use stop loss!
Otherwise you will get your ass burned.
-Jebu


Nokia up 15%??Nokia Could see a 15% in the coming weeks, due to it's past trends very similar to this one! Let me know if you see something different!

NOKIA on the verge of breakoutNOKIA is now back to where it was before the crash after earnings. I see a strong upside possibility from here on. Fingers crossed.

A monster popping out soonHellow! This is a fininsh cool company.... game design... have you ever played Alan wake? go and buy it ;)
BUY AND HOLD TILL EARNINGS...AND BEYOND IF YOU WANT

Upm for long I've been Watching stocks recently and this is one the stocks am watching... Come join us if see it too

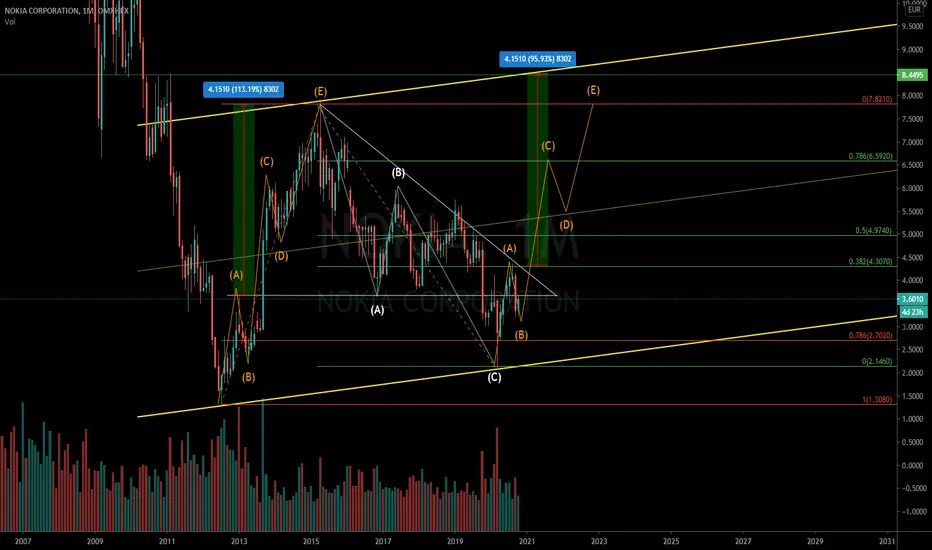
Nokia possible impulse wave in the making!Nokia hasnt been looking to good the past couple of years, but this all could change very fast.
with the upcomming Q3 earnings release coming up this thursday and alot new 5G contracts in their pocket this could be the start of a big impulse wave up.
fundamentals:
# march 2015 can be seen as the beginning of a HUGE descending triangle with a fake bearish break out starting at september 2019. Nokia is currently being traded at that so important level and needs to be taken in order for this lookout to become truth. after that the level to watch is 4.3 as this would confirm the bullish breakout of the triangle. NOTE: descending triangles are normally bullish patterns, but trade carefully as their are some huge levels to conquer.
# Nokia has been a big factor in the 5G industry with over 125 contracts concerning 5G, with the expectations of 5G becoming bigger and bigger this would logically push nokia's shares higher and higher.
# the chart shows that the fibbonaci level 0.786 drawn from our last H/L was accepted as a support level (currently being traded in the golden pocket area which i didnt draw to clear the chart a bit )
If we manage to break the golden pocket area upwards these are the level to watch and possibly take profit:
TP 1: 4.30
TP 2: 4.97
TP 3: 6.59
TP 4: 7.82
TP 5: 8.45
Stop-Loss : between 3.2 - 2.7
Dont over leverage!
Trade safely and do your Risk Management !
Give a follow and a like if u liked my analyse on nokia!
TIETO: Less risky at current levelsThe stock is at reasonable price point. If we consider historical data, there is a very strong probability of making some money in the near short term. The chart has clear patterns. Exiting at right time and reentry is the best way to make some money.
21 Euros is a reasonable entry


Bright future for ValoeDear investors,
Production of Sion cars will be started in september 2021 and every day 200 car will be manufactered in ex Saab factory, all these cars will be equipped with solar panels from Valoe so we can only imagine how turnower and profit will raise.
Best regards,
Valters


FLATTENING TO BOTTOMS - SELLERS STILL THERE - NOKIA -DAILYWe have noticed that the market price is flattening. From a long super drop, it has been evolving in a horizontal range which is still going a bit down.
The bottom black lines are showing probable bottom and potential extended bottom.
Whenever the market price finds regularity in the long direction, sellers come to push it back down.
To resume the recovery is very hard and the fall easy to engage. Very pessimistic.
The top blue line is showing a zone where sellers are stronger. Their action zone. Breaking that point would possibly announce a big movement upwards.
Positive side: The market trend is less elastic in the decrease direction and have been trying to run horizontally rather than downwards.
Investors sentiment is probably what the price reveals. Waiting maybe for a decision in the board or expecting a technological move to revive Nokia Corporation's price up.

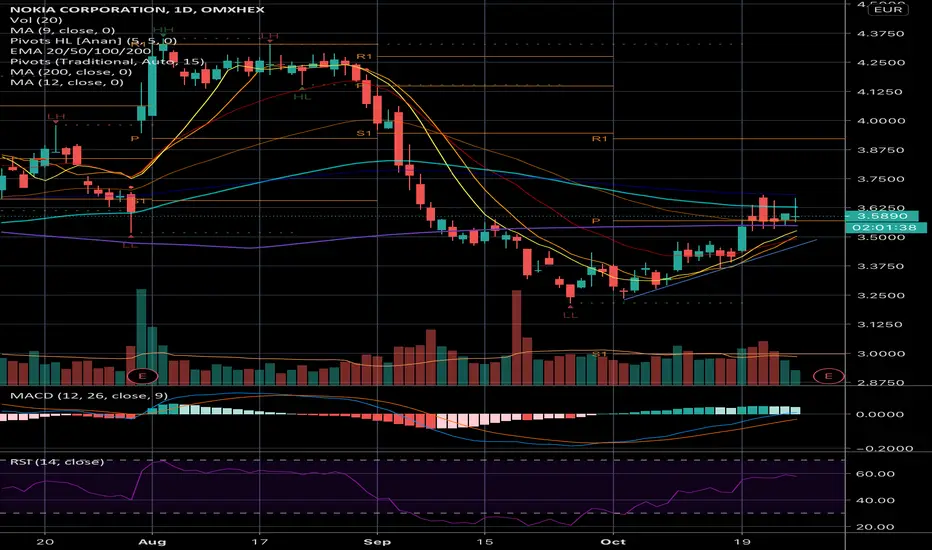
Bullish - Last resistance break-downRSI building up
MACD turned from bearish to bullish
MA20 - MA50 - MA200 is positive and perfect setup
Last resistance broke friday 2/10/2020.
Might move towards 30-35 before minor retracement.
