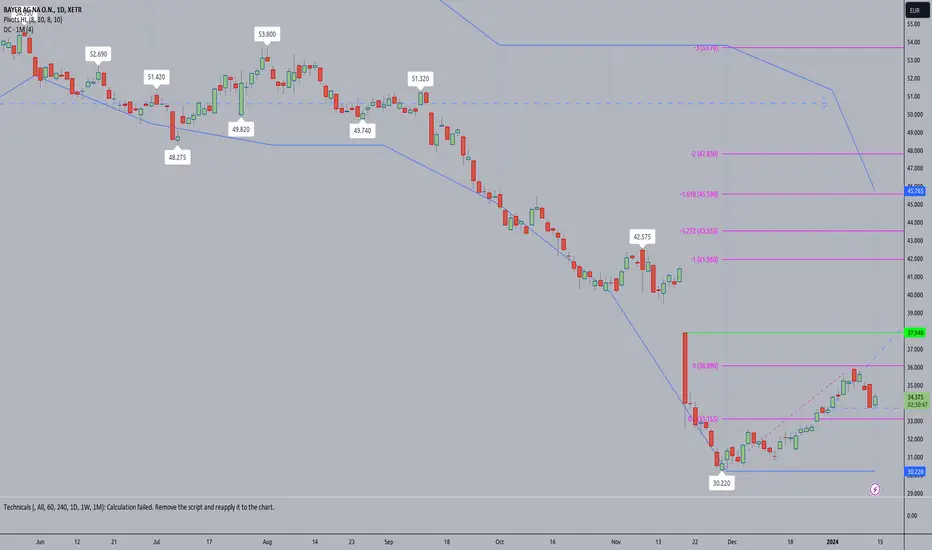
BAYN Entry ZoneBayer has reached a Fibonacci entry zone after yesterday's fall.
There is a window to be closed that has been opened at the fall on November 20th.
ZALANDO on fireJust wondering what s going on here.
This stock has broken a very impressive support of long term.
Is there any chance to go short on it?

#ADS • adidas AG • XETRA LONG TF H1#ADS • adidas AG • XETRA LONG TF H1,
TP = 181.62 , SL = 169.64
The trend continues, the nearest support level according to my calculations TP = 181.62

Siemens Healthineers: Not yet done ☝️Siemens Healthineers took a step south at the beginning of the year, but has since almost made up for this setback on the upside. Nevertheless, we have drawn up a new alternative scenario with a 30% probability on the chart, according to which the current rise would already be completed with the last high in the form of the magenta-colored wave alt.(X). Accordingly, the price would fall below the support level of €45.51 earlier and consequently into our turquoise-colored Target Zone between €40.32 and €36.13. As part of our primary scenario, however, we give the stock a little more room on the upside - namely until just above the resistance at €53.98 - in order to underpin the top of the regular magenta-colored wave (x). Only then should it dive into the turquoise Target Zone.

Novo Nordisk failed new ATH but still bullishNovo failed yesterday to achieve a new all time high and dropped
Now bouncing on support 96,5
I think will going to break upside reasistance soon

PG&E corp is in for an ELECTRIC RIDE UPWARDSPG&E isn't going anywhere, California is helplessly dependent on it. they are investing in their infrastructure (after its horrendous wildfire fiasco due to infrastructure negligence). This situation lead to a tremendous sell-off because it seemed like a risky company to hold stocks for and overall the company was just hated throughout California after the fires. I think that very soon the stock price is set for a very aggressive bounce back to its past high value levels

GAP is ready for a series of PRICE GROWTH!GAP is registering significant net positive volume this past few weeks -- in anticipation of the company's turnaround story in terms of bottomline which it did after the company posted a surprise profit due to business re-organization after last Month's earnings result.
The stock is sitting at a strong solid support at 8-9 area -- a 1.0 FIB level area where buyers converge. Expect price to bounce from this range.
Weekly histogram has created higher lows conveying incoming reversal to the upside.
Spotted at 8.5
TAYOR.
Safeguard capital always
----------------------------------
FUNDAMENTAL NEWS: Reference Barrons.
Gap’s Surprise Profit Gives Stock a Boost
By Sabrina EscobarFollow
May 25, 2023 5:09 pm ET
Gap’s same-store sales fell by 3%.
Gap stock surged on Thursday after the company posted a surprise profit.
The apparel retailer posted adjusted earnings of one cent a share in the quarter, better than consensus estimates for a loss of 16 cents a share, according to FactSet. While revenue of $3.28 billion declined 6% compared with the previous quarter, it was in line with the company’s and the Street’s projections.
Same-store sales fell by 3%, more than forecasts for a 2.4% decline.
For the second quarter, Gap (ticker: GPS) is expecting net sales could decrease in the mid- to high-single digit range from the year-ago quarter’s $3.86 billion. Current estimates have Gap’s second-quarter sales down by roughly 5% year-over-year. For fiscal 2023, net sales could decrease in the low to mid-single digit range.
Despite the decrease in sales, Gap believes margins will grow in both the second quarter and the remainder of fiscal 2023. First-quarter adjusted gross margins increased 5.7 percentage points compared with the previous year.
Gap stock jumped 16% to $8.61 in after-hours trading.
The company is currently reorganizing its business to improve profitability. Earlier this year, it announced it was cutting 1,800 corporate jobs in addition to 500 jobs culled in September.
“While the macro and consumer environment remain uncertain, Q1 underscores our ability to deliver improvements to the business including share gains at Old Navy and Gap Brand, adjusted operating margin expansion, reduction in inventory, and strength in our balance sheet,” said interim CEO Bob Martin in a statement.

Deutsche Bank Shares: Riding the Bull with a Diamond SparkleTechnical Analysis for Deutsche Bank Shares:
1. Bullish Diamond Fractal Formation:
Deutsche Bank shares are currently exhibiting a notable technical pattern known as a Bullish Diamond Fractal. This pattern suggests a potential reversal in the prevailing downtrend, indicating a shift in market sentiment in favor of the bulls.
2. Key Levels and Targets:
First Take Profit (TP): The analysis points to a conservative first take profit level at 15,500. This level is identified as a potential resistance where traders might consider taking profits.
Second Take Profit (TP): A more optimistic target is set at 23,010. This level represents an extended bullish move and could attract additional buying interest.
Stop Loss: To manage risk, a stop-loss order is recommended below the support level, around 9.809. This level acts as a safety net to limit potential losses in case the market moves against the anticipated bullish scenario.
3. Market Sentiment:
The analysis suggests an optimistic outlook for Deutsche Bank shares, supported by the Bullish Diamond Fractal pattern.
The expectation is that the upcoming Monday will be very bullish for this pair, indicating potential positive market sentiment and increased buying interest.
4. Related News:
According to a historic news article from CNN (dated October 25, 2023), Deutsche Bank shares have experienced a surge, leading to an increase in dividends. This positive development aligns with the technical analysis, providing fundamental support for the bullish outlook.
The increase in dividends can be interpreted as a sign of confidence in the company's financial health and performance.
Positive news like this can attract more investors, contributing to the bullish momentum identified in the technical analysis.
Conclusion:
The technical analysis, supported by the recent positive news, suggests a bullish stance on Deutsche Bank shares. Traders and investors should carefully monitor key levels, consider the recommended take profit and stop-loss levels, and stay informed about market developments to make well-informed decisions.


Unveiling Potential Opportunities in $TUI1 Stock - LONGUnveiling Potential Opportunities in XETR:TUI1 Stock: Navigating the Surge and Identifying Profit Targets
In the wake of recent developments surrounding Tui, Europe's largest package holiday operator, the decision to potentially shift its stock exchange listing from the FTSE 250 to Frankfurt has stirred considerable interest in the financial landscape. This move not only impacts Tui's positioning but also raises questions about London's standing as a global finance center.
Analyzing the Buzz:
Our analytical tools reveal a notable influx of new capital into XETR:TUI1 , suggesting a shift in investor sentiment. This surge in interest prompts a comprehensive examination of Tui's current standing and the potential for robust bullish momentum in the coming weeks. The evolving narrative surrounding Tui's future developments adds an intriguing layer to the stock's dynamics.
Key Insights:
Listing Shift Implications: The contemplation of moving the stock exchange listing from FTSE 250 to Frankfurt introduces a new dimension. Investors should closely monitor how this potential shift impacts Tui's visibility and accessibility in the global financial markets.
Bullish Momentum Anticipation: With the influx of new capital, anticipation is high for the emergence of strong bullish momentum. Investors should position themselves strategically to capitalize on potential upswings in $TUI1.
Take Profit Strategy:
As seasoned stock traders, we identify the importance of setting realistic take profit targets. Considering the current market conditions and Tui's evolving narrative, we propose the first take profit zone to be around $13.345. This level is strategically chosen based on our analysis of Tui's recent performance and the potential for continued positive developments.
Risk Considerations:
While optimism surrounds XETR:TUI1 , prudent risk management is paramount. Stay vigilant to external factors, such as geopolitical events or regulatory changes, which may impact the stock's trajectory. Maintain a keen eye on the evolving narrative and be prepared to adjust strategies accordingly.
Conclusion:
Navigating the current landscape of XETR:TUI1 requires a balance of informed analysis and strategic decision-making. As we anticipate bullish momentum, investors should carefully monitor unfolding developments, align their portfolios accordingly, and consider implementing risk management strategies.
For further insights and real-time updates, continue tracking reputable financial news sources and market indicators.
Disclaimer: The information provided is for educational purposes and does not constitute financial advice. Always conduct thorough research and consult with a financial professional before making investment decisions.

palantir on the downPalantir Technologies is a public American company that specializes in big data analytics. The company’s stock has been volatile in the past, and some investors believe that it is overvalued. Additionally, the company’s listing on the Nasdaq Global Select Market is currently in question due to the exchange’s disapproval of the company’s plan to consolidate the financial results of Canopy USA at one point. If Canopy chooses to continue with its plan and speed up its entry into the U.S. cannabis market, its listing on Nasdaq could be in jeopardy

Breakout of the wedge on the support.In the figure, you can see the support marked with a purple color, which is the defense of the previous LOW.
There is also a wedge on this support.
If the trend line is broken, and the wedge is broken at the same time, there is a possibility of entering a trade and achieving a risk to reward ratio of four to one.

[Scenario] I am waiting for a correction to the 50% Fibonacci retracement, then there is a possibility of entering with a risk to reward ratio of three to one.
Remember that you can create many scenarios in the market. This is just one of the possibilities.
I am waiting for it because it will be a kind of entry after the correction, there will also be a retracement of our movie, and a probable conference of the trend line and clouds, which already gives us several confluences in one trade. Therefore, this trade can be nice.
That’s why I’m creating a scenario in advance to watch what the market will paint.
=> If the market goes in my direction according to this scenario, I will of course be happy and I will make a transaction.
=> If the market seeks straight up, I will not be unhappy at all, because it is simply another scenario that has drawn itself on the market.
The market always draws its own, scenarios do not always check out. However, it is worth creating scenarios to be prepared. Well, what will appear on the market, and not just wildly react to what is happening.
Planning instead of reacting.

ENR halfway to partial recovery, mid-term, still time to runTo Mid and long term investors: (day traders, swingers, flippers and gamblers...this is not for your weak hearts)
The stock never really had meaningful reasons to devalue. Just rumors behind a solid company with plenty of assets and cashflow. Hard times with energy wars waging and still new plans for expansion are being drawn in Starnberger lake houses. Hopefully the full acquisition of GAMESA will clear the path to renewables, which are the future considering all the pledges to go carbon neutral by 2050. ENR has all in place to succeed in that war. and moreover it is also under Graham's value.

Sell opportunity for MBG (Mercedes Benz group)Hello guys
There is sell order in MBG stock .
I hope you enjoy it

G24 Long SwingJP Morgan announces their optimistic insight about European Internet Stocks.
-Consolidation area.
-High volume bullish breakout.
-Confirmative pullback.
TP on a previous reference point.
SL below the pullback low.
r/r 3-5 based on the reference point used.

VW to target 136 after crossing 119Daily chart, the stock is forming a chart pattern, and after crossing the resistance line (blue) at 119, the target will be 136 soon
Technical indicators RSI and MACD support this view.
Stop loss 117 to be considered

$MBG after a great fall comes the revival.MBG showing extreme SHORT moves past couple weeks. We can clearly see a strong band between 50$ and 57$. It seems like LONG positions entered anywhere in this area would generate a good profit. Be aware that this would be a "Buy and forget for a couple of weeks." trade.

AIXA • AIXTRON SE • XETRA LONG TF H4#AIXA • AIXTRON SE • XETRA LONG TF H4,
TP = 33.40 , SL = 25.80
The trend continues, the nearest support level according to my calculations TP = 33.40

Momentum, Growth and Innovation: RHMWe have just added a new position (RHM) to our 'Growth, Momentum and Innovation' portfolio with 11% of total equity.
Here is the link to our updated portfolio, which is up > 18% in the last month:
www.tradingview.com
Technical Analysis According to Minervini’s Principles
Trend: Rheinmetall's stock should be evaluated against the major moving averages. Minervini looks for stocks trading above their 50-day and 200-day moving averages to indicate an overall uptrend. If RHM is above these averages and they are sloped upwards, it aligns with Minervini’s criteria for a bullish trend.
Price Action: Minervini favors tight price action and volatility contraction. It's key to look for lower volatility and tighter price consolidation before the breakout. This can be seen in the narrowing of the Bollinger Bands or a decrease in daily price range. If your entry corresponds with a breakout from such a consolidation with a definitive move above resistance, this is in line with Minervini’s strategy.
Volume: Volume is critical in confirming breakouts. For Minervini, an ideal entry is accompanied by a significant increase in volume, indicating strong institutional buying. If the entry day shows higher volume compared to previous days, particularly if it is 40-50% above the average, it validates the trade entry.
Relative Strength: Minervini often emphasizes the importance of relative strength, especially in a weak market. If RHM is outperforming the market and its peers, that would be a positive sign.
Entry Point: A proper entry is at the breakout from a sound base pattern. If RHM is breaking out from such a base, ideally after a period of price contraction, and doing so on higher volume, it would be considered a good entry point.
Risk Management: Setting a stop loss is crucial. Minervini typically sets stop losses just below the breakout point or a recent swing low to minimize potential losses.
Background Information on Rheinmetall AG
Rheinmetall AG is a significant player in the automotive and defense industries. They are known for:
Defense: Producing military vehicles, weapons, ammunition, and electronics. They are often involved in large contracts with governments around the world.
Automotive: Supplying engine systems, pumps, pistons, and other automotive parts to the commercial vehicle and passenger car markets.
Market Position: As a leading defense contractor and automotive supplier, Rheinmetall has a strong market position in Europe and significant international presence.

Zalando: Final Stage 🏁Zalando's stock price retreated last week, so we consider the high of the magenta wave (iv) to have been reached. We therefore locate the price in the last stage of the gray wave II and expect a descent to the green Target Zone between €18.71 and €10.40 before this movement is completed. Long entries could be made here. However, there is also a 30% probable alternative, which would see a further rise should the price exceed the resistance at €26.40.

BAS • BASF SE • XETRA LONG TF H4#BAS • BASF SE • XETRA LONG TF H4,
TP = 46.46 , SL = 40.20
The trend continues, the nearest support level according to my calculations TP = 46.46

AFX • Carl Zeiss Meditec AG • XETRA LONG TF H4#AFX • Carl Zeiss Meditec AG • XETRA LONG TF H4,
TP = 98.90 , SL = 72.48
The trend continues, the nearest support level according to my calculations TP = 98.90
