1COV • Covestro AG • XETRA LONG TF H1#1COV • Covestro AG • XETRA LONG TF H1,
TP = 51.31 , SL = 45.70
The trend continues, the nearest support level according to my calculations TP = 51.31

BAYER AG: $40.60 | Aspirin AlkaSeltzer Monsanto + $11bn Settled Bill Anderson doing the roadshow in Dc and Carlyle Group seems to be
going in heavy at current levels or lower for the next RUN UP
a long game to make a killing for heavy hitters in the pharma bio agri chemical business
the timing to position for such a deal takes time and feel in the this type of business
the usual play is Dress up Window PUMP for public retails the rest to participate
unload shares and reserve cash to acquire a highly controversial company MONSANTO
ROUNUP herbicide with Glycophaste is the EYE SOAR or hang up where litigation is a downgrade for fund managers
it settled the 100,000 lawsuits on roundup to $11bn just this October 2023
this is done.. and we begin to DCA slowly and reserve at the buy zone or shakedown levels
for next WINDOW DRESSING acquisition of BAYER
could be a COViD Vaccine or some super food enhance in the VEGiE MEAT business gaining traction

DHL: The low has been delivered 📦Due to the current upward movement of the DHL share, we now consider the low of the green wave (1) to have been reached. Consequently, the share price is currently already in the green wave , which is likely to continue for some time. We expect this wave to end below the resistance level of €47.05 and thus the start of a new downward trend.

MERCEDES-BENZ Long IDEA The stock seems to have support here with a developing cup & handle patten which will target gap close at 61.40
Bullish MACD crossover
Buyzone: 57-56
Stoploss: 55
A **Cup and Handle** pattern is a technical chart pattern that resembles a cup with a handle, where the cup is in the shape of a "u" and the handle has a slight downward drift. This pattern is considered a bullish signal, extending an uptrend, and is used to spot opportunities to go long.
Here are some key points to consider when detecting cup and handle patterns:
- **Length**: Cups with longer and more "U" shaped bottoms provide a stronger signal. Avoid cups with sharp "V" bottoms.
- **Depth**: The cup should not be overly deep. Also, handles should form in the top half of the cup pattern.
- **Volume**: Volume should decrease as prices decline and remain lower than average in the base of the bowl; it should then increase when the stock begins to make its move higher, back up to test the previous high.
The pattern was first described by William J. O'Neil in his 1988 classic book on technical analysis, "How to Make Money in Stocks". The full pattern is complete when price breaks out of this consolidation in the direction of the cup's advance. The price will likely continue in that direction though conservative traders may look for additional confirmation.

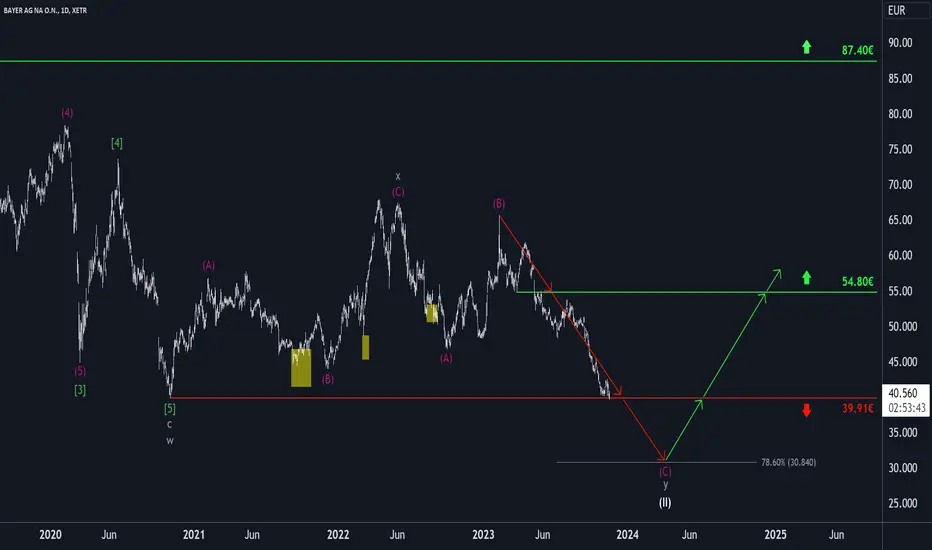
Bayer: Down the hatch! 🍺After Bayer's stock recently tried to break through the support level of €39.91, it has now made another attempt. Whether the stock succeeds in sustainably breaking below this support level - as envisaged in our primary scenario - or whether it needs further impetus in the form of a corrective upward move is irrelevant for the further course of our expectations. We therefore fully expect a sell-off below this level, as we expect the low of the major wave (II) correction underway since 2015 to be around the 78.60 retracement at €30.84. Only once this low is in place do we see Bayer shares making sustainable gains again.
$BMW on spike with reverse cup and handle.The red line indicates a good resistance spot confirmed by monthly price movements. The arc represents the reverse cup and handle that formed in the daily chart. After a wild downwards move BMW came to a good retest area of the this resistance. A good SHORT position is what i expect. On the other hand this area showed bounces in the past too so it wouldn't be surprising if we see a reversal. But mainly my expectations is within the SHORT side.

SAP vs. MSFTXETR:SAP shows a strong correlation to NASDAQ:MSFT , which on the surface is not very surprising. But comparing fundamental data and the general company profile can lead to some raised eyebrows.
In my view NASDAQ:MSFT appears to be a much stronger company, which should have little problems capitalizing on the current AI hype for growth and also overall has a much more ubiquitous product portfolio.
Meanwhile, the ongoing strength in the chart of XETR:SAP appears perplexing and one cannot help but wonder what are the fundamental catalysts for these moves are. My assumption is that SAP is currently simply riding the wave as perceived similarity to MSFT. While SAP has a higher dividend yield it shows much less potential for future growth. Its P/E ratio also appears quite exaggerated. I believe the similarity to MSFT is only skin deep.
Unless something fundamentally changes, my hypothesis is that we are due for a correction in $XETR:SAP. Now the RSI on the daily chart indicates overbought conditions, so we can use this opportunity to initiate a medium term short trade. It will be difficult to get the timing right for an put options trade, but we can enter in increments if the trade starts going against us.
First price target for taking profits is 120 with a expiration date before earnings in January 2024.
If you want to hedge the risk, you could also buy MSFT calls to cover the upside potential.

Bavarian Motor Works (BMW) is going down from hereMonthly Time-Frame:
--> Evening-Star --> target: around $72
--> 14-period Monthly RSI has steep downward slope and, like all the similar past situations, looks like a high probability of downward momentum
Position: SHORT

BWD : Patience BWD : Patience
Looking for the range bottom at 18eur.
Following Tesla on the way up, in case this holds true would align with a bounce at 18Eur.
Between 18eur and 9eur no retest happened a lack of liquidity can spiral price lower into this zone.

RHM | Command and Conquer | 1 Buy scenarioOverview
Rheinmetall had a great run specially fueled by the war in Ukraine. With an additional crisis forming in the Middle East i can see the price going further up. From a chart point we see that the current resistance (100% Fib Line) was 2 times pierced (yellow circle) but price never really broke it.
The Buy zone is based on the confluence of the 50% Fib level and an already engulfed (blue circle) support level that lead to the current ATH / Swinghigh.
Target 1: The First big resistance level (S/R Level 1) which stopped this really for quite some time. I would close 50% of the position here.
Target 2: Slightly below the former Swinghigh / ATH. The remaining 50% of the position would be closed here
Stop- Loss: None (Long- term- holding
Invalidation: Price always stay above the buy zone
Good luck
Disclaimer:
- This information does not constitute as financial advice and is only for entertainment purposes. I am not your financial advisor.
- You trade entirely at your own risk
- Make your own research
- Finance and trading is evil, capitalism is bad, duh

Sartorius: Target 180 Euro?After subsequent negative news, we see again a important floor broken and a falling knife movement. There are two different patterns indicating a move towards 180 or into a side movement corridor between 168 and 196 which is again 15 to 30% downwards potential. It's an ABC pattern (not a perfect one) as well as the side range which includes a local double top. The side range/ideal target of this is nearly the same as the ABC target: Approx. 182 Euro.

WCH | The chemistry matters | 2 buy scenariosThis is the my second trade idea regarding Wacker Chemie AG (WCH).
After the first idea gave a nice ~ +27% gain and as WCH is currently in a strong downtrend, looking for zones to open a new position.
Overview
WCH is stuck in a range (This is the monthly chart). Breakouts of the range (yellow circles) on either site leads to price moving to the opposite side and usually a retest / fake- out.
Scenario 1 (Orange arrow)
Requirements : Price falls down to the buy zone (green area). Breaks below the bottom of the range and retakes it.
Stop- Loss: None
Invalidation: Price breaks below bottom range but doenst retake it
Target: Slightly below S/R Level 1
Scenario 2 (Blue arrow)
Requirements: Price falls into the buy zone(green area). Generates a reaction (Swinghigh). Price drops but stays above the buy zone. Price
Stop- Loss: Price closes on the the monthly below the bottom range
Invalidation: Price breaks below bottom range but doenst retake it
Target: Slightly below S/R Level 1
Good luck
]Disclaimer:
- This information does not constitute as financial advice and is only for entertainment purposes. I am not your financial advisor.
- You trade entirely at your own risk
- Make your own research
- Finance and trading is evil, capitalism is bad, duh

BMW stock will experience a bearish move , my expectation is ...BMW experience a bearish sentiment and now I don't recommend a counter_trend Orders.
😎💙
____________
Good luck my Friend

1.2&1.2 Or Diagonal !Greetings, dear friends. I hope you are having a productive week.
With the completion of Wave 1, it's crucial to determine the expected correction percentage for Wave 2. Remember, the strength of Wave 3 is highly dependent on the accuracy of our predictions. Let's make sure we get this right.
I want to share my market analysis ideas based on the Elliott Wave Principle with you.
I am a fan of this principle and follow all the rules and guidelines for analyzing the market.
However, please note that my ideas are based on my personal experience and may change over time.
If there is an error in my analysis, I am open to re-analyzing it from the beginning and learning from my mistakes.
It's important to understand that making an error in analysis is not a fault, but evading responsibility is.
No one can analyze financial markets with 100% accuracy, but it's remarkable how close we can get.
We analyze from multiple perspectives to consider all possibilities.
Let's mention a few opinions and ideas!
Based on mathematics.
I am still practicing to understand the Elliott Wave Principle better and hope to provide an even better analysis in the future.
Thank you for your continued support, and I look forward to our mutual success.
Best regards,
Mr. Nobody
Keep trying and never give up.
Good luck!

Duerr: BnR after prognosis cut After the cut of the 2024 prognosis the share price drop significantly. The pattern has all characteristics of a BnR and the 20th October candle is almost an hammer. We see a drop equal to two times the width of the lead in channel. The important low of 2022 was broken within day but not on a daily basis. So we may see either a quick V-shape rebound (black) or no or a small rebound to the upper bound of the third channel with a retest of the lower channel bound. In that case the resistance at 18 € is important. if the channel breaks the next resistance, the covid low is almost another channel width away.

Hornbach Holding - Wolfe Wave on the edge of a breakoutAfter the price slump following the last quarterly earnings hornbach consolidates. Given the daily chart this slumps was the 5 of a potential bullish wolfe wave now ready to break out.

BnR Pattern at MTUThe news with respect to the turbine issue induces a sharp price slump. In the chart we have all characteristics of an BnR pattern with a downmove of one channel . Recently, also the price has reached and taken the minimum Fibo Retracement which is a necessary condition for a local bottom

HOW TO: Use ChatGPT as your Trading-Coach & MentorIn this video, I explain how Traders can use ChatGPT 4 as their Coach and Mentor to accelerate their journey of becoming highly successful and professional traders.
ChatGPT's new image functionality enables this AI tool to help traders to transform their learning curves and build their capabilities at an unseen pace.

BAY.MOTOREN WERKE AG STBUY XETR:BMW
Tp : 112.50
sl : 89.00
if you have any questions do not hesitate to contact me.


Porsche Holding: Bottom formation 🔄The Porsche Holding share price is approaching the 78.60% retracement of the magenta target zone between €56.44 and €36.61. Here, we expect the low of the magenta wave 2, which has been dragging on since 2021. With the low formed, a reversal should then take place, and the price should rise well above the resistance at 60.18€.

1COV added to model portfolioCovestro has just been added as a 12.5% position to our model portfolio.
Some comments:
1. 7/8 qualifiers of Minervini's trend template are met and the stock is in a confirmed phase 2 uptrend.
2. Stochastic RSI are indicating an entry coming our of an oversold position.
3. This is a pullback entry following a healthy pullback over the last 2 weeks under low volume which allows for a low risk entry.
4. Relative strength of 1COV as measured against the SP500 is very high which makes that a momentum trade.
Here is the link to our updated model portfolio:
www.tradingview.com

Correction Not Yet FinishedIt is a little bit difficult to describe what I see.
2 different VWAPs(a rising and a having turned downward) indicate a bottom and on Friday we have re-entered a 3rd VWAP which is following the downtrend since 15th September.
In my opinion this says that we shall test the upper lines of the price band.
I know that this seems to be a bit strange but due to my experience this is the more likely outcome.
