Bottom of the RangeMunich Rueck held stable this year. Now we've seen the retracement of the rise since March by almost 38 %. However a further retracement is possible I consider the chance of a recovery from here. We have reached the bottom of the trading range which we are in since April and the current level of our favoured Moving Average.
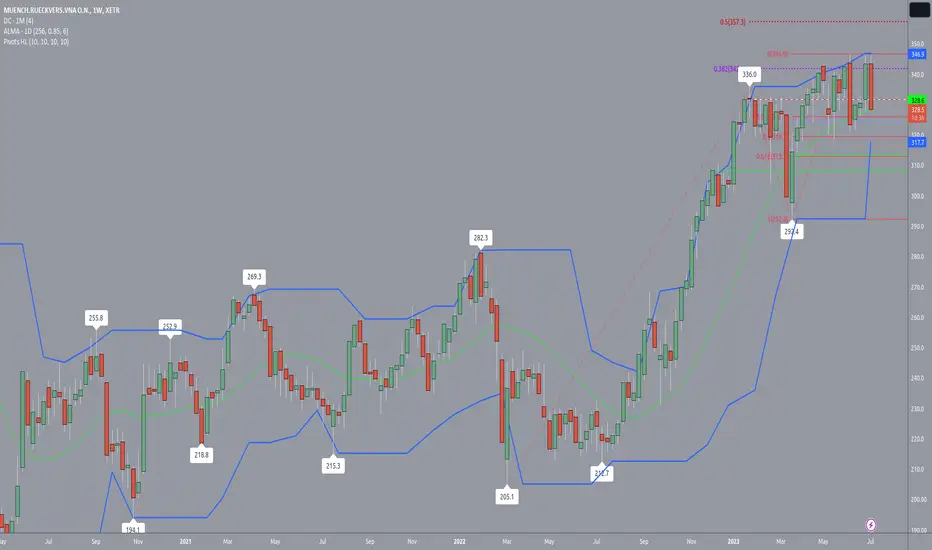
RetestWe are trading within an old(since January) range. The stock tried to break out twice in March and April but fell back each time. Since April we are back in the original range. We may consider this range being a bulls' pannant so that more tests of the upside are more likely as long as the downside has not been challanged convincingly.


Short Hannover ReCurrently there is a lot of gloom around the German economy, yet DAX is trading near an all time high. Looking to short German stx that look technically over-extended and where there is a strong risk reward to do easy invalidation/tight stops.

Short E.onE.on seems to have broken the support. I went short with a stop at the may high. Would expect a drop towards the 100sma, so target is 10,70ish at the moment.

Wait for Hugo BossHello,
The company looks like a great company to buy to the top. However buying from the current level does not make much sense. Wait for the share price to correct before placing the buy at around 49. The target rmains at the top with a stop loss at the bottom.
Good luck!

Adidas through the valley50D chart on German textiles maker Adidas provides an opportunity for a long chane. The distance to the ATH is approximately 86%.

$SBX STRONG BUYXETR:SBX Analytics
15.06.2023
Consideration under WEEK
Indications
- 80% decline since its launch
- Solid levels around @EUR20, @EUR14, @EUR4 (±10%)
- Stable for around 30 days @EUR3,90 => BUY
- Weekly RSI at ATL of ~21.5 => super cheap rn => BUY
- Moving Average 9/20: 20 >> 9, crossover not predictable and could take at lease 6-8 weeks => RISK
- Moving Average 100: huge distance for crossover => RISK (bad historical stock performance)
- ZLSMA (W): Candels getting closer, crossover likely in 1-3 weeks => Chance, BUY
- Chandelier Exit (W): Still on SELL since the end of February 2023, when price holds/improves slightly => STRONG BUY
- MACD (W) (fast 12, slow 26, close): negative red section getting declining, band crossover likely => STRONG BUY
- Parabolic SAR (W): positive development as indicator nears candels, intersection / crossover likely => BUY
- Increasing trading volume indicating strong demand at current price level
TA
- Within solid downtrend for >450 days.
- Solid bounce backs each time support line got touched (yellow corcles)
- Massive breakdown after support got lost (red circle) => support line shifted / converged into new line (white)
- Stock touched new support line at green cicle, clean bounce back.
- Next reverse expected at a/ strong resistance (grey bar) AND at resistance line => same level => perspective outlook at +150% profit goal at around EUR 10 => BUY
- Next bounce back expected @EUR 5.42 (purple dotted line), while still holding sick profit of +41%
Conclusion: STRONG BUY
Most of the important indicators stating clear BUY (much more than SELL or RISK). XETR:SBX is currently under massive retail pressure but faces strong demand at current price level, which is only reasonable when considering the mentioned aspects. Most BUY rating certainly is the bounce back from shifted support level in combination with probable Chandelier Exit BUY indication.

ADIDAS breaking outAdidas seems to be beaking out of a bull flag type consolidation. I would expect it to appreciate into the 175/180 region.

RSI is oversold and looking for a reversalAccording to my models, Zalando is undervalued, oversold and technically close to the points where we can expect a reversal.
I open a long position at this point.
Not investment advice.

New AttemptAfter the Shooting star in the first and the following sharp decline in the second March week one might have expected a deeper correction of the rise since September. However the bulls were able to regain most of the terrain lost almost immediately. The market may have to pause after both bulls and bears are exhausted now. But it seems that there is no will to get out of the airline ahead of summer. May be not in the after Easter week but then we may be happy of new highs.

Miles under your tire...This tire producer looks juicy. Seems like it is building an inverted head and shoulder pattern. This is generally a end of trend pattern. And looks like we build a wide double bottom with the lows in Mach 2020 and September 2022.
It' worth a buy in my humble opinion.
I see a potential target at €115.

VW BULLISH SENTIMENTVolkswagen plans to focus solely on profitability amid cutthroat competition from the Chinese automakers. Volkswagen said it would not participate in the discount battle like its Chinese competitors. Instead of expanding its market share and sales volume, the German carmaker plans to leverage its strong market position to build a sustainable business.
The company's deliveries for April 2023 jumped 39% year-on-year to 720,200 cars.
Risk Disclosure: Trading Foreign Exchange (Forex) and Contracts of Difference (CFD's) carries a high level of risk. By registering and signing up, any client affirms their understanding of their own personal accountability for all transactions performed within their account and recognizes the risks associated with trading on such markets and on such sites. Furthermore, one understands that the company carries zero influence over transactions, markets, and trading signals, therefore, cannot be held liable nor guarantee any profits or losses.

Mercedes-Benz Group: Parking 🚘Mercedes is about to park wave (2) in magenta in our green target zone between €67.31 and €77.90. Once this top is placed, the share should continue the overarching downward trend, dropping below the support at €60.72 and (after a short countermovement) further southwards. There is a 30% chance, though, that Mercedes could leave the green zone on the northern side and thus climb above the resistance at €77.90. In that case, we would expect the share to develop a higher top first before heading downwards. Wave alt.B in green would then expand into the magenta-colored zone between €84.44 and €89.37.

Just a thought about how things will go, judging by historyI don't have much to say about what we see here. In my perspective, there appears to be a bearish flag forming, indicating a potential downward trend. Additionally, considering the previous spark in RSI and the confirmation by MACD, I believe we now have a second signal suggesting further price decline.

Good stock to keep into your portfolio long termAllianz has started 2023 very positively. First quarter results are solid, shares buyback has been announced, together with a good 5% ish dividend and further investments. I am looking at entering a long position for the long-term. In case of short-term downfall (1 or 2 years from now), there will be possibility of cost-averaging the position.
If you want to swing trade this stock, I would wait for confirmation of a breakout of the 230 level, or wait for a possible retracement to 180. Keep your risk management in check.

Quick analysis on 2HRADear German traders, on 2HRA you can see on the chart thet the price just canceled what seemed to be a breakout of the channel the price is consolidating at, before you buy it you must wait for the price to break the resistance level with a higher volume than the highest one we have currently

Quick analysis on 2GBDear German traders, I made an analysis for you on the 2GB to inform you that it's not the appropriate time to buy it, you must wait for the price to break the tough resistance level it keeps pulling back on for the past year.

Analyzing Tesla's Potential Decline: Waikoff Analysis, RSI LevelI anticipate that Tesla will experience a decline based on the Waikoff analysis. Another supporting factor for a short position is the current RSI level, which suggests potential downward movement. Furthermore, the last candle from yesterday's trading session bears resemblance to a shooting star pattern, adding to the bearish outlook.
My first target range for Tesla is set at 120-126 EUR.

It's NO SECRET, I'm shorting AdidasIt's no secret that I've been looking to short Adidas for weeks before the Bearish Bat Pattern show up.
As a trader, I love to wait for the precise price with candlesticks confirmation before engaging my trade; hence I miss the first opportunity.
And that's ok!
In trading, I have this philosophy that is better to miss a trade than to engage in a trade at a price of disadvantage.
So here I am, trading for the past 18 years.
At this moment, I'm waiting for the Bearish Shark Pattern to form up on the 8 range bar chart to give me a second chance entry to get on this ride.

Porsche P911 Distribution phasePorsche seems to be in a distribution phase after its 48% run from the bottom that was a few days after listing. if there will be a second restest of the resistance without a break out a move to the downside is very plausible in my opinion


Nordex's YoY losses up 133% and Debt/Equity ratio up 54%FUNDAMENTAL ANALYSIS
Current liabilities increased 47% up to €3.4bn in 2022 from €2.3bn in 2021. Non-current liabilities decreased 37%.
Debt to Equity ratio (2022) = 4.42x
Debt to Equity ratio (2021) = 2.87x
Losses YoY increased 133% to €522 million. EBITDA turned negative in 2022 to -€244 million from €52,672 million in 2021.
Almost all Guidance provided in March 2022 was exceeded downwards except for Sales Guidance.
Positive side: Sales increased 4.58%.
TECHNICAL ANALYSIS
Since April 6, the company has entered into a downward trend that in Oct 2022 attempted to turn around. However, the banking crisis and inflation fears persist in a way that Nordex's stock performance graph experienced the appearance of a Bearish Bat pattern whose prophecy together with its recently issued FY 2022 results could materialise in the following days and weeks to come.
