Rheinmetall AG Completes its growth.Ukraine's freezing war with Russia is approaching. The market is already factoring in a colossal infusion into this company. I see a reversal pattern.

Due to Geo Political changes in Europe grow expected. These types of rates are always difficult (but fun) to analyze, because there is no history. This one has gone from always low to sky high. But I can still do something with it. You see again, classically according to the Fibonacci model, that the rate has shot up from 400 to 1280, from the blue area straight through the green and yellow. The red area is the outperformance, but you don't know that because you don't know where the rate ends.
You can put a reserve Fibonacci chart against that and then you suddenly see the purple area appear up to 2700. If I subdivide that again, resistance arises on:
1884
2064
2180
2313
2459
2700
The group was promoted to the DAX, Germany's main stock market index, in March 2023. It is the largest German and fifth-largest European arms manufacturer, and produces a variety of armored fighting vehicles and armored personnel carriers, both wheeled and tracked.

BMW: Stability, Innovation, and Opportunity in a Changing WorldIn times of market turbulence, great opportunities often lie hidden beneath temporary setbacks. Recent tariff-related ripples may have rattled BMW’s price, but for those looking to invest for the long haul, this dip is a golden opportunity to buy into one of the world’s most reliable automakers.
www.youtube.com
Resilient Amid Tariff Turbulence
Global trade frictions and tariff uncertainties have impacted many companies, and BMW is no exception. Yet, unlike many peers that retreat during such times, BMW remains steadfast—confident in its strategy and outlook. With industry insiders predicting that these tariffs are only temporary, BMW’s fundamentals remain ironclad. Its robust global presence and proactive planning have positioned it to weather these short-term shocks and bounce back stronger.
A Diverse, Future-Ready Product Lineup
While some high-profile names in the auto space chase trends with empty promises, BMW consistently delivers. Rather than focusing solely on electric vehicles like Tesla, BMW offers a balanced portfolio:
- Low-Emission Fossil Fuel Cars: Advanced, efficient engines that still serve a significant market segment.
- Hybrid and Electric Vehicles: Designed for the evolving demand for cleaner mobility, these models blend performance with environmental responsibility.
- Pioneering Hydrogen Technology: In collaboration with strategic partners, BMW is blazing a trail in hydrogen-powered vehicles—a potential game changer that ensures adaptability as the energy landscape shifts.
This diverse lineup not only meets current market needs but also positions BMW at the forefront of future mobility, delivering real, tangible products that work.
World-Class Manufacturing and Advanced Robotics
BMW’s reputation for engineering excellence isn’t just about beautiful design—it’s rooted in its state-of-the-art manufacturing. The company has embraced advanced robotics and automation, ensuring precision, efficiency, and consistent quality. With production facilities spanning the globe—including significant plants in the United States—BMW solidifies its stature as a truly international enterprise.
A Stable, Dividend-Paying Investment
In a market that often rewards volatile “meme” stocks and empty promises, BMW stands apart as a beacon of stability. Unlike Tesla, which currently pays no dividends, BMW offers a juicy dividend yield of over 5%, providing investors with regular, attractive returns. This dividend, coupled with its solid operational fundamentals, makes BMW a safe bet—one that rewards shareholders consistently even during turbulent times.
The Time to Invest Is Now
BMW is more than just a carmaker—it’s a symbol of resilience, innovation, and pragmatic progress. While market chatter may cast doubt amid temporary tariff-induced lows, the company’s diversified product mix, global manufacturing footprint, and commitment to delivering real, advanced technology create a compelling investment thesis.
For investors seeking stability, reliability, and the promise of long-term growth, BMW offers an opportunity to ride out the storm and benefit from a future where the company’s innovations in hybrids, electrics, and hydrogen continue to shape mobility worldwide. Now is the time to look beyond short-term market jitters and invest in a legacy built on quality, performance, and consistent returns.
Embrace the opportunity—BMW’s bright future is not just a promise; it’s already in motion.
XETR:BMW SIX:BMW NASDAQ:TSLA NYSE:GM NYSE:F

Flag Flutters Precariously: Navigating the Sky of Greed.The Siemens flag, once a symbol of ambition, now hovers in the sky of opportunistic buyers. Previously, it was plummeting toward the ground, but a swarm of butterfly-like buyers, armed with unwavering determination, managed to lift it back up using a sturdy candlestick.
However, in this latest turn of events, the flag now hangs precariously between two vast voids, abandoned by the overconfident grip of greedy crab buyers. Their hold appears too weak to keep the flag aloft, and it seems destined to fall from the lofty height of 214 euros—ironically referred to as the "golden level of the crab." It seems that gravity, much like the harsh reality of the market, inevitably prevails.

Deutsche Bank AG to 21 EuroDespite the chaos with Credit Suisse European banks in General are printing some excellent setups. What is the reason for this? No idea.
On the above 2-month chart:
1) A strong buy signal (not shown) prints with price action breakout from resistance that has been active since 2007.
2) Regular bullish divergence. No less than eight oscillators this time. Four to five oscillators printing on this time frame is incredibly powerful but eight?!
3) Inverse head and shoulders pattern. Confirmation is price action closing above 10.50 and staying there or above for a week or two. On confirmation a target of 21 euro should be expected.
4) The yellow line is the 21/2-month EMA. Notice the first attempt to hold as support has failed? (Orange arrow). This was the first attempt to hold as support since July 2005. Confirmation of support is price action at 10.50 and above by the month of May.
5) Almost EVERY idea on tradingview is 'short' / Bearish! Ww is the 5%. What in?
Is it possible price action falls further? Sure.
Is it probable? No.
Ww
Type: Investment
Risk: <=6% of portfolio
Timeframe: Don’t know.
Return: 110%
Stop loss: 7.20

Late cycle. Medicine ++In November 2023, it was reported that German chemical concern Bayer AG was considering options for splitting the business due to weak financial performance.
Management considered several options:
spinning off the health products or agricultural fertilizer businesses into a separate company;
maintaining a three-division structure but getting rid of non-core assets;
successive splits into three independent companies, each retaining its own divisions.
In January 2024, it was reported that Bayer announced a business restructuring and job cuts. The plan was to simplify the management model, eliminate bureaucracy and speed up decision-making processes. The job cuts were expected to begin in the coming months and should be completed by the end of 2025.
This company could go the same way as deutsche bank.
Get up off your knees and grow a few times over. =)

BMW - Long-Severly oversold
-Very low price
-High Volatility flowing into the stock
-If tarrifs dropped on EU cars can start the new trend

P911 - has bottomed :DHi guys, I belive this is it. We have landed and now its a time to buy. Buy as much as you can!

Why It’s a Good Idea to Buy Porsche Stock During a Market CrashStrong Brand with Loyal Customers
Porsche is a premium brand with global recognition. Even during downturns, demand for luxury products like Porsche remains relatively resilient.
Fundamentally Solid Company
Porsche has strong revenue, high profit margins (some models generate over 15–20% margin), and a reputation for financial discipline.
Undervalued During Crashes
In a market crash, even high-quality companies are sold off irrationally. This creates a rare opportunity to buy at a discount to intrinsic value.
Healthy Balance Sheet with Low Debt
The company maintains a solid financial position, making it more capable of weathering economic storms.
Attractive Dividend Yield
Porsche pays dividends, and when the stock price drops, the dividend yield becomes more attractive to long-term investors.
Backed by Volkswagen Group
As part of the VW Group, Porsche benefits from shared technology, resources, and strategic support, adding an extra layer of stability.
📈 Why Porsche Is Likely to Recover After a Crash:
Strong Demand for Luxury Vehicles
The premium segment tends to recover faster post-crisis, as high-net-worth individuals are less impacted and quicker to resume spending.
Innovation & EV Leadership
Models like the Taycan prove that Porsche is a frontrunner in high-performance electric vehicles, well-positioned for the EV revolution.
Global Presence
Porsche operates across major markets—Europe, the U.S., and Asia—offering multiple growth channels once global recovery begins.
Limited Shares – High Demand Potential
After Porsche AG’s IPO, only a portion of shares are publicly traded, meaning limited supply. Once demand returns, this can drive the price up sharply.
Long-Term Vision & Prestige
Investors see Porsche not just as a carmaker but as a long-term luxury mobility brand with staying power and vision, which boosts confidence in its recovery.

SAP NOISE CANCELLATION. Rising wedge finding middle now. expect continued rise after correction. real fall wont be until a retest in a couple of years. hard corrections until we level out. good luck

Buy Idea on ADIDAS (ADS)Based on :
- Quinquennial Cycle and other years with similar european monetary policies
- Quantitative data
- Divergence on POIV (with 6E open interest) and Progo
- Undervalued Conditions
- Strong Demand zone covered by weekly demand as well

DHER: 90 % upsideI think that everyone agrees that primary target is around 40 and on break we'll get to the upper 50 Region. Best Buy of this year together with EBS

Why Invest in RheinmetallWhy Invest in Rheinmetall
Rheinmetall’s defense segment accounts for a significant portion of its revenue and profits, providing a stable and growing revenue stream due to increased global defense budgets. In recent years, global defense spending has risen, driven by geopolitical tensions and security concerns, particularly in Europe and NATO countries. Rheinmetall benefits from this trend with a focus on:
• Military vehicles: The company produces combat vehicles, armored trucks, and defense platforms, which are in high demand due to modernization efforts in several global defense forces.
• Ammunition: Rheinmetall is a leader in supplying ammunition for land, air, and naval forces, with long-term contracts in place to supply NATO forces.
• Defense electronics: The company produces advanced radars, communication systems, and sensor technologies for military and security applications.
Rheinmetall has a strong order backlog, which is a positive indicator for long-term growth. With long-term defense contracts with governments in Germany, NATO, and other international defense forces, Rheinmetall enjoys visibility and stability for the coming years. This gives investors confidence in sustained revenue streams, particularly in the defense sector, which is typically less sensitive to economic cycles.
In addition to its defense business, Rheinmetall is a key supplier in the automotive sector, particularly in areas such as electrification and safety technologies. The company’s automotive division produces components for electric vehicles (EVs), hybrid vehicles, and safety systems such as braking systems and collision sensors. This diversification makes Rheinmetall a dual-sector play, giving investors exposure to both the defense and automotive industries, both of which are poised for growth.
• Automotive Safety Systems: Increasing demand for active safety and driver assistance systems in the automotive sector provides Rheinmetall with solid growth prospects.
• Electrification: The company is expanding its presence in the electric vehicle market, benefitting from the global shift toward sustainable transportation.
Rheinmetall is highly focused on research and development (R&D), ensuring that it remains competitive in both the defense and automotive markets. The company continues to develop next-generation technologies such as cybersecurity solutions, autonomous military systems, and electric propulsion systems for vehicles. This commitment to innovation ensures that Rheinmetall remains at the cutting edge of both its sectors.
Rheinmetall offers a relatively attractive valuation compared to its peers in the defense sector, with a P/E ratio of 18x. The company's strong operating margins and high return on equity highlight its strong financial health, making it an appealing option for value-oriented investors. Additionally, the company’s low debt-to-equity ratio ensures financial flexibility, further enhancing its attractiveness.
Strong Buy Recommendation
In conclusion, Rheinmetall AG represents a strong investment opportunity, offering investors a diversified portfolio with strong exposure to both defense and automotive markets. The company benefits from long-term defense contracts, a growing order backlog, and strong positions in military vehicles, ammunition, and automotive safety systems. Its commitment to innovation and technological advancement, coupled with a strong balance sheet, makes it an attractive option for those seeking exposure to the growing global defense and automotive technology markets.
With solid revenue growth, high margins, and a relatively attractive valuation, we recommend Rheinmetall AG as a strong buy for investors seeking a balance of growth potential, stability, and defensive characteristics in both defense and automotive sectors.

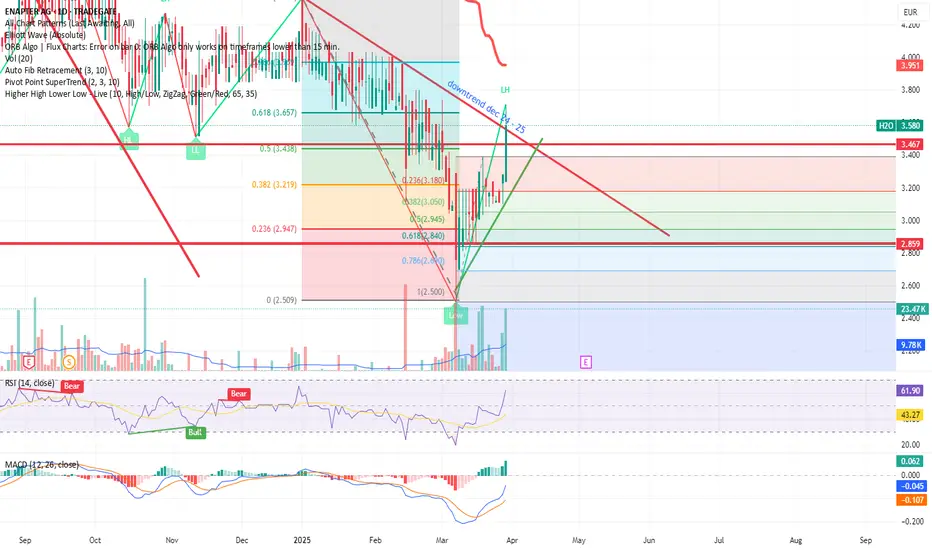
H2O Bottom reached, time to riseTRADEGATE:H2O Seems the downtrend ended now and might rise again to the target level shown
according to www.enapter.com this might push further up the stock
Drägerwerk AG LONG with TP at 61 EURO (BUY & HOLD < 12 Months)Drägerwerk AG is undervalued at present. There is potential for long-term momentum with a TP at 61 Euro or beyond. This could play out within a period of up to 12 months, while there is evidence that it might hit TP until end of this year.

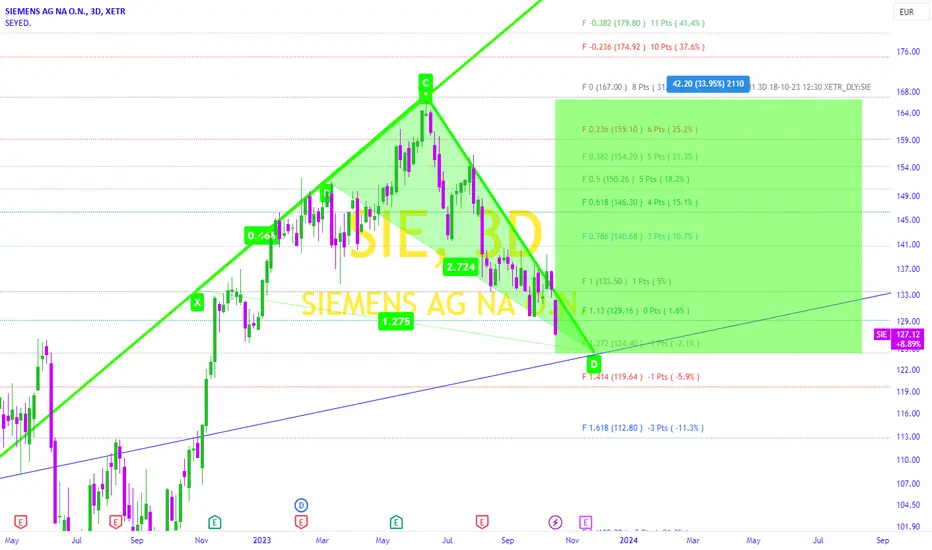
Effort of the Young Green Butterfly to Raise the Siemens Flagthe detail is shown in the above Chart.
I made this Idea based on Candlestick Analysis and Fibonacci Tool .
The Buyers' Crab could reach the highest point at the price of 167 euros.
The Bearish trend started and siemens flag is falling and approaching to the golden level of buyers crab .
The past trend of sellers' candles has formed a motivated green butterfly pattern
So we can expect this young Butterfly to raise the Siemens flag again.
Siemens Is Great .
Good luck.
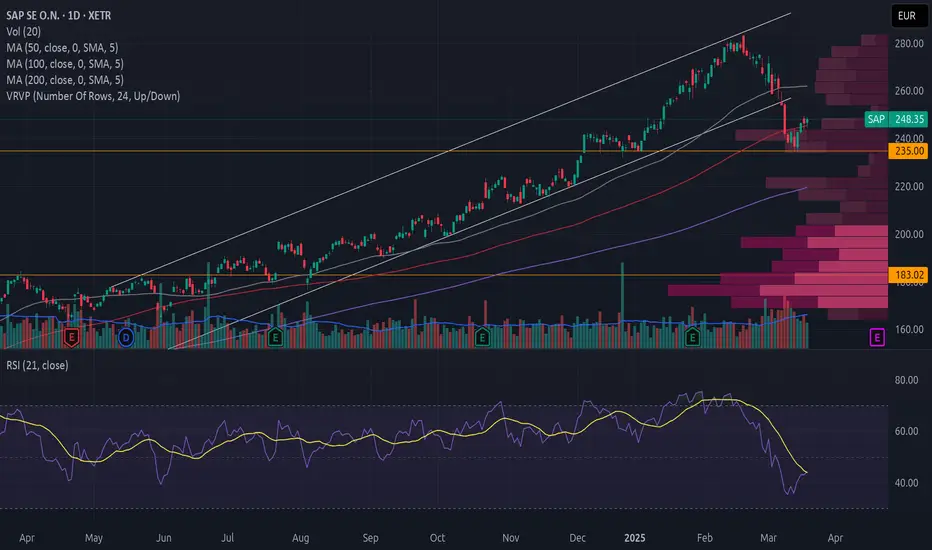
Should You Buy SAP After Its Price Drop?
SAP has broken down from an upward trend with high volume.
The price decline has stalled around the resistance level at 235. The volume profile shows a sharp drop in trading activity at this level when prices approach from both below and above, making this a significant resistance zone.
There are no reversal formations as the price exits the trend.
The price is recovering, but without strong volume. Moreover, the negative volume balance further weakens the stock. The same applies when prices are just below a green cloud in Ichimoku.
From a fundamental perspective, the decline likely stems from concerns that SAP was overbought, combined with weakness in U.S. tech stocks. However, SAP is a European company poised to benefit from increased defense spending. These funds are not only for weapons and ammunition but also for innovation, data security, cyber warfare, infrastructure, and more.
I have chosen to reallocate some of my U.S. tech holdings into European investments and have bought SAP.
Always conduct your own research and assessment before making buy or sell decisions.
Thyssenkrupp AG Impulse Nearing CompletionThe impulsive move is close to ending, indicating a potential reversal. A minimum 9% pullback could be expected.
Traders should watch for confirmation signals before taking action. 📉🔍

Rheinmetall AG: A great defence company to consider About the company
Rheinmetall AG is a holding company, which engages in the provision of development and sale of components, systems, and services for the security and civil industries. It operates through the following segments: Vehicle Systems, Weapon and Ammunition, Electronic Solutions, Sensors and Actuators, Materials and Trade, and Others. The Vehicle Systems segment offers a diverse portfolio of vehicles, including combat, support, logistics, and special vehicles. The Weapon and Ammunition segment includes products and solutions for threat-appropriate, firepower as well as comprehensive protection. The Electronic Solutions segment is involved in the chain of effects in the system network, from sensors and the networking of platforms and soldiers to the automated connection of effectors, as well as solutions for protection in cyberspace. The Sensors and Actuators consists of a product portfolio with exhaust gas recirculation systems, throttle valves, control dampers, and exhaust flaps for electromotors, solenoid valves, actuators and valve train systems, oil, water, and vacuum pumps for passenger cars, commercial vehicles, and light and heavy-duty off-road applications, as well as industrial solutions. The Materials and Trade segment focuses on the development of system components for the basic motor.
Summary of business
Next earnings: Wednesday 12th March 2025 (Full year 2024 results)
Given the latest developments, Europe needs to be able to defend itself against Russia or any other enemies, with or without the United States. Invasion by Russia will remain a key risk for the foreseeable future to Europe and it needs to move fast and arm itself. For now, Europe’s first priority is to continue supporting Ukraine – Ukraine’s experienced military is currently the most effective deterrent against a Russian attack on the EU due to its experience on the battle ground. If Ukraine decides that a US-Russian deal to end the war is unacceptable Europe needs to step in first. A recent example is when the United States cut off military intelligence to Ukraine, prompting the United Kingdom to step in and provide intelligence support instead. Should the United states, continue to pull out of Ukraine, we expect Europe to quickly fill up the gaps.
We expect European defence spending and capabilities to continue growing for the next number of years. As a result, we see opportunity for Rheinmetall. Rheinmetall is well positioned to benefit from the increase in budget allocations towards defense, especially as Germany is expected to play a key role in Europe’s defence as US military support declines. Since Europe is coming from an economic crisis, spreading costs over time looks like a feasible route Europe will take for this. Rheinmetall has a well-diversified portfolio across geographies and platforms, with 70% of its revenue from its defense business and 30% from its civil one. Escalating global security concerns are driving higher growth in the defence market as many countries in Europe have underspent over along time. European nations are expected to boost defence budgets to a minimum of 2% of gross domestic product, a trend likely to accelerate due to the Russia-Ukraine war. This situation offers a significant opportunity for Rheinmetall to benefit from its well-diversified geographical presence and product portfolio.
On Thursday 06th March 2025, European Union (EU) leaders convened in Brussels for an extraordinary summit focused on defence and Ukraine, amid growing concerns over Europe’s security architecture and its financial underpinnings. The summit takes place in the wake of Washington’s abrupt suspension of military aid to Ukraine, placing increased pressure on the bloc to enhance its own defence commitments. During the meeting European Commission President Ursula von der Leyen said the 27 EU leaders are “determined to ensure Europe’s security and to act with the scale, the speed and the resolve that this situation demands. We are determined to invest more, to invest better and to invest faster together.” She added “These are extraordinary times. They call for extraordinary measures. With REARM Europe, we'll equip our Union with the capabilities it needs to support Ukraine and defend itself”. This reinforces the fact that more money will flow towards the defence industry and will more likely benefit Rheinmetall.
The EU’s executive arm expects around 650 billion euros ($702 billion) to be unlocked through this initiative over the next four years. Even if only 30% of that trickles down to Rheinmetall each year — about 48 billion euros — it would more than triple the company’s current revenue. This makes the stock a strong buy from the current price with a price target of EUR 1800.
Rationale for
As the capacity leader in ammunition production, the company is well-positioned to capitalize on surging demand through long-term framework contracts lasting up to 10 years.
Its strong incumbent role in the European Strategic Safety Initiative and the F-35 Lightning II fighter jet program — two of the largest air defence projects — will drive sustained production and revenue growth for decades.
Risks to consider
Rheinmetall's sales heavily rely on military funding, making its revenue stream inherently political and subject to uncertainty.
Geopolitical risks and shifting alliances may restrict the company's ability to deliver products to certain countries like the USA which is a big market.
Despite earnings growth, global defence stocks, including Rheinmetall, face persistent valuation pressure due to rising ESG-driven constraints on investment mandates.
Revenue by country
Europe: EUR3.40B
German: EUR1.72B
Asia: EUR817.00M
Other regions: EUR642.00M
North, middle and South America: EUR594.00M

YSN | Secunet Security | FA & TA | Its encrypted, BabyFA
Secunet is a German based company. Working field is IT security highly focused on encryption. It received since 2014 atleast 3 ongoing big contracts (SINA, Golden Reader Tool and easygate by the German Government agency and departments. With the current financial situation of the German government it could possible have negative effects here and is in support with my TA as i expect price to go further down.
Its also so mention that Profit margins are currently almost half than it was in the previous years (11.4 to 6.5). However the current earnings forcast is 10.4% per year for the next 3 years and as the debt level is low + renvue is still high i see a potential for the next coming years.
TA
Its currently in a volatile downtend that seemed not over yet. The two buy zones are based on the next two big S/R levels. As i want to have exposure and to hold long term anyways i marked out 2 areas where i plan to buy.
Entry: Price reaches the buy zones
Invalidation: none
S-L: None, as long- term- hold)
Target: 50% of the recent Swing in confluence with a strong S/R level that caused the current downtrend
Good luck
Disclaimer:
- My posts are mostly for my own journaling
- This information does not constitute as financial advice and is only for educational purposes. I am not your financial advisor.
- You trade entirely at your own risk
- Make your own research
- Finance and trading is evil, capitalism is bad, duh ;)

Volkswagen AG (VOW) – The Cheapest Military Stock in Europe? TP1: €150 – Short-term breakout
TP2: €180 – Mid-term resistance
TP3: €250 – Long-term revaluation target
Why Are We Bullish?
🔹 Defense Sector Entry?
-VW exploring military production, with CEO Oliver Blume confirming interest.
-Idle plants may be repurposed, potential Rheinmetall partnership in the works.
-Rearmament boom – Rheinmetall’s valuation already surpassed VW’s.
🔹 Financial & Growth Catalysts
-Q4 sales up 21%, 7.0% margin, 2025 revenue target +5%.
-€1B cost-cutting, strong EV & U.S. market expansion.
🔹 Bullish Technicals
-MACD Bullish Crossover + Green Histogram Bars confirm momentum.
-Bounced off long-term trendline support, signaling a strong reversal.

The only direction is up.Sometimes, you can enter a trade without an overarching structure or a correction level guiding the direction. This is a prime example. After an intriguing sideways movement, marked by almost textbook ups and downs, we saw the range break briefly to the downside—a classic range spike, or as some call it, a fakeout.
This fakeout has trapped short-sellers, and as their positions get liquidated, they’ll fuel upward momentum. Interestingly, the range spike ended precisely at the resistance line of our broader structure, highlighted in red.
Given this, I don’t expect us to revisit the target level, and the structure is effectively complete. This is an ideal spot for a long position. Even without bullish structures forming, the chart has only one direction to go from here—up and to the right.

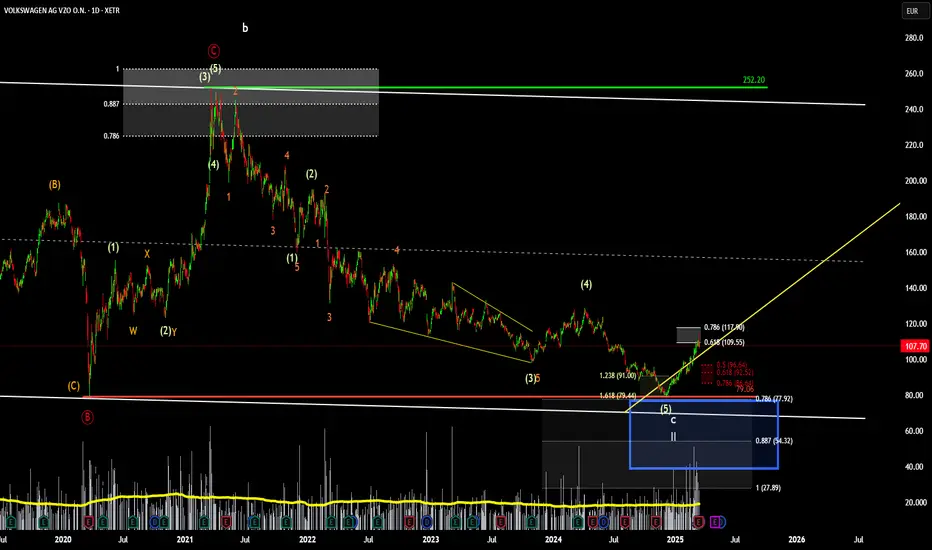
VW - stock may have turned around (?)VW - has had its fair share of bad news lately, however, panic and fear often times is at its peak when price is close to find the bottom.
Looking at price action and price targets it seems the wave C of II could be over which is also indicated that price bounced from the 161.8 fib expansion of wave 4 of C. Ever since then the stock has seen a steady rise that was also supported by good volume.
Now it has reached the 61.8 retracement of wave 5 and usually around that fib level price will stall and consolidate. I can even see a 5 wave motive wave up.
Now, we need to see how the price action looks like in the coming days and weeks. Hopefully it will make a higher low at around 50-61.8 % fib retracement and from there I would be looking to long the stock. The upside is quite impressive as the price may rise with over 300%.
For now, we remain neutral and are watching what happens next.