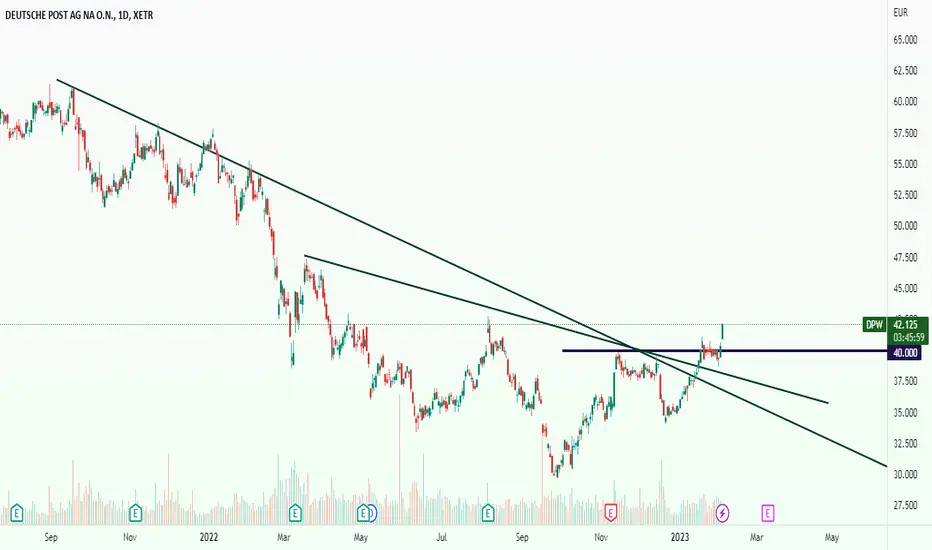
DEUTSCHE POST ,,, Buy opportunity Uptrend
It's passed of a major price level and i suppose uptrend has been started from here. Set a sure SL for it.
Sartorius AG LONG Signal createdLooking on this weekly chart:
Price broke the triangle pattern to the upside
Price is over all moving averages
Looking at the last 10 years: Sartorius has a bullish seasonality until summer
Good trades, folks!

HFG.DE Hellofresh high probability to move above its 200MAHellofresh growth is unabated with +31% revenue growth yoy and active customer growth +8.2% yoy, also contribution margin performance increasing by 24% despite inflationary headwinds. Any stock price to the upside had been penalized recently and it is expected the stock to recover. Expect some 30% upside with 15% stop loss. If the velocity to the upside is high - very probable the stock recovers even more.

Trading Idea - VW/PORSCHE Pair Trade Pair Trade:
#VW (Vz) LONG
#Porsche SHORT
VW and PORSCHE have a correlation of 84%. Reason enough to try out a pair trade. Currently the values have drifted apart by approx. 7%!
Porsche is currently performing better (relatively), which means a SHORT signal. VW, on the other hand, is lagging somewhat behind!

PAH3 // Flag formation Resistance over close is a mustIn order for the formation to be valid, closing on the wedge indicator is a must. Pay attention to the wedge resistance in the weekly time frame.

Varta SHORTHi we go for DIP short. All indicator looked same situation we go down :) Good profit friends.

Rheinmetall bullish ascending triangleThe ascending triangle points to a potential increase in the value of Rheinmetall's stock. These indicators include a bullish trend in the stock's price over the past several months, positive momentum, and strong support levels. Additionally, historical data shows that Rheinmetall's stock tends to perform well during times of military threats or escalations, which may indicate that current global events could be contributing to the stock's upward trend.
Hopefully, the war in Ukraine will come to an end, but Rheinmetall is still looking strong, possibly indicating an upcoming real-world event.
It is important to note that technical analysis is not a guarantee of future performance and should be considered alongside other forms of analysis such as fundamental and news analysis. Additionally, it is also important to consider the company's overall financial health and any recent company-specific news or announcements.

not just writing what im not supposed to writemeaningfull blabla and so on and gosh its a very brief description

Deutsche Boerse DB1 - Continue to drop or reversal?XETR:DB1
Using HeikinAshi candles and daily TF on Deutsche Börse shows that $DB1 movement is in good agreement with ma (9-60) and rsi. Each price drop (from start until rsi reversal from 30) usually takes 13 to 70 bars. Currently we are at the 23th-bar.
Due to current doubts in market, it can continue to drop and test both support 1 and 2 but the recent observation shows that it is also a good point for its reversal.
Next few days are critical for $DB1 to show if it continues to drop or reverse.

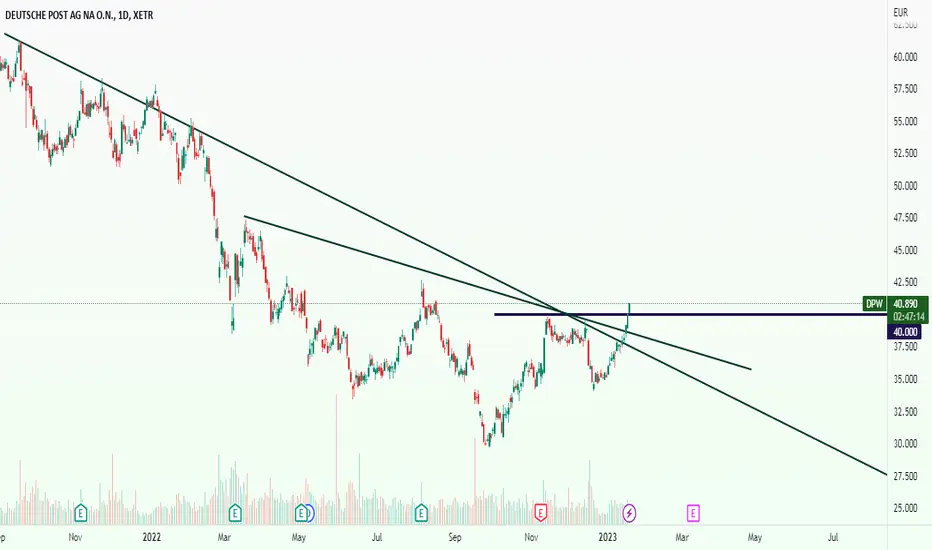
DEUTSCHE POST ,,, Based my strategy, This chart has started new uptrend and entry suggested by setting a sure SL for the buying position.
LIN: technical rating might increaseThe stock is working in a larger inclining channel pattern - supporting a bullish underlying trend.
Furthermore, a complex Eliott wave count is busy unfolding (see the red A, B, C, D and E).
Eventual upside to 333 and 346 seems likely.
Stop-loss at 288.
Key resistance at 314 and key suppport at 271.
Technical rating: medium


Porsche ( $P911 ) Short ideaOne of the iPOs that I've tracking, and following a standard pattern. Together with a short term (or likely more) top in EU indices, we should see this go much lower after the initial move liquidating early shorters and now FOMO buyers. Red line is stop loss, Green lines are TP1 and 2, respectively. GL

AXA - XETRA in EUREverything mentioned in the chart.
In Elliott Wave perspective often shares started on a higher level, formed a TOP in the past and than turned down to a longer lasting correction. - like AXA did. More information in the near future.

ZAL long 65–130% gainsZalando showing relative strength
Increased buying volume around 20–25€
RSI above 50
Breakout 80 MA
TP1 30€ or waiting for reversal to 25€
then
TP2 40€
TP3 50€ exit before correction
25€ is also high volume note of 2022, expected to become new baseline support

MBG // cup handle formationAlthough there is a cup handle formation in the chart, the targets are determined according to Fibonacci.

STELLANTIS// Cup handle formation. Resistance breakdown requiredAlthough there is a cup-handle formation on the chart, the targets are determined according to Fibonacci. Let's look for closures where I indicated with X for the formation.

VNA // broke the enemyPrices broke the low. Targets are determined according to fibonacci. As the price stays above the wedge, the direction is up.

Going short for LHAwill wait for the trend to respect resistance. then there will be a bearish trend.
Bullish indicator
1- Bearish butterfly formed
2- There is strong resistance at $9.059

BMW Long Resault: 13.5% Profit✅According to the pullback, the resistance is broken and the pullback confirmation can be entered into a buy position with the target of the specified high level.
Stay with me to get more analysis after following me by sharing with friends and leaving a comment.
According to my risk and capital management system, the risk of each trade is one percent per position.
What do you think about this analysis and other analyses?
What symbol would you like me to analyze for you?

BMW, longAccording to the pullback, the resistance is broken and the pullback confirmation can be entered into a buy position with the target of the specified high level.
Stay with me to get more analysis after following me by sharing with friends and leaving a comment.
According to my risk and capital management system, the risk of each trade is one percent per position.
What do you think about this analysis and other analyses?
What symbol would you like me to analyze for you?

Going long ADsBullish Indicator
1- Trend Reversal Dow theory Higher High and Higher lows
2- Inverted hammer Candle formed
3- Trend line breakout

VONOVIA SE - Long IDEAVonovia SE is a European listed holding company which engages in the management of residential units.
Price is back to at an attractive level and has formed a double bottom. A pull back to 25 is possible and will give a better risk/reward .
T/P and S/L on the chart.
