SAP SE bearish scenario:The technical figure Pennant can be found in the daily chart in the German company SAP SE (SAP.de). SAP SE is a German multinational software company. It develops enterprise software to manage business operations and customer relations. The company is the world's leading enterprise resource planning (ERP) software vendor. SAP is the largest non-American software company by revenue, the world's third-largest publicly traded software company by revenue, and the second largest German company by market capitalization. The Pennant has broken through the support line on 17/08/2022, if the price holds below this level, you can have a possible bearish price movement with a forecast for the next 6 days towards 89.85 EUR. Your stop-loss order, according to experts, should be placed at 94.47 EUR if you decide to enter this position.
SAP SE has announced the acquisition of Askdata for an undisclosed amount to tap the growing demand for data and analytics solutions.
Per a research from Fortune Business Insights, the global big data analytics market is projected to reach $655.5 billion by 2029, at a CAGR of 13.4% from 2022 to 2029.
Risk Disclosure: Trading Foreign Exchange (Forex) and Contracts of Difference (CFD's) carries a high level of risk. By registering and signing up, any client affirms their understanding of their own personal accountability for all transactions performed within their account and recognizes the risks associated with trading on such markets and on such sites. Furthermore, one understands that the company carries zero influence over transactions, markets, and trading signals, therefore, cannot be held liable nor guarantee any profits or losses.

Upsize potential for VAG (VOW) due to EV salesVAG shows potential for doubling its share value in the next year due to EV sales.
Fundamentals:
VAG outplaced TSLA in Europe by sales of EVs in 2022 and has strong momentum which is backed by models ID.4 and ID.3 will continue.
eu-evs.com
Technicals:
- potential ending C (from ABC) -wave on weekly
- with the potential to end at the top of the channel on weekly - about 400 EUR/share
- 0.382 retracement from the spake in 2008 is at the same 399 level.

Allianz Germany Sun Storm Investment Trading Desk & NexGen Wealth Management Service Present's: SSITD & NexGen Portfolio of the Week Series
Focus: Worldwide
By Sun Storm Investment Research & NexGen Wealth Management Service
A Profit & Solutions Strategy & Research
Trading | Investment | Stocks | ETF | Mutual Funds | Crypto | Bonds | Options | Dividend | Futures |
USA | Canada | UK | Germany | France | Italy | Rest of Europe | Mexico | India
Disclaimer: Sun Storm Investment and NexGen are not registered financial advisors, so please do your own research before trading & investing anything. This is information is for only research purposes not for actual trading & investing decision.
#debadipb #profitsolutions

Infineon Germany Sun Storm Investment Trading Desk & NexGen Wealth Management Service Present's: SSITD & NexGen Portfolio of the Week Series
Focus: Worldwide
By Sun Storm Investment Research & NexGen Wealth Management Service
A Profit & Solutions Strategy & Research
Trading | Investment | Stocks | ETF | Mutual Funds | Crypto | Bonds | Options | Dividend | Futures |
USA | Canada | UK | Germany | France | Italy | Rest of Europe | Mexico | India
Disclaimer: Sun Storm Investment and NexGen are not registered financial advisors, so please do your own research before trading & investing anything. This is information is for only research purposes not for actual trading & investing decision.
#debadipb #profitsolutions

NigativeCurrently at an area of resistance. RSI and MACD negative divergence
The stock had a 100% up side. time to hit the breaks

Trading Idea - #DeutscheBankMy trading idea for Deutsche Bank - Sell / SHORT
Target: EUR 5.80
Deutsche Bank with a mixed outlook for the year.
Although DB performed well in investment banking, earnings were lower than in the second quarter of last year due to higher costs.
The sell target is based on last year's support levels.

SAP SE (SAP.de) bullish scenario:The technical figure Falling Wedge can be found in the daily chart in the German company SAP SE (SAP.de). SAP SE is a German multinational software company. It develops enterprise software to manage business operations and customer relations. The company is the world's leading enterprise resource planning (ERP) software vendor. SAP is the largest non-American software company by revenue, the world's third-largest publicly traded software company by revenue, and the second largest German company by market capitalization. The Falling Wedge has broken through the resistance line on 23/07/2022, if the price holds above this level, you can have a possible bullish price movement with a forecast for the next 26 days towards 96.90 EUR. Your stop-loss order, according to experts, should be placed at 84.28 EUR if you decide to enter this position.
SAP SE SAP delivered second-quarter 2022 non-IFRS earnings of €0.96 per share down 45% from the year-ago quarter’s levels. The downside was caused by tougher year-over-year comparisons pertaining to contribution from Sapphire Ventures.
Total revenues, on a non-IFRS basis, were €7.517 billion ($8.009 billion), up 13% year over year, driven by strength in cloud business.
However, SAP has lowered full year operating profit guidance due to the €350-million negative impact from the war in Ukraine and expectations of a decline in software licenses revenue. The company now projects non-IFRS operating profit in the range of €7.6-€7.9 billion, indicating a decline of 4-8%. Earlier, the company guided non-IFRS operating profit in the range of €7.8-€8.25 billion, indicating flat to down 5%.
Risk Disclosure: Trading Foreign Exchange (Forex) and Contracts of Difference (CFD's) carries a high level of risk. By registering and signing up, any client affirms their understanding of their own personal accountability for all transactions performed within their account and recognizes the risks associated with trading on such markets and on such sites. Furthermore, one understands that the company carries zero influence over transactions, markets, and trading signals, therefore, cannot be held liable nor guarantee any profits or losses.

Hedge Fund Stuff!I looks like we are finally seeing a turnaround on Eckert. . .Did a piece on this stock, the fundamentals are are nothing short phenomenal and I was just waiting for a turn around and it happened last week. Expect to hit 1st profit target at 90 with an R @ 3.69.

APE/USDAnother view huge vol jump signal a turnaround get in at the bottom. This is where the money is made. Buy the dip this is no dip it is the bottom.

APE/USDThis is a classic sleeper your seeing the start of a big up tick. Huge dump off and huge buy in. Old money and new money and the start of a new shoot the moon scenario. Watch history repeat it`s self.

APE/USDI believe the ape is getting ready to roar keep an eye on this one been watching it for some time now and believe it is ready to break out. There has been strong pressure both directions. Something is going to give most of the time it will pop up and burn a double play and then some. So stop on by and play some ape and see what happens looking for a dp here buy in 0.06 sell 12.5-13.5. Spread the word bird.

SAP or SADsad times for the tech giant, will finish the year sub $70. Value buy since there is a lot of function there

BAILOUTToday German Government will probably agreed over bailout package to take 25-30% direct equity stake + 8 billion euro financing to support Uniper.
Should we see a bottom? Who knows, surely weekly close can give us an hint.


Long SiemensI am long on XETR:SIE
- 61.8% Retracement on the Weekly
- Supply & Demand zone
- Upcoming eanrings 11 Aug
entry @ $100
SL @ $98
TP @ 110
@Hendry2005

Trading Idea - #AirbusMy trading idea for Airbus - Buy/LONG
Target: EUR 116.00 (+11.6% gain)
Despite the delivery bottlenecks, Airbus has shown a solid business performance in the second quarter. So with the upcoming quarterly report on 27 July, there could be a positive outlook.
Experts expect solid free cash flow and unchanged targets for the year.
The EUR 90.00 mark successfully provided support at the beginning of July. The price has bounced off this and continues to climb from high to high.

Trading Idea - #VolkswagenMy trading idea for Volkswagen - Buy / LONG
Target: EUR 143.00 (+8% gain)
VW has sold more electric vehicles worldwide than in the first quarter of the year. This is a positive business development despite supply bottlenecks.
It is becoming apparent that many automotive suppliers have reached a low point in their business development. Nevertheless, the car manufacturers themselves continue to act very strongly.
In the second half of the year, profit momentum could pick up again as China plans tax reductions. From today's viewpoint, VW would be one of the biggest beneficiaries.
Better outlook for the second half of the year is expected due to the end of the semiconductor shortage, which is becoming more and more apparent.
From a technical chart perspective, we are in a support area both in the short term (15M) and in the long term (1D), which makes buying the share attractive.

Trading Idea - #AUTO1My trading idea for Auto1 Group - Buy/LONG
Target: EUR 9.00 (+28% profit)
The number of vehicles sold at Auto1 has increased, even if the forecast was slightly missed.
Gross profit per vehicle (GPU) in the private customer segment is close to the target of €1000, which is surprisingly strong. The overall valuation of the share is positive after the latest reports.
The latest news indicates a stronger focus towards profitability rather than growth. On the chart, a formation of a bottom can be observed. A good entry point for optimistic investors.

Trading Idea - #LindeMy trading idea for #LINDE - Buy/LONG
Target: 292.00 EUR (+6% profit)
Linde PLC produces industrial gases which are afterwards used in various sectors such as the energy sector, steel production, chemical processing, environmental protection or medical therapies.
On 14.07.2022, an unusually large long position appeared in publicly available options trades. It is not clear whether it was an institutional investor or a wealthy private individual. What is clear, however, is that someone knows something positive is going to happen.
Apart from that, Linde has successfully tested the long-term support line this month. A further upward movement would be the consequence. My target is the annual POI around EUR 296.00.

ADIDAS - It's time for a long ?Fundamentals:
- massive drop from the tops
- still good bussinses
- incoming football championships in the 2022 should boost the price
AT:
- reached the strong support, should at least made a correction up
- signal candle for trend change to upside
but this is only my point of view, not a recomendation.I wonder what do You think about this idea. Up, Down or maybe sideways ?


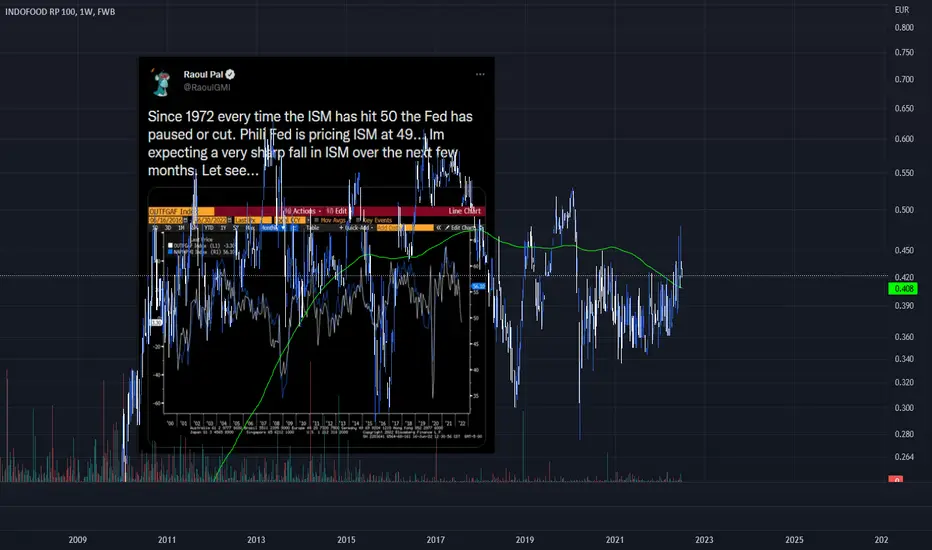
Raoul Pal say money printer will go BRR when the ISM hits 50I have set alerts for this
The ISM manufacturing index or purchasing managers' index is considered a key indicator of the state of the U.S. economy. It indicates the level of demand for products by measuring the amount of ordering activity at the nation's factories.
people are going to stop buying cars, stop spending money and demand will stop.
Suppliers have been increasing supply and a bullwhip will occur during high inflation
Recession is likely
Entering Adidas for long term holdAdidas is one of the companies which not likely go out of the market anytime soon. We are hitting massive support trend line and we have also touched covid lows. I can only imagine this is beginning of recovery. Yes, we might go lower, but if you think long term you can start inching in positions at this price and average down at the next support if we got there.
This is like a long term hold for a couple of years at the very least.
