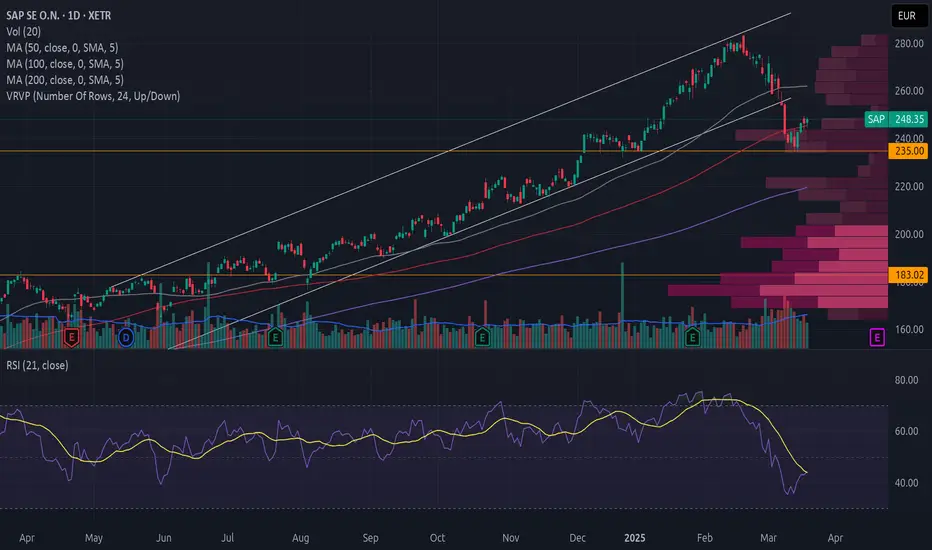
Should You Buy SAP After Its Price Drop?
SAP has broken down from an upward trend with high volume.
The price decline has stalled around the resistance level at 235. The volume profile shows a sharp drop in trading activity at this level when prices approach from both below and above, making this a significant resistance zone.
There are no reversal formations as the price exits the trend.
The price is recovering, but without strong volume. Moreover, the negative volume balance further weakens the stock. The same applies when prices are just below a green cloud in Ichimoku.
From a fundamental perspective, the decline likely stems from concerns that SAP was overbought, combined with weakness in U.S. tech stocks. However, SAP is a European company poised to benefit from increased defense spending. These funds are not only for weapons and ammunition but also for innovation, data security, cyber warfare, infrastructure, and more.
I have chosen to reallocate some of my U.S. tech holdings into European investments and have bought SAP.
Always conduct your own research and assessment before making buy or sell decisions.
Thyssenkrupp AG Impulse Nearing CompletionThe impulsive move is close to ending, indicating a potential reversal. A minimum 9% pullback could be expected.
Traders should watch for confirmation signals before taking action. 📉🔍

Rheinmetall AG: A great defence company to consider About the company
Rheinmetall AG is a holding company, which engages in the provision of development and sale of components, systems, and services for the security and civil industries. It operates through the following segments: Vehicle Systems, Weapon and Ammunition, Electronic Solutions, Sensors and Actuators, Materials and Trade, and Others. The Vehicle Systems segment offers a diverse portfolio of vehicles, including combat, support, logistics, and special vehicles. The Weapon and Ammunition segment includes products and solutions for threat-appropriate, firepower as well as comprehensive protection. The Electronic Solutions segment is involved in the chain of effects in the system network, from sensors and the networking of platforms and soldiers to the automated connection of effectors, as well as solutions for protection in cyberspace. The Sensors and Actuators consists of a product portfolio with exhaust gas recirculation systems, throttle valves, control dampers, and exhaust flaps for electromotors, solenoid valves, actuators and valve train systems, oil, water, and vacuum pumps for passenger cars, commercial vehicles, and light and heavy-duty off-road applications, as well as industrial solutions. The Materials and Trade segment focuses on the development of system components for the basic motor.
Summary of business
Next earnings: Wednesday 12th March 2025 (Full year 2024 results)
Given the latest developments, Europe needs to be able to defend itself against Russia or any other enemies, with or without the United States. Invasion by Russia will remain a key risk for the foreseeable future to Europe and it needs to move fast and arm itself. For now, Europe’s first priority is to continue supporting Ukraine – Ukraine’s experienced military is currently the most effective deterrent against a Russian attack on the EU due to its experience on the battle ground. If Ukraine decides that a US-Russian deal to end the war is unacceptable Europe needs to step in first. A recent example is when the United States cut off military intelligence to Ukraine, prompting the United Kingdom to step in and provide intelligence support instead. Should the United states, continue to pull out of Ukraine, we expect Europe to quickly fill up the gaps.
We expect European defence spending and capabilities to continue growing for the next number of years. As a result, we see opportunity for Rheinmetall. Rheinmetall is well positioned to benefit from the increase in budget allocations towards defense, especially as Germany is expected to play a key role in Europe’s defence as US military support declines. Since Europe is coming from an economic crisis, spreading costs over time looks like a feasible route Europe will take for this. Rheinmetall has a well-diversified portfolio across geographies and platforms, with 70% of its revenue from its defense business and 30% from its civil one. Escalating global security concerns are driving higher growth in the defence market as many countries in Europe have underspent over along time. European nations are expected to boost defence budgets to a minimum of 2% of gross domestic product, a trend likely to accelerate due to the Russia-Ukraine war. This situation offers a significant opportunity for Rheinmetall to benefit from its well-diversified geographical presence and product portfolio.
On Thursday 06th March 2025, European Union (EU) leaders convened in Brussels for an extraordinary summit focused on defence and Ukraine, amid growing concerns over Europe’s security architecture and its financial underpinnings. The summit takes place in the wake of Washington’s abrupt suspension of military aid to Ukraine, placing increased pressure on the bloc to enhance its own defence commitments. During the meeting European Commission President Ursula von der Leyen said the 27 EU leaders are “determined to ensure Europe’s security and to act with the scale, the speed and the resolve that this situation demands. We are determined to invest more, to invest better and to invest faster together.” She added “These are extraordinary times. They call for extraordinary measures. With REARM Europe, we'll equip our Union with the capabilities it needs to support Ukraine and defend itself”. This reinforces the fact that more money will flow towards the defence industry and will more likely benefit Rheinmetall.
The EU’s executive arm expects around 650 billion euros ($702 billion) to be unlocked through this initiative over the next four years. Even if only 30% of that trickles down to Rheinmetall each year — about 48 billion euros — it would more than triple the company’s current revenue. This makes the stock a strong buy from the current price with a price target of EUR 1800.
Rationale for
As the capacity leader in ammunition production, the company is well-positioned to capitalize on surging demand through long-term framework contracts lasting up to 10 years.
Its strong incumbent role in the European Strategic Safety Initiative and the F-35 Lightning II fighter jet program — two of the largest air defence projects — will drive sustained production and revenue growth for decades.
Risks to consider
Rheinmetall's sales heavily rely on military funding, making its revenue stream inherently political and subject to uncertainty.
Geopolitical risks and shifting alliances may restrict the company's ability to deliver products to certain countries like the USA which is a big market.
Despite earnings growth, global defence stocks, including Rheinmetall, face persistent valuation pressure due to rising ESG-driven constraints on investment mandates.
Revenue by country
Europe: EUR3.40B
German: EUR1.72B
Asia: EUR817.00M
Other regions: EUR642.00M
North, middle and South America: EUR594.00M

YSN | Secunet Security | FA & TA | Its encrypted, BabyFA
Secunet is a German based company. Working field is IT security highly focused on encryption. It received since 2014 atleast 3 ongoing big contracts (SINA, Golden Reader Tool and easygate by the German Government agency and departments. With the current financial situation of the German government it could possible have negative effects here and is in support with my TA as i expect price to go further down.
Its also so mention that Profit margins are currently almost half than it was in the previous years (11.4 to 6.5). However the current earnings forcast is 10.4% per year for the next 3 years and as the debt level is low + renvue is still high i see a potential for the next coming years.
TA
Its currently in a volatile downtend that seemed not over yet. The two buy zones are based on the next two big S/R levels. As i want to have exposure and to hold long term anyways i marked out 2 areas where i plan to buy.
Entry: Price reaches the buy zones
Invalidation: none
S-L: None, as long- term- hold)
Target: 50% of the recent Swing in confluence with a strong S/R level that caused the current downtrend
Good luck
Disclaimer:
- My posts are mostly for my own journaling
- This information does not constitute as financial advice and is only for educational purposes. I am not your financial advisor.
- You trade entirely at your own risk
- Make your own research
- Finance and trading is evil, capitalism is bad, duh ;)

Volkswagen AG (VOW) – The Cheapest Military Stock in Europe? TP1: €150 – Short-term breakout
TP2: €180 – Mid-term resistance
TP3: €250 – Long-term revaluation target
Why Are We Bullish?
🔹 Defense Sector Entry?
-VW exploring military production, with CEO Oliver Blume confirming interest.
-Idle plants may be repurposed, potential Rheinmetall partnership in the works.
-Rearmament boom – Rheinmetall’s valuation already surpassed VW’s.
🔹 Financial & Growth Catalysts
-Q4 sales up 21%, 7.0% margin, 2025 revenue target +5%.
-€1B cost-cutting, strong EV & U.S. market expansion.
🔹 Bullish Technicals
-MACD Bullish Crossover + Green Histogram Bars confirm momentum.
-Bounced off long-term trendline support, signaling a strong reversal.

The only direction is up.Sometimes, you can enter a trade without an overarching structure or a correction level guiding the direction. This is a prime example. After an intriguing sideways movement, marked by almost textbook ups and downs, we saw the range break briefly to the downside—a classic range spike, or as some call it, a fakeout.
This fakeout has trapped short-sellers, and as their positions get liquidated, they’ll fuel upward momentum. Interestingly, the range spike ended precisely at the resistance line of our broader structure, highlighted in red.
Given this, I don’t expect us to revisit the target level, and the structure is effectively complete. This is an ideal spot for a long position. Even without bullish structures forming, the chart has only one direction to go from here—up and to the right.

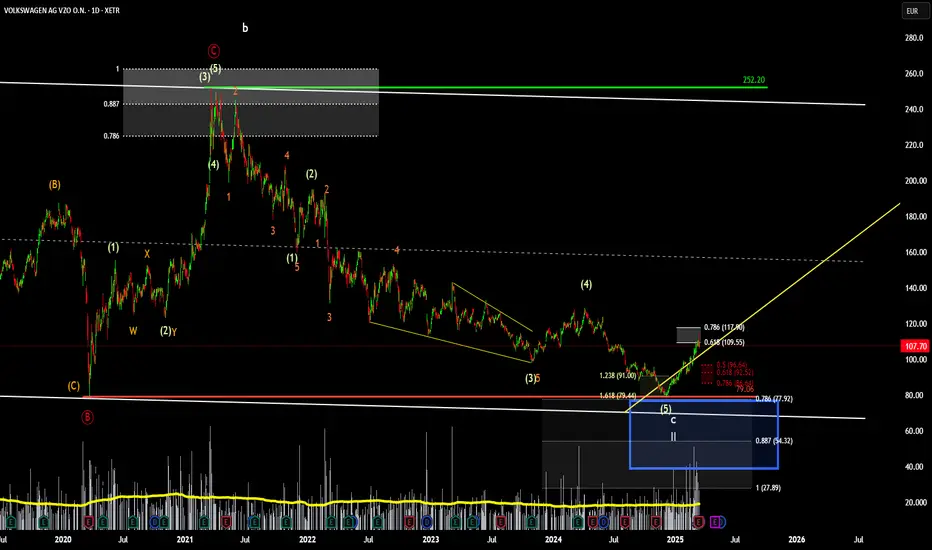
VW - stock may have turned around (?)VW - has had its fair share of bad news lately, however, panic and fear often times is at its peak when price is close to find the bottom.
Looking at price action and price targets it seems the wave C of II could be over which is also indicated that price bounced from the 161.8 fib expansion of wave 4 of C. Ever since then the stock has seen a steady rise that was also supported by good volume.
Now it has reached the 61.8 retracement of wave 5 and usually around that fib level price will stall and consolidate. I can even see a 5 wave motive wave up.
Now, we need to see how the price action looks like in the coming days and weeks. Hopefully it will make a higher low at around 50-61.8 % fib retracement and from there I would be looking to long the stock. The upside is quite impressive as the price may rise with over 300%.
For now, we remain neutral and are watching what happens next.
PUMA - on the road again?One of the worst performers in the european stock market for the last months the Puma stock, reasons for this were given tromendous. 1. Bad earnings expectations. People tend to buy less from the Big 3 (Nike Adidas Puma) and Puma has the least amount of loyal customers. Puma has not much cash cows (products which give continously a lot revenue), they get some money from licensed products in sports but they dont have a productline which is reliable (such as the adidas superstars shoes or the Nike Airforce 1 ...) Pumas products are absolutely overpriced. But there is at least some light for Puma, I do think they will get into better times.

Possible Final Rally?
RHM is in a steady upward trend, but in early February both price and volume rose sharply to around 1200 EUR. Since then, there’s been a drop in price and volume that may continue to develop. We haven’t seen a final rally yet, but it could be on the horizon. At the very least, it appears we’ll see a correction of some significance.
Volume balance is positive, which strengthens the stock. However, RSI21 is above 70, indicating the stock is overbought according to classic technical analysis. This factor weakens the near-term outlook.
From a fundamental perspective, I believe the stock is a good buy if the price comes down, both in the short and long term. Europe must rearm and produce its own weapons so it isn’t dependent on unpredictable politicians outside of Europe.
Disclaimer: I have no position in RHM.

Time to send Porsche to the moon- DAX in an uptrend.
- US carmakers shunned in EU.
- Porsche can't fall further, has literally zero ground clearance currently.
- Solid base forming between €50 and €56.
- Cheap long date OTM call options have the highest risk/reward.

SAP a bit short on a very boring stockNot really worth to short at the moment, since the stock is extreme strong with its buying power for example because of share buying programms for SAP workers. But that means also the stock climbs very slow. (Low risk - low potential)

Bottom up with clear upside momentumXETR:BAYN Bayer is looking at a possible rebound after the stock rose strongly and attempting to break above the bearish gap seen.
Ichimoku is showing a strong bullish signal and we believe near-term should see further upside.
Long-term MACD is back to the positive. Stochastic confirms the bullish momentum and has yet to see overbought signal yet. 23-period ROC is above the zero line and volume is healthy.
Key support is 20,615

HAG Long: A trade based on the current geopolitical climateHENSOLDT AG ( HAG ) continues to respect its long-term ascending channel, with price action now testing multi-year resistance. Heightened geopolitical tensions, particularly between the US, EU, and Russia, coincide with recent upward momentum. Historically, international conflicts have bolstered defence equities, and the current macro backdrop remains consistent with that theme.
A sustained breakout above resistance could signal a shift in market expectations, while the underlying trend reflects the broader geopolitical landscape. Ironically, the chart represents the doomsday clock better than the clock itself. The irony doesn't end there, for global peace lies below the support for this stock. As soon as supporters of this stock take their hands off the wheel, peace inches closer. Bears on defence stocks bring peace. 🏝️
For now, it's time to be a bull. Probably.

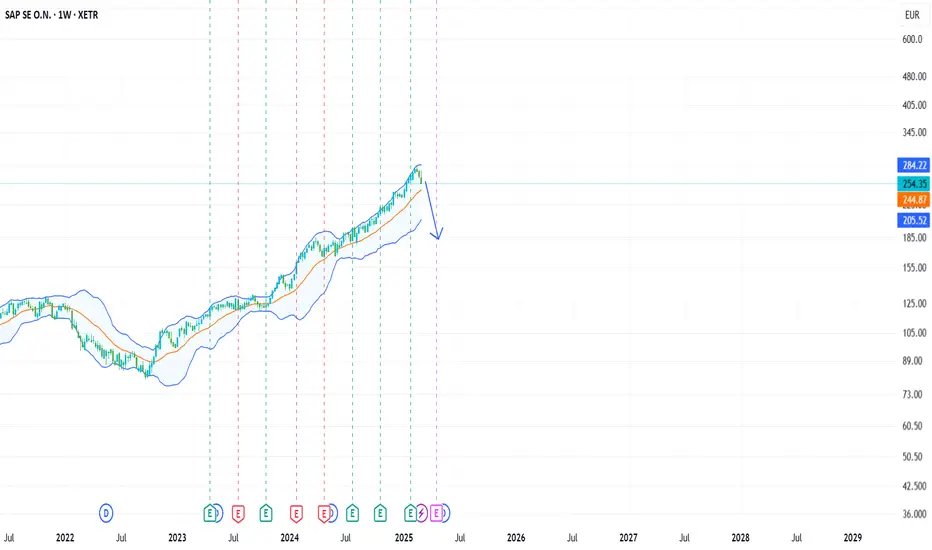
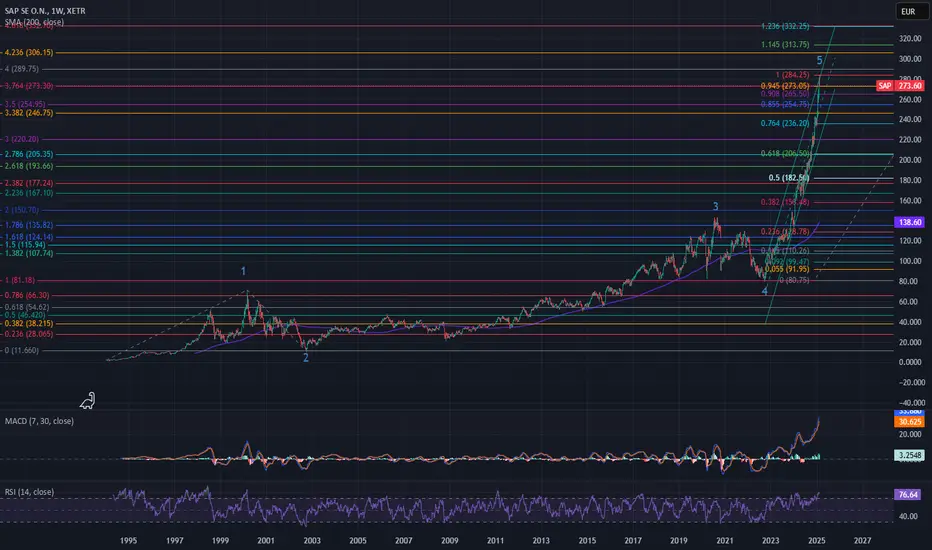
SAP - could this be the top for the main driver of the DAX ?SAP has the highest market cap in the DAX (315 billion €) and has had an impressive run since the 2022 lows. Price shot up from 80 to 280 in one steep channel.
Looking at the chart since the IPO, you can see a five wave structure that might have come to an end at the upper trendline of the channel.
The DAX has dropped by 700 points this week and if SAP starts correcting to a conservative 0.764 retracement of this move, we are looking at a drop to 236.
The MACD and RSI could certainly use a cooldown.
a little pump for junk sharesthe tribunal made clear that the Varta shares should be deleted, but I believe this is a pump to sell the last shares to risk retail investors

THYSSENKRUPP - PUSH IT TO THE LIMIT!!!My favourite stock at this moment eventhough i hate the company, but as I say if you search for moral dont search it in the stock market. The stock is very undervalued and got punished quite a long time but chances are good for an extreme Bullrun the next years.

$TKA THYSSENKRUPP & IVECO—HIDDEN DEFENCE GEMS SHINEXETR:TKA THYSSENKRUPP & IVECO—HIDDEN DEFENCE GEMS SHINE
(1/9)
Good afternoon, Tradingview! Thyssenkrupp’s stock soared 20% this week—defence spending’s the buzz 📈🔥. Investors eye TKMS and Iveco’s IDV as undervalued stars. Let’s unpack this rally! 🚀
(2/9) – MARKET SURGE
• Thyssenkrupp: 20% spike Monday, 53% YTD 💥
• Iveco: 68% YTD—IDV’s 10% margin shines 📊
• Driver: Europe’s military budget boom
Defence cash is flipping the script—big gains!
(3/9) – DEFENCE PLAYS
• TKMS Spin-Off: Warship unit set for ‘25 🌍
• Iveco IDV: Defence arm spins out in ‘25 🚗
• BofA: TKMS worth half Thyssenkrupp’s cap 🌟
Hidden gems catching the spotlight!
(4/9) – SECTOR SNAPSHOT
• Defence P/E: 25.8x vs. 18x 3 yrs ago 📈
• Thyssenkrupp & Iveco: ~8x—bargains?
• Vs. Giants: Rheinmetall, BAE soar, but these lag
Value hunt’s on—undervalued or overhyped? 🌍
(5/9) – RISKS TO WATCH
• Peace Talks: Ukraine deal softens demand? ⚠️
• Execution: Spin-offs need to deliver 🏛️
• Focus: Beyond big defence names risky 📉
Rally’s hot—can it hold the heat?
(6/9) – SWOT: STRENGTHS
• Thyssenkrupp: €16B+ TKMS backlog 🌟
• Iveco: IDV’s 10% profit margin 🔍
• Cash Flow: Thyssenkrupp hits €0-300M ‘25 🚦
Defence muscle’s flexing hard!
(7/9) – SWOT: WEAKNESSES & OPPORTUNITIES
• Weaknesses: Thyssenkrupp’s steel drag, Iveco’s focus 💸
• Opportunities: EU budget hikes, spin-off buzz 🌍
Can these sleeper hits wake up big?
(8/9) –Thyssenkrupp & Iveco defence bets—your call?
1️⃣ Bullish—Spin-offs spark a surge.
2️⃣ Neutral—Growth’s there, risks balance.
3️⃣ Bearish—Rally fades fast.
Vote below! 🗳️👇
(9/9) – FINAL TAKEAWAY
Thyssenkrupp’s 20% leap, Iveco’s IDV glow—defence cash ignites hidden plays 🌍🪙. Cheap vs. giants, but risks lurk. Gems or mirage?

Vulcan Energy Resources (VUL) 02/2025Vulcan Energy Resources (VUL) – Simple Breakdown
Vulcan Energy is working on a green way to produce lithium, which is super important for electric car batteries. Their Zero Carbon Lithium™ Project in Germany aims to extract lithium without harming the environment, using renewable energy.
Why It Could Be a Winner
✅ Huge Demand – More electric cars = more lithium needed!
✅ Eco-Friendly – Their method is cleaner than traditional mining, which could attract big investors.
✅ Strong EU Support – Europe wants its own lithium supply instead of relying on China or other countries.
Bottom Line: If Vulcan delivers on its promises, it could be a great long-term play. But there are risks, so keep an eye on how the project develops! 🚀
🔍 What’s Happening with the Stock?
Vulcan Energy (VUL) was in a long downtrend but made a strong recovery in early 2024.
After a sharp jump above 5 EUR, the price corrected back down to around 2.60 EUR.
📊 Key Levels to Watch
✅ Support (possible bounce zones):
2.50 EUR → The price could stabilize here.
2.00 EUR → If it drops further, this is the next big level.
🚀 Resistance (tough levels to break above):
3.50 – 3.80 EUR → If the price moves up, it might struggle here.
5.00 EUR → A strong resistance where many sold last time.
📉 or 📈? What’s More Likely?
🔹 Bullish (price going up): If the stock breaks above 3.00 EUR, it could quickly climb to 3.50–3.80 EUR.
🔹 Bearish (price going down): If 2.50 EUR doesn’t hold, the price could drop to 2.00 EUR.
💡 Conclusion: The stock is at a decision point. If it stays above 2.50 EUR, there’s a chance for a rebound. If it drops below, things could get shaky.

Henshold $HAG - Update - Caution is warrantedXETR:HAG is riding its trend channel beautifully but sellers will likely weigh on the stock in the days ahead. Be careful with new entries.

What next for MSFT stock after recent pushWhat next for MSFT stock after the recent push?
If this baby gets to $400, I will take a buy. TP $433 and SL $370. this will be a Risk/Reward of 1:3.43
My view and zones are displayed on the chart.
Trade with care

RHM buy the retracement (II)I believe good spots to enter will still appear on RHM. This is my plan at the moment, to enter on the .382 or .5 retracement of the last 5 waves.
Orange line represent previous retracement in logarithmic scale.
Of course, who knows where to top of this move up is. Let's see what happens!

BMW - 5 months HEAD & SHOULDERS══════════════════════════════
Since 2014, my markets approach is to spot
trading opportunities based solely on the
development of
CLASSICAL CHART PATTERNS
🤝Let’s learn and grow together 🤝
══════════════════════════════
Hello Traders ✌
After a careful consideration I came to the conclusion that:
- it is crucial to be quick in alerting you with all the opportunities I spot and often I don't post a good pattern because I don't have the opportunity to write down a proper didactical comment;
- since my parameters to identify a Classical Pattern and its scenario are very well defined, many of my comments were and would be redundant;
- the information that I think is important is very simple and can easily be understood just by looking at charts;
For these reasons and hoping to give you a better help, I decided to write comments only when something very specific or interesting shows up, otherwise all the information is shown on the chart.
Thank you all for your support
🔎🔎🔎 ALWAYS REMEMBER
"A pattern IS NOT a Pattern until the breakout is completed. Before that moment it is just a bunch of colorful candlesticks on a chart of your watchlist"
═════════════════════════════
⚠ DISCLAIMER ⚠
Breakout Area, Target, Levels, each line drawn on this chart and any other content represent just The Art Of Charting’s personal opinion and it is posted purely for educational purposes. Therefore it must not be taken as a direct or indirect investing recommendations or advices. Entry Point, Initial Stop Loss and Targets depend on your personal and unique Trading Plan Tactics and Money Management rules, Any action taken upon these information is at your own risk.
═════════════════════════════
