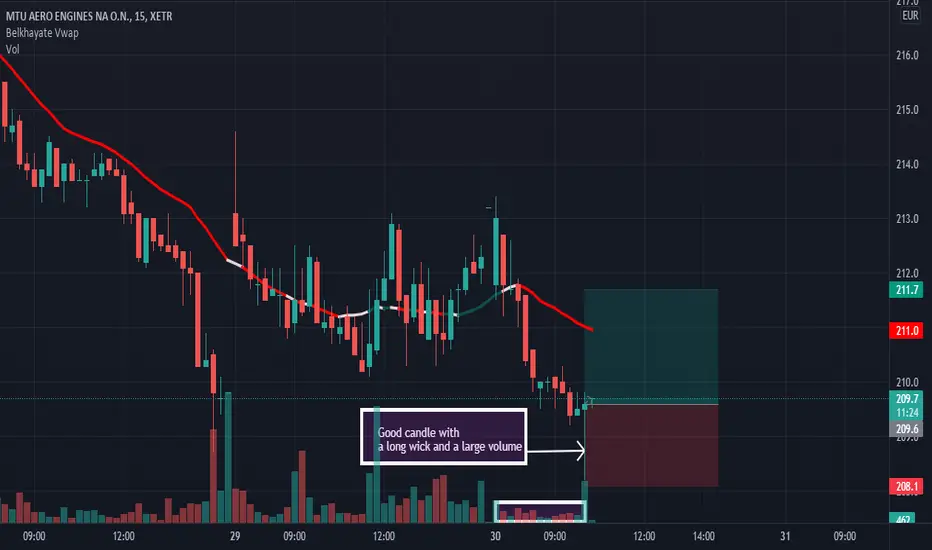
ANALYSIS ON MTX/ Good probability of an uptrendGood morning! On this chart we have an uptrend that is emerging with this long wick candle and a large volume that is greater than all of them. You can see that on the chart...
Zalando turns aroundJust got filled in the green box. After the 2 TP's we will go for a new ATH.
What do you think?

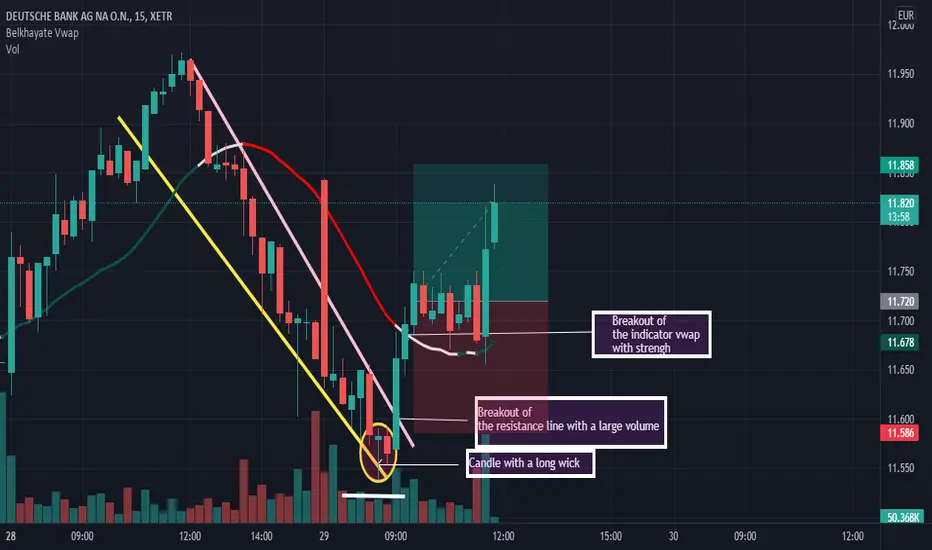
SUMMARY ON DBKThis morning on DBK we have a very good uptrend. As we can see on the chart our buy position was confirmed by three factors which are:
- Candle with a long wick and small body;
- Breakout of the resistance line with strengh with a large volume;
- Breakout of the vwap indicator with a large volume.
Thanks...


Aumann LongAumann recently formed a bull flag. After a bullish break price came back and retested the former resistance of the bull flag which now beacame support. This price level was also the 0.5 retracement of the neckline building an inverse H&S pattern. Price increased significantly and failed to break the massive resistance between the 17-18 euro range. In the shorter time frame we could now see an uptrend continuing the inverse H&S pattern. Takeprofits are measured by the price difference between neckline and the low of the head. Interesting targets are the psychological 20 euro mark, the daily levels at 21.50/21.90 and the 1.618 fib projection.

Now close your position As we said at the next green candle after the succession of many reds candles you cut your position for this day.........Thank you!!! God bless...
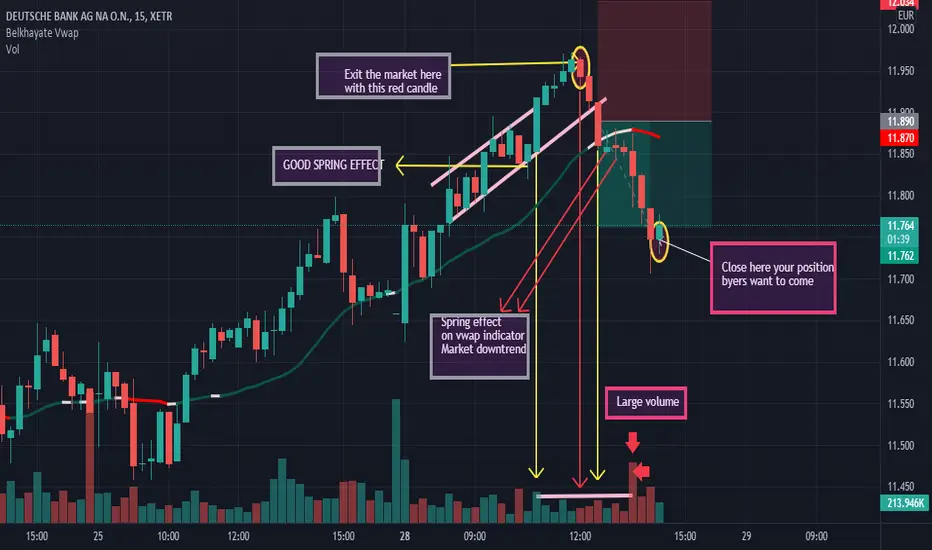
Important to know!! how to get out of position???Just to say that at the next green candle with a large volume you can close your position. Why? In effect, We are a downtrend with a succession of many reds candles so we can see on the chart. This is my suggestion for money management.....Thank you !!!!

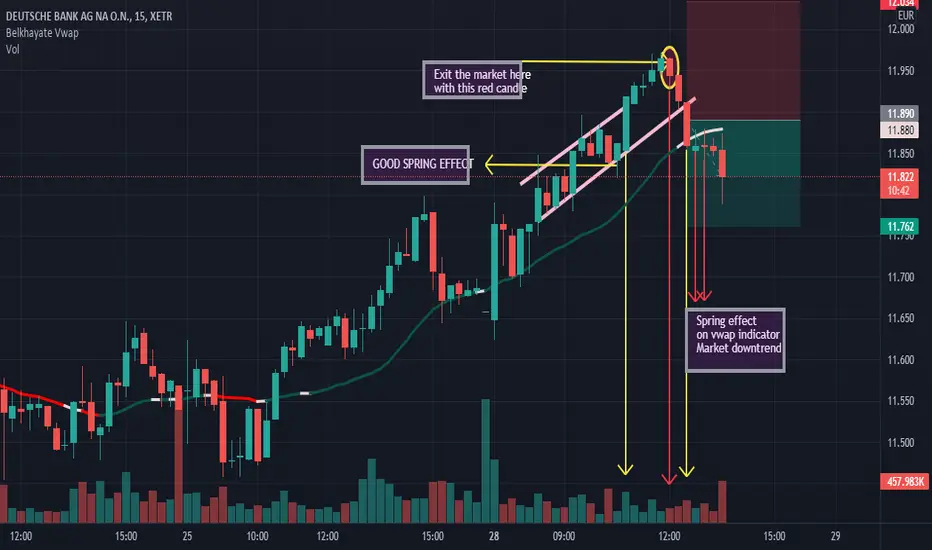
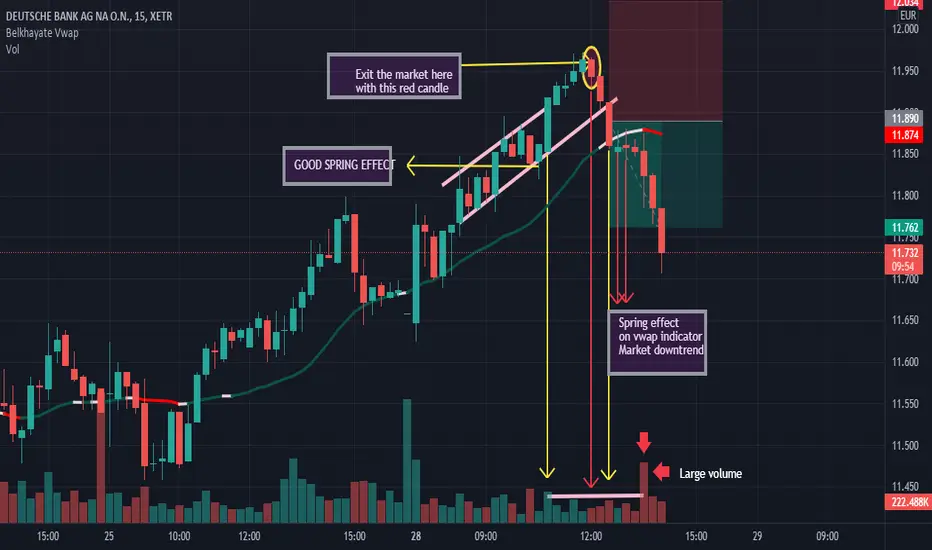
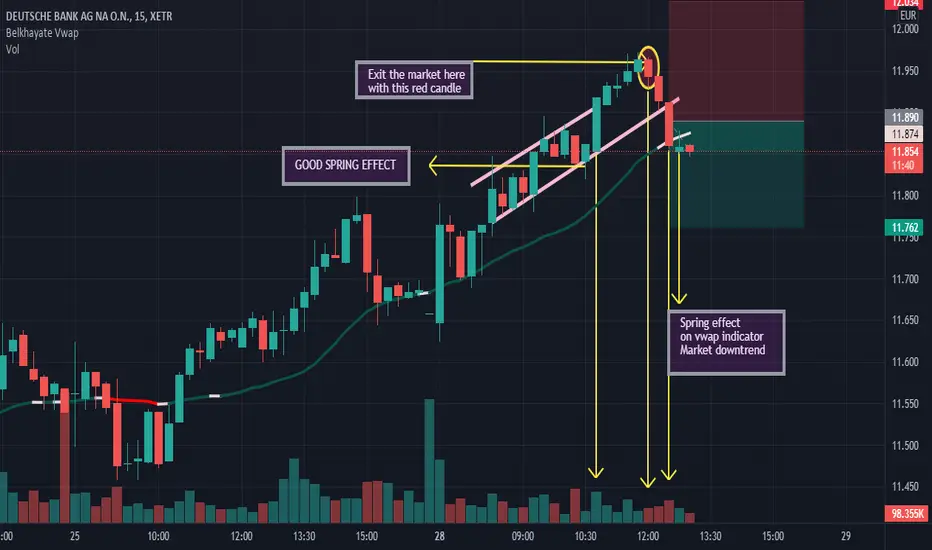
SPRING EFFECT ON DBKAs we can see on the chart we have a good spring effect on the vwap indicator so good probability of downtrend....!!! Thanks.

Delivery Hero: Delivering Lower Prices? Delivery Hero - Short Term - We look to Sell at 38.86 (stop at 43.29)
We look to set shorts in the early trade. Closed below the 20-day EMA. Previous support, now becomes resistance at 38.00. The bias is still for lower levels and we look for any gains to be limited.
Our profit targets will be 28.41 and 25.19
Resistance: 38.00 / 50.00 / 60.00
Support: 30.00 / 25.00 / 20.00
Disclaimer – Saxo Bank Group. Please be reminded – you alone are responsible for your trading – both gains and losses. There is a very high degree of risk involved in trading. The technical analysis, like any and all indicators, strategies, columns, articles and other features accessible on/though this site (including those from Signal Centre) are for informational purposes only and should not be construed as investment advice by you. Such technical analysis are believed to be obtained from sources believed to be reliable, but not warrant their respective completeness or accuracy, or warrant any results from the use of the information. Your use of the technical analysis, as would also your use of any and all mentioned indicators, strategies, columns, articles and all other features, is entirely at your own risk and it is your sole responsibility to evaluate the accuracy, completeness and usefulness (including suitability) of the information. You should assess the risk of any trade with your financial adviser and make your own independent decision(s) regarding any tradable products which may be the subject matter of the technical analysis or any of the said indicators, strategies, columns, articles and all other features.
Please also be reminded that if despite the above, any of the said technical analysis (or any of the said indicators, strategies, columns, articles and other features accessible on/through this site) is found to be advisory or a recommendation; and not merely informational in nature, the same is in any event provided with the intention of being for general circulation and availability only. As such it is not intended to and does not form part of any offer or recommendation directed at you specifically, or have any regard to the investment objectives, financial situation or needs of yourself or any other specific person. Before committing to a trade or investment therefore, please seek advice from a financial or other professional adviser regarding the suitability of the product for you and (where available) read the relevant product offer/description documents, including the risk disclosures. If you do not wish to seek such financial advice, please still exercise your mind and consider carefully whether the product is suitable for you because you alone remain responsible for your trading – both gains and losses.

Summary on DBK. Money management.At the next red candle with a large vulume you can exit the market because at this moment the sellers want to come small small. Thanks.


Good opportunity of buying on DBKOn DBK we have a good opportunity of buying. In addition, buyers are above the vwap indicator so this comforts us in our position. Thanks.


VOW short to 200 then to 360ABCDE correction for wave (4) seems complete
Wave 1 in (5) also complete
Next appears to be a pullback to 200 in wave 2 and then further increase


Trading Idea - Daldrup+SoehneSHORT
ENTRY: 4.92 EUR
TARGET: 2.76 EUR (+40% profit)
STOP: 6.30 EUR
1.) The company is rated very poorly when considering various fundamental criteria.
2.) Only a slow growth rate can be expected in the next few years.
3.) The company is showing poor profitability.
4.) The group pays little or no dividend.
5.) Share price my oscillate within the fair-price area: 2.00 EUR -> 4.70 EUR

Lenovo bullish pennant The price has formed a bullish pennant. We are expecting the price to break into the upside, We are looking for a retracement to a 50% fib zone of the Fibonacci extension.
AROON: Shows some bearish momentum, which is allowed since we expect the price to pull back to the entry point.
Target: 1.141
Entry: 0.863
S&L: 0.751
