
Why does it dip or recover in March?SAP shares always dip and begin to recover in March, which is so unique about this stock. Someone long can sell of around Jan and buy back in March to get maximum returns

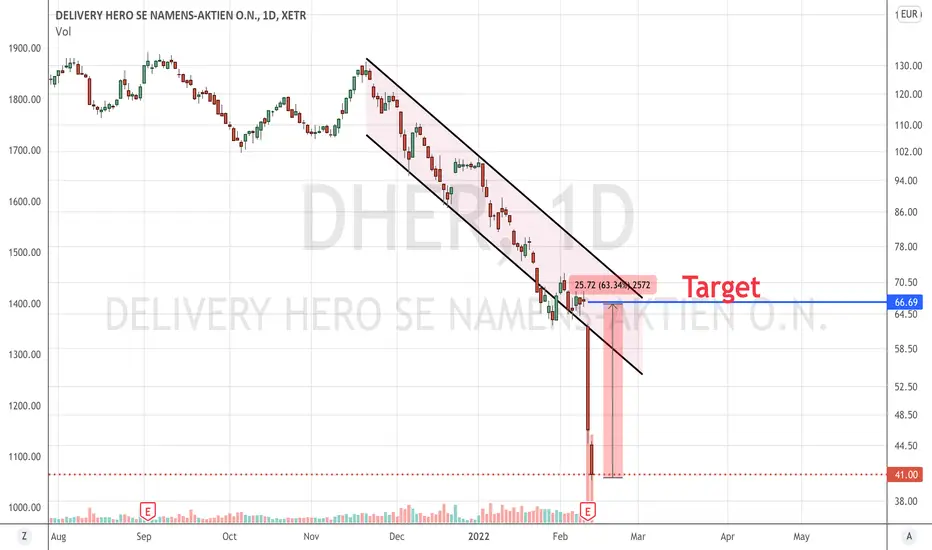
DHER : Free Lunch aheadThe average price Target by analyst's is 117 ! Even back to 66 is a good 60 performance
Volkswagen AG (VOW)VW is working with partners to improve battery system performance and costs down to the cell level. It plans to call a new battery cell in 2023 to be used in up to 80% of VW Group's electric vehicles by 2030. VW expects to reduce battery costs by up to 50% in the entry-level segments and up to 30% in the mid-market segments. loud volume. VW, together with partners, plans to have six active battery "gigafactories" in Europe by 2030. Each of the six plants will have an annual production capacity of 40 gigawatt hours (GWh), for a total of 240 GWh per year. The first two plants will be in Salzgitter, Germany, and Skelleftea, Sweden.
Will VW be the new Tesla?

RetracingLooks if like we've found a bottom and may retest the high again or complete a Fibonacci retracement at least.

two possible theories 😘😃im poblishim it for my self its not an advice for who sees it
gtfo of my site

VOW bullish, target 400It seems VOW has now completed the wave 4 correction and is heading higher
There is parity on the pitchfork with symmetry of wave 3 and 4
Target approximately 400 for completion of wave 5 in 2022

LONG TEAMVIEWERI have been following TeamViewer for a while with the Falling Wedge Pattern. After a while I noticed a form of a Cup pattern and now one Inverse Head and Shoulders that for me shows that the cup pattern will proceed. Another indicator to be at the look out is if it breaks the Falling Wedge Pattern, that for me will also indicate a strong buy.
If it pulls back on both Inverse Head and Shoulders and Cup Pattern I will wait a bit more before I enter long positions, because I still believe the Cup Pattern can also be formed later.
Besides this, TeamViewer has been making some strong investments in sponsorship and on technologies like augmented reality.
Feel free to share your thoughts.


siemens FALLING WEDGESiemens is actually not a buy, there is a risk it will make a move till 120€, which could be buy area...

DAYTRADE on BMWHere a possibility for a Daytrade in BMW. Wave IV should be happening soon. I only wait for a trigger for example a breakout in lower timeframes. Happy Trading!

Russia/Ukraine Crisis effect on Raiffeisen Bank InternationalA few western companies that are listed could very much feel the consequences of the Russian invasion.
Energy firms revenues and profits may be offset by a potential oil price jump so that is not a major concern right now. The financial sector is where I see an issue. According to calculations by JPMorgan, for the financial sector, the risk is concentrated in Europe. Any conflict in Ukraine will hit Russia just as you would imagine, there would be an economic hit and, along with sanctions that the US will impose this doesn’t sound good. Raiffeisen Bank International derived 39% of its estimated net profit last year from its Russian subsidiary. Raiffeisen Bank International would therefore be a good company to short.
The two orange lines represent all-time highs and lows. The two black lines represent the last decade support and resistance levels In early 2014 when Russia invaded Crimea the stock fell by around 32%. In the event of an invasion, I see the stock falling towards the bottom black support line. Represented by the blue arrow. This would be a drop of around 22%.

Commerzbank AGA very strong formation occurred on Commerzbank chart, a head-and-shoulders. The breakout and backtest at neckline has happened.

ZUMTOBEL Weekly Technical AnalysisT9Z Weekly - EDUCATIONAL only - Support, Resistance, Trend Lines , Clusters, Fibonacci, Pitchfork - Hope it Helps, Good Luck

VOW3 trendlines...Here we find some trendlines made using different reference points. They all have something in common: every single one is going down...

no description neededFirst zone of interest got hit.
1. PT at 4 ish.
If this zone breaks, I´m looking for 2


DHER Delivery Hero bullishIt seems DHER has corrected to the bottom of the channel from the top of wave 3
Now we are close to complete 4 and can continue during 2022 to reach a new ATH

Bioreactor markets running at 20% CAGRWas researching the bio reactor space following the recent results of Sartorius and found that they three key players are Merck, Sartorius and TMO. Definitely not cheap, but the cheapest among peers, with solid fundamentals. A trade to watch out in dips.

SAP SE (SAP.de) bearish scenario:The technical figure Descending Triangle can be found in the German company SAP SE (SAP.de) at daily chart. SAP SE is a German multinational software corporation, that develops enterprise software to manage business operations and customer relations. The company is especially known for its ERP software. SAP is the largest non-American software company by revenue, the world's third-largest publicly-traded software company by revenue, and the largest German company by market capitalisation. The Descending Triangle has broken through the support line on 28/01/2022, if the price holds below this level you can have a possible bearish price movement with a forecast for the next 26 days towards 100.00 EUR. Your stop loss order according to experts should be placed at 125.32 EUR if you decide to enter this position.
SAP said on Thursday it has agreed to buy a majority stake in privately held U.S. fintech firm Taulia as the German business software group seeks to expand its presence in supply-chain financing and working capital management. SAP, said it was looking at opportunities in the ‘metaverse’ - virtual online worlds where people can work, play and socialize.
Risk Disclosure: Trading Foreign Exchange (Forex) and Contracts of Difference (CFD's) carries a high level of risk. By registering and signing up, any client affirms their understanding of their own personal accountability for all transactions performed within their account and recognizes the risks associated with trading on such markets and on such sites. Furthermore, one understands that the company carries zero influence over transactions, markets, and trading signals, therefore, cannot be held liable nor guarantee any profits or losses.

Freenet - uptrend lineChart painting from the early 21st century, artist Maxi Scalibusa. No investment advice or a recommendation to buy or sell any securities. This is entertainment. Start 24.20 EUR

SAP, Paramount Bull-Flag Forms, Here Is How It Completes!Hello,
Welcome to this analysis about the SAP stock and the 2-day timeframe perspectives. Within the corona pandemic, many businesses, as well as private persons, moved into the home office and a boom in digitization emerged which is still ongoing. In this case, software companies like SAP or companies that have something to do with digitization could make huge increased profits which converted into rising prices in the stock market. These are the fundamentals that look quite positive, now when looking on the technical side of things I also detected a major decisive paramount formation SAP is forming here in the structure which is actually a bull flag formation as it is marked in my chart. The bull flag formation resulted out of an initial bullish impulse to the upside from where SAP moved on to form the bull flag which simultaneously is the wave B of the whole major wave count. Within this bull flag SAP also has a wave count with the waves A to E already completed and now as SAP approaches the lower boundary in which important supports lying together with the 500-EMA this is a important zone from where the main bounce can emerge. If this bounce is solid enough and SAP manages to increase bullishness from there on SAP will have a good ability to complete this whole bull flag formation with a final breakout above the upper boundary as it is marked in my chart, this will activate the upper target zone and once this zone has been reached the situation needs to be elevated again and SAP needs to show if it forms a continuation formation in this structure or firstly reverses initially, it will be an interesting development ahead.
In this manner, thank you for watching the analysis, all the best!
"Good fortune is when opportunity meets preparation."
Information provided is only educational and should not be used to take action in the markets.

Deutsche Bank - I believe in this terrible bottoming.Chart painting from the early 21st century, artist Maxi Scalibusa. No investment advice or a recommendation to buy or sell any securities. This is entertainment. Start 11.420 EUR
