CUBE / CUBESMART - Scenario for othe coming weeksThis is not a trade call. But let's discuss!
Seasonality should be on our side to conquer some 6-20% Gain in that stock until beginning of April.
Let's see how it works out.
Finding an entry around today or the coming days.

TKA - 20 YEARS LOW - CONTRARIAN STORYThyssenkrupp: A Potential Contrarian Investment
Thyssenkrupp is indeed an interesting case for contrarian investors.
The German conglomerate has faced significant challenges in recent years, including restructuring, debt burdens, and operational issues.
This has led to a decline in its share price and a negative market sentiment.
Reasons Thyssenkrupp Could Be a Contrarian Investment
Deep Value Potential: Due to the company's struggles, its stock price has been significantly depressed. If Thyssenkrupp can successfully implement its restructuring plans and improve its financial performance, there's potential for significant upside.
Divestiture Plans: The company has been actively divesting non-core assets to reduce debt and focus on its core businesses. Successful execution of these plans can lead to a leaner, more profitable company.
Industrial Upcycle: A global economic recovery or an upcycle in industrial sectors could benefit Thyssenkrupp's core businesses, leading to increased revenue and profitability.
Technological Advancements: The company has been investing in technology and innovation. If these efforts bear fruit, it could position Thyssenkrupp as a leader in its industry.
Risks to Consider
Execution Risk: The success of Thyssenkrupp's turnaround plan depends on effective execution. If the company fails to meet its targets, the stock price could decline further.
Economic Downturn: A global economic downturn could negatively impact Thyssenkrupp's business and financial performance.
Industry Challenges: The industrial sector faces various challenges, such as competition, rising costs, and regulatory hurdles.

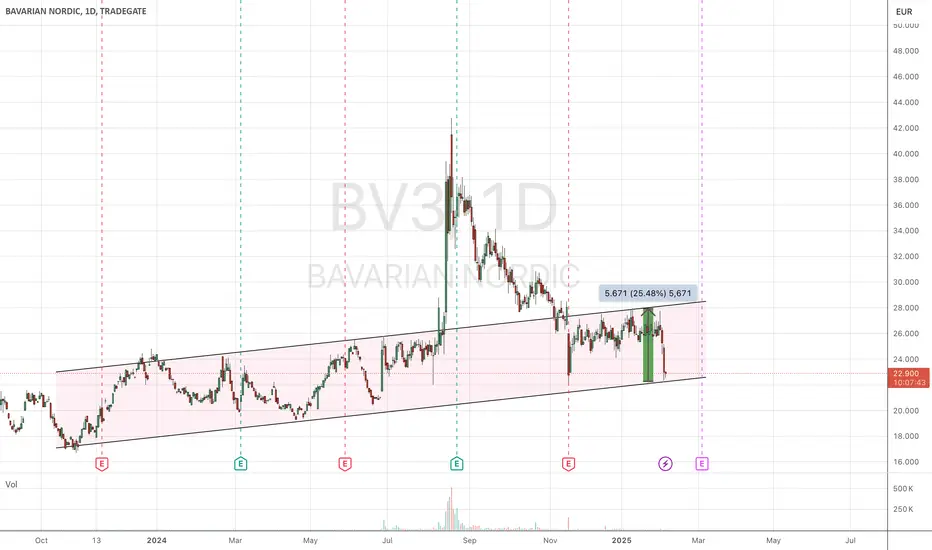
BAVA BV3: free lunch aheadstupid analyst expected more ... rather expect a 23 bounce back to 27-28. easy money in short time
What will it take to reach 1000€? Will we ever see it?Had an interesting conversation in the comments of my last RHM analysis - someone pointed out that they see €1,000 for this stock. Since I haven’t covered a broader timeframe yet, I figured it was time to take a look. And to my surprise, he wasn’t entirely wrong… well, kinda.
Let’s break it down. RHM has been in a long consolidation (highlighted in grey), so this recent push to the upside shouldn’t come as a shock to anyone. But here’s where it gets interesting: we overshot the green structure by a lot - and that’s okay. Structures are allowed to extend beyond their original targets under certain conditions.
First, we need a fakeout in the opposite direction - which we got, marked by the red dot. The next key factor? Where the chart turns. That’s why I placed a line called “The Ceiling” at the -1.236 Fibonacci. Here’s the rule: if price expands significantly beyond The Ceiling, the GKL (red box) becomes invalid, meaning we can no longer use it as a safe level for long entries due to the high risk of slicing straight through it.
So what’s the play? The next few days are crucial. If RHM turns up around till €820, everything stays healthy and within a controlled correction, setting up a prime long opportunity. But if we keep pushing higher, the risk of major downside increases exponentially. Trying to catch a falling knife at that point is a death wish - investors should allocate margin accordingly to avoid liquidation.

Bears have placed meal-kit orders here at HelloFresh
- bearish sentiment in Europe
- overextended rally on the monthly chart
- decreasing volume on the monthly chart
- crappy fundamentals
- clean bounce off resistance on the monthly, weekly and daily (log) charts
happy raiding!

German Telekom - Dt. Telekom - WeeklyGerman Telekom: Performing a strong uptrend as a part of an A-B-C Correction of the former downtrend.
On the right side in red all the important gaps from the past are mentioned. Resistances' are in black.


NVDA Watching key supportNVDA short-term trade (15-min chart): Watching key support—if it holds, looking to go long.

Porsche (PAH3): German Auto Industry under pressureLooking at Porsche on the monthly chart, we’re analysing its entire price history since becoming a publicly listed company in April 2001. After a massive rally to its peak at €160, the stock experienced a sharp decline back to its IPO levels. Since then, it has traded within a well-defined range between €94 (range high) and €35 (range low), with the mid-range around €65.
Each time the range low was reached, the price subsequently moved back toward the range high, demonstrating the typical characteristics of a range-bound market. Now that Porsche is back at the range low, coupled with the RSI at its second-lowest level ever, we see this as a strong opportunity to gain some exposure to the German automotive market.
Admittedly, the German auto industry is under pressure, with Porsche's deliveries to China down 29% year-over-year. Chinese EVs are currently outpacing German luxury cars in technology, making it difficult for Porsche to regain market share. However, this level represents one of the best opportunities for a swing trade.
If the range low is broken and prices drop to COVID-era levels, Porsche would face significant challenges, requiring major developments to recover. For now, we expect a move back toward the range high over time. While this is a long-term play given the monthly timeframe, it offers a promising swing trade setup.
Key Levels:
Range Low: €35
Mid-Range: €65

Hannover Rück / HNR1 / Symmetry and SeasonalityI am looking at that Chart again because i bought this stock on 14.10.2024.
Not the best trade so far, - but since this company give good dividents and can in my View seen as a value investment I dont give too much about the short term result and I am not worried.
On the chart I drew an arrow for the first strong move and copied tat arrow to start again from the low of the correction we are in right now. A 2nd dotted arrow I drew from the same starting point of observation to the highest point in the correction and again copied that arrow to project a price target for a potential next upmove.
Together with some fibonacci / percentages I marked a target area....
Seasonality analysis suggests that this move should come soon and then could (like the first strong upmove) reach a somewhat 10% gain for me (entered at 260 euro per share).
Maybe this makes sense for you ? Leave a comment and/or like.
Hope it helps to find a profitable entry in a good trade...
Cheers!

BMW - a possible end for this horrifying trend?I was a huge fan of the stock long time age because it was for me an extremely underrated stock which was very cheap compared to the earnings and I liked the fact that BMW could constantly increase their earnings each quarter a lot. I sold long time ago because it had to make a retracement for a new buying opportunity. And I personally think we are very close to a new entry of a long trend for the stock with a new ATH. Its because the stock does not really show signs for further retracements, because its slowly moving aside the same level between 75 -80 Euros since several weeks which shows theres not much downwards force anymore meaning sellers. Therefore the stock is very cheap valued again and from the chart it looks very good. In general I see a short trend incoming for American stocks and a long trend for European stocks.

Auto1: buying high and selling higher opportunityAuto1 is currently in a bullish trend, making it an attractive opportunity for momentum traders. The price action suggests a 'buy high, sell higher' scenario, where the stock's upward momentum could continue to deliver gains. Traders may consider entering now to capitalize on this trend, as the stock seems poised to reach new highs in the short to medium term. However, keeping an eye on key support and resistance levels will be crucial to managing risk effectively

Short, target 184.9Following Siemens in daily chart.
I am mostly bearish in German stocks. For Siemens, I got a weekly short call o Monday and today a short call again in daily chart.
TP1 188.6
TP2 186.2
TP3 184.9 - my main target.
You can stop above 195 daily candle close.

FreseniusGood monthly setup for Fresenius. Broke up descending channel, then confirmed. Now we have beautiful monthly candle giving probabilities for an upside move (hopefully above 34.60). The 3 years distance from MA shows almost the same (broke up, retest, now moving).
Very clear Fibonacci resistances around 41-44. It seems to me a good defensive play for long term. It pays nice dividend as well.
Always do your own research!


Adidias - more downside awaiting (?)I chose to present the chart as log scale to show more clearly the sub-waves of the white impulse count. Without that the impulsive structure of the waves wouldn´t be easy to see.
My main scenario is that Adidas will become cheaper in the foreseeable future as market price broke the structure indicated by going below the white "IV".
Also, the current uptrend on the weekly doesn´t look bullish at all as it is lacking impulsive price behaviour.
The indicators also suggest that the stock topped a while ago and we can see a bearish cross on the MACD and different kinds of divergences on the RSI.
My alternative suggests that the wave V is not finished. (light blue count) However, I do not like the deep retracement for the wave 4 in that case and that is why it only my alternative.

Milwaukee power toolsLong term buyer and user of their products.
Best in the business.
+10% ROIC
38% margins
12% FCF
PE Range 16-33 currently 22x

[PAH] Porsche Holding SE | 2025 Update - Entry rejectedHello,
quick update on the potential reversal trade for :
Assuming that the fundamentals were checked and the Idea was to be contrarian to the overall negative sentiment towards Porsche Holding SE:
***Info to the video and the comment on the Euro-Dollar :
First thing coming to mind is that, Porsche 'would profit' as an exporteur from a declining Euro.
However, Porsche Holding SE as a german car manufacturer is affected from the same negative fundamentals (i.e. difficult success to energy, inflation of raw materials, rekt consumer...) that are leading to a certain decline of its native currency.
More on that in my idea.

R3NK - Short term short tradeIt has been consolidated in this level for a long time, it will generally try to make an upward price actions.
however we expect a small correction right before here.

Siemens Energy bullishSiemens Energy seems to be in wave 3 of 5 and should continue the bullish trend till summer 2025
RSI and price action support lines added

Wait 48 (buy Limit)I strongly believe that this will reach 48 and from there will bounce for the long term.
It is here that I have set the best deal price.

FRE Mean Reversion ShortRally has moved to range-bound market on weekly chart since September 24. RSI near 70 on the daily, and although MACD looks slightly bullish, volume behind this latest move towards the upper channel line doesn't seem strong enough.
Short position near channel line with a tight stop (c. 1.0x ATR). Target is lower channel line, and if breakout to the lower side succeeds, until the next strong support at 30.7

Bayer stock : Contrarian storyBayer stock might be considered a contrarian investment:
Legal overhang from Monsanto acquisition: The ongoing litigation related to the Roundup herbicide has created significant uncertainty and negatively impacted Bayer's stock price. A contrarian investor might see this as an overreaction and believe the company's long-term value will prevail.
Undervalued compared to peers: Some analysts believe Bayer is undervalued compared to its competitors in the pharmaceutical and agricultural industries. This could present an opportunity for contrarian investors who believe the market has overcorrected.
Potential for turnaround: Bayer has faced challenges in recent years, but the company is taking steps to address its issues, including restructuring and focusing on innovation. A contrarian investor might bet on the success of these efforts and a future rebound in the stock price.
Risks to consider:
Uncertainty about the outcome of the Roundup litigation: The potential financial impact of ongoing and future lawsuits remains a significant risk for Bayer.
Challenges in the pharmaceutical and agricultural industries: Bayer faces competition and other challenges in its core business segments.
Execution risk: There's no guarantee that Bayer's restructuring and innovation efforts will be successful.
