AKTOR HOLDING – Bullish Breakout with Strong MomentumPrice Action Overview
The stock is currently trading at €5.63, up +4.65%, with a strong bullish candle and a significant increase in volume, suggesting strong buying interest.
A clear bullish breakout has occurred from a consolidation zone near the €5.30–€5.40 range.
Key Fibonacci Levels
From the Fibonacci retracement drawn:
The stock retraced to the 0.0 level (€5.05) and formed a higher low (HL)—this is a bullish signal.
After reclaiming the 0.618 retracement level (€5.35) and 0.786 (€5.44), the stock has broken above the previous high (€5.54), confirming bullish momentum.
Extension Levels:
1.272: €5.67 – recently surpassed.
1.414: €5.74 – short-term resistance.
1.618: €5.84 – potential mid-term target if the trend continues.
Market Structure
I-CHoCH (Internal Change of Character) marked after a pullback.
Followed by CHoCH (Change of Character) confirms the transition from bearish to bullish trend.
Strong higher low (HL) and new higher high (HH) structure visible.
Support & Resistance
Immediate resistance: €5.67 (1.272 Fib extension), then €5.74 and €5.84.
Support: €5.44 (0.786 Fib), then €5.35 (0.618 Fib), and major support at €5.05 (previous swing low and area of interest).
Volume Analysis
Sharp volume spike on the breakout candle is very bullish. This indicates institutional or strong retail participation.
The volume confirms the validity of the breakout.
Trend Indicators
Moving averages (likely EMA20, EMA50, EMA100 based on color) are sloping upward.
Price has decisively broken above all key MAs, indicating a strong uptrend.
Bias: Bullish.
Near-term target: €5.74 (1.414 extension), possibly €5.84.
A pullback to €5.44–€5.54 could offer a buy-the-dip opportunity.
A break and close above €5.74 would open the way for continuation to €5.84 and beyond.

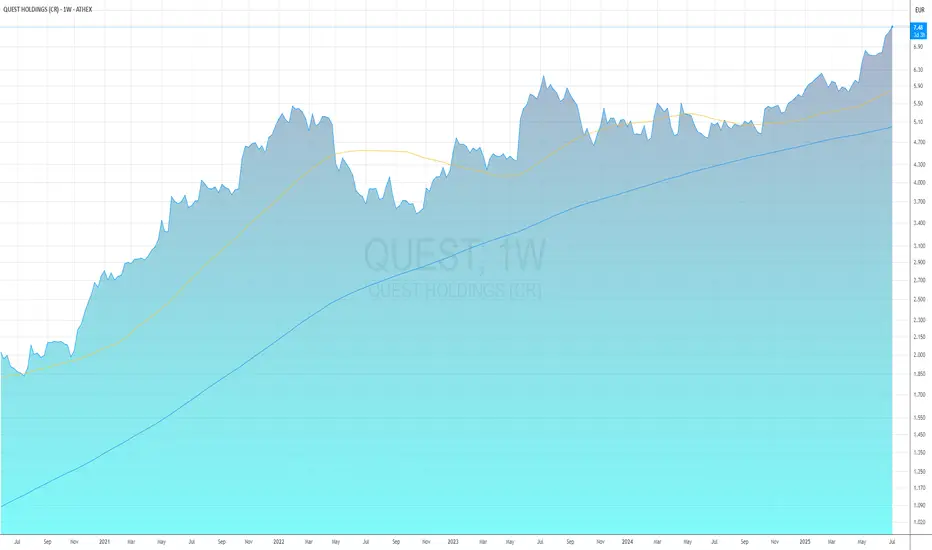
Quest Holdings: A Strategic Pivot and the Prospect of ShareholdQuest Holdings: A Strategic Pivot and the Prospect of Shareholder Returns
**ATHENS, GREECE** – Quest Holdings (ATH:QUEST) has been a standout performer on the Athens Stock Exchange, with its share price demonstrating a significant upward trend over the past year. This rally is underpinned by the company's solid financial performance across its diverse segments and, more recently, by a strategic move that has unlocked substantial value: the sale of a stake in its successful courier subsidiary, ACS. Now, investors are keenly anticipating what the company will do with its bolstered cash position, with many eyeing a potential, significant capital return.
Strong Performance and Strategic Growth*
Quest Holdings has consistently delivered robust results, showcasing growth across its primary business pillars: IT services (Uni Systems), commercial activities (Info Quest Technologies, iSquare), and green energy. The group's ability to expand its IT services internationally and capitalize on the strong demand for digital transformation projects has been a key driver of its profitability. For 2025, the company projects continued revenue growth and an even higher growth rate for its operating profitability (EBITDA), which is expected to surpass €100 million.
This solid operational performance has provided a strong foundation for the stock's appreciation, which has seen its price rise by over 40% in the last 12 months, hitting new 52-week highs in early July 2025.
The Game-Changing ACS Deal
The most significant catalyst for Quest's recent momentum was the strategic agreement announced in late 2024 for its courier services arm, ACS. Quest Holdings agreed to sell a 20% stake in ACS to General Logistics Systems (GLS), a major European parcel and express service provider and a long-term partner of ACS.
Key details of the transaction:
* **Sale Price:** The 20% stake was sold for a consideration of approximately €74-€77 million.
* **Call Option:** Crucially, the deal includes a call option for GLS to acquire the remaining 80% of ACS shares. This option can be exercised on either October 31, 2025, or October 30, 2026.
* **Valuation:** The agreement implies a minimum valuation of €370 million for 100% of ACS, a figure that crystallizes the significant value Quest has built in the courier business over 25 years.
This deal was a strategic masterstroke. It not only brought a substantial cash injection into Quest Holdings but also secured a powerful strategic partner for ACS, ensuring its continued dominance and growth in the Greek market with planned investments in sorting centers, electric vehicles, and digital transformation.
Anticipation of a Capital Return
The successful sale of the ACS stake has significantly strengthened Quest's already healthy balance sheet. At the end of 2024, the group boasted a net cash position of €82 million, fortified by the proceeds from the deal. This has given the management ample firepower for new investments, such as the recent acquisition of a majority stake in the home appliance company Benrubi.
However, the key question on every investor's mind is shareholder remuneration. With such a strong cash position and the prospect of an even larger windfall if GLS exercises its option to buy the remaining 80% of ACS, the market widely anticipates a generous capital return.
Analysts covering the stock have already begun to factor this into their models. Some reports suggest the possibility of a **special dividend** distributed from the proceeds of the initial 20% sale, on top of the company's regular dividend payout. Quest has a track record of rewarding its shareholders, and the current financial strength provides a solid basis for such a move.
Outlook: A Value Proposition
Even after its recent rally, many analysts believe Quest Holdings remains attractively valued. When stripping out the implied €370 million valuation of ACS from the group's total enterprise value, the remaining core businesses—particularly the high-growth IT services and the margin-accretive commercial activities—appear to be trading at a compelling discount compared to their peers.
The combination of:
* Consistent growth in core operations.
* A strategic, value-unlocking deal with ACS.
* A robust balance sheet with a strong net cash position.
* The high probability of a significant capital return to shareholders.
...presents a powerful investment case. As the October 2025 deadline for the first GLS call option approaches, all eyes will be on Quest Holdings, not just for its operational performance, but for its next move in rewarding the shareholders who have supported its successful journey.
Position trade with 30%+ upside potentialWith OBV nearing ATH, a decent earnings report and a breakout from a descending triangle, EXAE seems like the perfect candidate for an easy 30% profit. Entry at €4.45 and price target at €5.90. Based on market conditions when stock price will reach our take profit target, we will reconsider whether closing the position (or part of it) is the best choice or if letting it run is the better strategy. With resistance at €5.8, support at €4.29 and a breakout at €4.45, the target is set at €5.90+. When conducting an analysis with Fibonacci levels, €5.20 and €5.80 are considered as the next resistance levels (or price targets).

PPC: The Most Undervalued Utility Stock in EuropePublic Power Corporation (PPC), Greece’s largest utility company, remains significantly undervalued on the stock market, despite its strong fundamentals and ambitious growth strategy. While European utility stocks are gradually re-rating, PPC continues to trade at a steep discount, indicating a disconnect between its financial outlook and market valuation.
Where PPC’s Valuation Stands Today
In its latest report, Eurobank Equities raised its price target for PPC to €18 (from €17), reiterating a "Buy" recommendation. However, the stock still trades well below that level, highlighting its undervaluation.
Key valuation multiples versus European peers:
Metric PPC 2025 Peer Average EuroStoxx Utilities
P/E 11.9x 14.3x 13.8x
P/E 2026 10.3x 13.1x 13.8x
EV/EBITDA 2025 6.2x 8.0x 7.6x
EV/EBITDA 2026 6.3x 7.7x 7.6x
Across all key years, PPC trades at a 20–30% discount to both its peer group and sector indices, despite offering equal or superior growth prospects.
Strong Growth Prospects: +10% EBITDA CAGR
PPC is forecast to grow its EBITDA at an average annual rate of 10% between 2024 and 2027, based on conservative projections by Eurobank Equities. The company itself has set a more aggressive EBITDA target of €2.7 billion by 2027, compared to the broker’s estimate of €2.4 billion — a discrepancy that reflects the cautious stance of analysts.
Comparison with Major European Players
Company Forecast EBITDA Growth (2024–2027) EV/EBITDA 2025 Notes
PPC +10% 6.2x Strongest growth and among the cheapest
Engie (France) +2.5% 5.7x Low valuation, but weak growth
Orsted (Denmark) +9% 8.1x Decent growth, expensive stock
Iberdrola (Spain) +6% 8.5x Established leader, premium pricing
PPC delivers the highest projected EBITDA growth among its European peers while maintaining one of the lowest valuations, a clear sign that the market is overly discounting execution risks.
Leverage and Investments: A Manageable Strategy
Despite embarking on a €7.5 billion investment plan for 2024–2026, PPC maintains a healthy capital structure. The net debt/EBITDA ratio is projected to remain around 3.5x, which is considered reasonable for a utility with regulated cash flows.
The investment focus includes:
Renewables: Targeting 5 GW of installed capacity by 2026
Grid upgrades and smart meters
Gradual lignite phase-out and plant modernization
These are long-term value-generating investments, boosting efficiency, lowering risk, and enhancing sustainability.
Why Is the Market Ignoring PPC’s Upside?
PPC’s stock has failed to track the rally in both European utilities and non-financial Greek equities. Investors seem wary of the bold targets set by management and are pricing in high execution risk.
Yet this caution appears disconnected from the company’s track record and financials. PPC has:
Delivered consistent earnings growth
Improved margins year over year
A clear and methodical expansion strategy
The market’s hesitation leads to a valuation mismatch that appears unjustified based on fundamentals.
Re-rating Has Yet to Materialize
While European utility stocks have experienced a mild re-rating, PPC has lagged. Should it converge even partially with sector averages, its stock price could see substantial upside. A simple alignment of PPC’s EV/EBITDA multiple with the peer average (8x) would imply a fair value well above €20, even using conservative 2025 EBITDA estimates.
Bottom Line: Undervalued with Strong Fundamentals
PPC is not just cheap — it’s the cheapest major utility stock in Europe, with:
Leading growth forecasts
Prudent debt management
High-return, forward-looking investments
Reasonable targets that remain underappreciated
As market perception catches up with performance, revaluation potential is significant. PPC stands out as one of the most attractive value plays on any European exchange, not just within Greece.

GEK TERNA: The Investment Gem Yet to Shine TP: 27,4€Despite explosive growth in operating profitability, strategic participation in infrastructure projects, and consistently improving financials, GEK TERNA’s stock remains undervalued—failing to reflect either the group’s current position or, more importantly, its future prospects. With a target price of €27.4 and a current price around €19, the stock offers over 43% upside, according to Axia Research. Yet, the market still hasn't priced in one of the most steadily growing names on the Athens Stock Exchange.
Strong Start to 2025
GEK TERNA posted a robust Q1 2025 performance, beating expectations. Revenue rose 49% to €989.4 million, and adjusted EBITDA surged 55.1% to €135.5 million. Despite increased depreciation and higher financial expenses, net profit came in at €26 million, almost on par with Q1 2024’s €27.1 million.
This strong performance was mainly driven by concessions and construction. The full consolidation of Attiki Odos played a key role, while construction activity benefited from a massive backlog of €6.7 billion. Notably, about 52% of this backlog involves projects where GEK TERNA is also an investor, securing dual revenue streams and increased efficiency.
Attiki Odos and the 9% Yield
One of GEK TERNA’s most strategic moves was acquiring Attiki Odos. This asset is not just capital-intensive but operationally critical, offering stable, predictable cash flows with high yield. According to the company, €60 million in cash distributions are expected in 2025. Given GEK TERNA’s equity investment of €670 million, this implies a 9% cash yield.
Moreover, under the agreement with Latsco to sell a 10% stake in Attiki Odos, the deal value is €80 million—highlighting the asset's attractive return profile, low risk, and strong liquidity.
Construction Margins at 13.5%: A Rare Feat
Construction remains a cornerstone for GEK TERNA, not just in terms of project volume but also margins. The EBITDA margin in Q1 reached 13.5%, up 230 basis points year-over-year. This performance significantly exceeds industry averages, largely due to projects with GEK TERNA’s own equity participation, boosting overall profitability.
Axia describes construction performance as “strong and sustainable,” forecasting continued earnings momentum in the coming quarters.
Energy Segment Withstands Pressure
Despite pricing pressures and stiff competition in the electricity market, GEK TERNA increased operating profitability in energy by 10%. Once the group's core growth driver, this segment now offers stability amid market volatility.
Special focus is being placed on the CCGT unit in Komotini (887MW), expected to be fully operational soon. In parallel, strategic talks with Motor Oil are underway for potential synergies in conventional energy—moves that could further strengthen the group’s operational foundation.
Rich Project Pipeline Ahead
Growth catalysts remain strong. Axia highlights several key developments:
Egnatia Odos Concession: A mega-project expected to become operational by end-2025 or early 2026, generating new concession revenue streams.
Komotini CCGT Station: Its commercial operation will bolster energy operations.
Amfilochia Hydro Project (730MW): Masdar’s potential exercise of a put option to sell its 50% stake could bring capital inflow and added flexibility.
Strategic Energy Partnerships: Expected to unlock added value through synergies and economies of scale.
Target Price: €27.4 – The Disconnect Between Valuation and Reality
Axia Research reaffirmed its €27.4 price target, maintaining a “buy” rating, suggesting a 43.5% upside from June 2’s close at €19.09. The report emphasizes that the current valuation doesn’t reflect GEK TERNA’s cash flow strength, profit margins, or significantly reduced operational risk, now mitigated by diversification and recurring concession revenue.
In a market often driven by hype and speculation, GEK TERNA stands out as a case study of intrinsic value yet to be realized by the board. Backed by analysis, steady cash flow, a diversified business model, and a proven track record in executing large projects, the stock’s upside remains substantial—and largely untapped.
GEK TERNA: 5.08% Stake Changes Hands at €19 (06.04.25)
Three block trades totaling 2.37% of GEK TERNA changed hands on the Athens Exchange, involving 900,000, 1,207,000, and 350,000 shares respectively—all at €19/share, despite the stock trading above €19.30.
The combined transaction value reached €46.87 million. Later in the session, five additional blocks traded at the same price, totaling 2.7 million shares worth €52.3 million.
Sources indicate that the placement involved institutional investors, with no shares sold by key shareholder Giorgos Peristeris.
Following GEK TERNA’s strong Q1 results, investor interest is intensifying, with many portfolios seeking exposure. As per the company’s announcement, revenue rose 49% to €989.4 million and EBITDA increased 55.1% to €135.5 million in the first quarter of 2025, with all business segments showing growth.

Pressure on MYTIL Stock Amid Market Turmoil The stock of Mytilineos (ticker: MYTIL), one of the most closely watched stocks on the Athens Stock Exchange, recorded a notable decline on the 4-hour chart, against a backdrop of widespread market negativity. The most recent candlestick shows a drop of 2.44%, with the price closing at €44.74, while the total daily loss reached -1.36%.
This sharp decline was accompanied by very high trading volume (291.16K), highlighting significant selling activity. Such a spike in volume may signal the beginning of a profit-taking phase or even a possible trend reversal.
Technical Picture: Signs of Exhaustion
Analyzing key technical indicators reveals that MYTIL has reached a critical technical zone. While the price remains above the 50, 100, and 200-period EMAs (€42.60, €41.06, and €38.96 respectively), the break below the EMA 20 (€43.81) and fading bullish momentum suggest that a local top may have been formed around €45.90.
Moreover, the MACD indicator is showing early signs of weakness. Although it remains in positive territory (MACD line at 0.8738, signal at 0.6736), the histogram is fading (currently 0.2002), indicating that bullish momentum is losing steam.
This view is further supported by the RSI (14), which has dropped to 61.38, exiting overbought territory and signaling that buying strength is weakening.
Fibonacci Retracement & Support Levels
Looking at Fibonacci retracement levels from the recent upward move, the price has tested the 0.236 level (~€44.00), acting as immediate support. Additional key support levels are located at:
0.382 = €43.40
0.5 = €42.45
0.618 = €41.50
The 0.618 level aligns closely with the 100-period EMA, making it a strong technical zone to monitor if the selloff continues.
Long or Short? What Are Traders Focusing On?
From a tactical perspective, the current chart favors short setups. A potential short entry between €44.74–45.00, with targets at €43.40 or even €42.50, and a stop-loss above €46.00, offers an attractive risk/reward ratio (~1.8).
In contrast, a long position would only be justified if the price finds firm support near €43.40 and confirms a rebound with momentum and volume. Until then, the bears seem to have the upper hand.

OPAP Revenue Surge: A Powerful Quarter Ahead – What to ExpectOPAP Revenue Surge: A Powerful Quarter Ahead – What to Expect on the Stock Market
The first quarter of 2025 is shaping up to be a blockbuster for OPAP, according to the latest data from the Hellenic Gaming Commission (EEEP). Based on the statistics for January through March, the company is heading into a very strong quarter, and this momentum is expected to make a noticeable impact on the Athens Stock Exchange.
The Numbers Speak for Themselves
In Q1 2025, OPAP (Retail and VLTs) reported Gross Gaming Revenue (GGR) of €373.3 million, marking a 4% increase compared to the same period in 2024, when GGR stood at €359 million. When factoring in OPAP’s online market share—estimated at 50% to 53%—the total GGR from OPAP-related activities is projected to be around €540–550 million for the first quarter.
OPAP’s Adjusted Total Gaming Revenue (TGR) reached €1.81 billion in Q1 2025, up 1.36% from €1.78 billion in Q1 2024.
State Contributions Also on the Rise
The growth isn’t limited to revenue. OPAP’s contributions to the state are also surging. Public participation rights totaled €55.9 million in Q1 2025, showing a 39% increase over 2024’s €40.3 million.
In addition, the withholding tax on player winnings rose to €34.3 million, up 8.2% from €31.7 million in the previous year.
Dominance Over Competitors
OPAP continues to lead the gaming market. Its share of total GGR for Q1 2025 is 50.3%, compared to 52.6% in 2024. This slight dip is mostly due to the sharp rise of online gaming operators, whose GGR jumped to €271.1 million in 2025 from €234.4 million in 2024—a 15.7% increase.
However, since OPAP controls a significant portion of the online sector through Stoiximan (Kaizen), this revenue still contributes to its overall footprint. Even a 50% share of the online GGR would add roughly €135 million to OPAP’s revenue, pushing the total closer to €508 million. At 53%, that figure rises to €516 million.
A Powerful Quarter in the Making
The data points to a record-breaking quarter for OPAP:
+4% increase in retail GGR
+8.2% increase in withholding tax
+39% increase in public participation rights
Stable adjusted TGR at over €1.8 billion
€135–140 million in added GGR from OPAP’s online share
This performance signals strong operating and financial momentum, which is expected to translate into investor confidence and stock gains. Analysts are already anticipating stronger EBITDA and net profitability, to be confirmed in OPAP’s official financial results.
On the Athens Stock Exchange
OPAP stock is traditionally one of the most resilient and attractive picks on the Greek stock market. With Q1 revenue likely surpassing projections, the stock could experience bullish movement, drawing interest from both institutional and retail investors.
Given OPAP’s consistent dividend policy, solid cash flow, and growing market presence, the stock remains appealing. If the company maintains this pace, 2025 is set to begin on a high note, and this will inevitably be reflected in its valuation.
OPAP isn’t just holding its ground—it’s gaining momentum. The first quarter of 2025 already shows exceptional performance across all key metrics, and this momentum is likely to fuel further growth throughout the year. With higher revenues, increased contributions to the state, and a dominant online presence, OPAP is poised for a very strong showing on the stock exchange. Investors, take note—this could be one of the defining quarters of the year.

HELLENiQ ENERGY: Shock Collapse in Results HELLENiQ ENERGY: Shock Collapse in Results
HELLENiQ ENERGY’s Q1 2025 financial results have taken a nosedive, sparking concern in the market and raising alarms about the energy giant’s resilience under pressure.
The numbers speak for themselves: net profits plunged to €11 million—a shocking 94% drop compared to €179 million in the same quarter of 2024. Comparable net profits also fell dramatically to €55 million from €164 million—a 66% decline.
Despite the company’s attempt to sugarcoat the outcome with statements about “satisfactory results in a weak refining environment,” the raw data shows a steep decline across all critical metrics. EBITDA dropped 65%, and sales were down 17%, landing at €2.73 billion from €3.28 billion the previous year.
Even comparable EBITDA—the most popular metric for assessing a company’s true operational performance—fell 47%, dropping to €180 million from €338 million in Q1 2024.
Operating profits plunged 84%, from €268 million to just €43 million. This collapse suggests the downturn isn’t just about accounting tweaks or revaluations—it’s a clear sign of major operational weakness.
What If This Happened in the U.S.?
Imagine for a moment that these results came from a U.S. refining giant like Valero or Marathon Petroleum. A 94% drop in net profits, 65% in EBITDA, and 17% in sales would trigger chaos:
The company’s stock would nosedive, likely with a double-digit percentage drop on day one.
Financial media and analysts would brand the collapse “catastrophic” and demand answers from the executive team.
There would be immediate pressure for leadership shakeups, restructuring, or even asset sell-offs.
Some analysts might question the sustainability of the business model—especially in an era of rapid energy transition.
Wall Street doesn’t tolerate steep declines. Investors expect constant adaptation and performance, and even the faintest sign of weakness sets off a chain reaction of sell-offs.
What’s Behind the Fall?
HELLENiQ ENERGY’s management attributes the crash mainly to:
A challenging international refining environment, marked by lower margins and oil prices.
A planned general maintenance shutdown at the Elefsina Refinery, which went offline at the end of March.
While maintenance is necessary and scheduled, its impact—combined with a weak global market—has been devastating. Refining sales volumes fell 11% to 3.5 million tons, down from 3.98 million tons year-over-year.
Production also declined. And although ELPEDISON and Renewables contributed €40 million in EBITDA, that wasn’t nearly enough to offset the massive losses in core refining.
A Light at the End of the Tunnel or Just Cosmetic Fixes?
Despite the bleak numbers, the company is choosing to focus on liquidity, refinery maintenance progress, and updates to its energy transition strategy. But these measures struggle to mask the image of a business whose profitability nearly vanished in one quarter.
Net debt jumped to €2.486 billion—a 42% increase year-over-year. The debt leverage ratio rose by 11 percentage points, from 36% to 47%, indicating the company is leaning heavily on borrowing to maintain liquidity.
What Should Raise Concern?
The consistency of these results. If this trend continues in coming quarters, it’s not just a temporary hit—it’s a structural problem.
Overreliance on refining. Despite progress in renewables and electricity, HELLENiQ ENERGY still depends heavily on a segment facing wild fluctuations and global pressures.
The need for a faster energy transition. These results are perhaps the strongest argument yet for diversifying the portfolio and moving more aggressively into stable, green energy sources.
Q1 2025 has slammed HELLENiQ ENERGY into a wall. The historic profit collapse leaves no room for spin. If a company of this size in the U.S. posted similar results, it would face fierce backlash from the market. HELLENiQ must now prove in the coming months that this was a one-off shock—not the start of a prolonged decline.

JUMBO (BELA) Comprehensive AnalysisThe JUMBO stock recorded a significant drop of 1.90% yesterday, closing at 24.72 euros, which is the lowest level in the last six months . The dividend cut has affected the stock price, but forecasts from major analysts indicate significant upside potential.
Last Closing Price: 24.72 euros
52-Week High/Low: 32.60 euros / 24.72 euros
Economic Analysis
Jumbo maintains a high dividend policy for 2024 despite market challenges. The company distributes 3% of its shares, with Apostolos Vakakis reducing his stake to 16.3%. The high dividend yield, combined with the expansion of the store network, enhances the attractiveness of the stock.
Expected Dividend Yield: 9.1%
2024 Revenue Growth Estimate: 4%-8%
Expected 2024 Earnings: Stable or slightly increased
Lowering Revenue and Profit Targets – Warning of Possible Revision
Jumbo informed investors that group sales increased by approximately 8% in the first half of the year, with a +9% increase recorded in June compared to the same month last year. Nevertheless, the company sets the bar for revenue and profit growth for the year at the lower end of the initial estimate of 8%-10%.
Jumbo warns that if current conditions worsen, which is reasonably expected, the sales growth rate could be limited to +4% with profitability hovering at 2023 levels.
Factors Affecting the Estimate
Commenting on the business environment, the company mentions that the situation in the Middle East, with the "closure" of the Suez Canal, although initially temporary, will continue to affect the global supply chain likely even after the elections in America. The current global trade situation resembles the pandemic crisis, with transportation costs skyrocketing and delivery times doubling.
Jumbo refuses to pass the burden of supply chain disruptions onto consumer prices. The company's strategy remains clear: it does not intend to offer overpriced products, as it estimates that the situation will reverse by the end of 2024 or 2025.
Jumbo's Strategy
Jumbo chooses products that meet the needs and capabilities of consumers. Faced with the dilemma of a product that includes the cost of disruptions and another with manageable costs, the company chooses the latter. This strategy is expected to lead to an increase in Jumbo's market share in the markets it operates, despite the expected reduction in inventory by the end of the year.
First Half 2024 Performance
Group sales increased by approximately +8% in the first half of 2024. In June 2024, sales recorded an increase of +9% compared to the same month last year.
Detailed sales performance by country:
Greece: Net sales increase of +6% in June 2024 and +7% for the first half.
Cyprus: Sales increase of +6% in June 2024 and +4% for the first half.
Bulgaria: Sales increase of +19% in June 2024 and +11% for the first half.
Romania: Sales increase of +17% in June 2024 and +14% for the first half.
Store Network Expansion
As of June 30, 2024, the JUMBO Group had 86 stores: 53 in Greece, 5 in Cyprus, 10 in Bulgaria, and 18 in Romania, with online stores in Greece, Cyprus, and Romania. By the end of 2024, two new superstores are expected to open in Nicosia and Bucharest. The opening of the new superstore in Timisoara is postponed to the first quarter of 2025.
Through partnerships, the group has a presence with 36 stores in 7 countries: Albania, Kosovo, Serbia, North Macedonia, Bosnia, Montenegro, and Israel. A second store in Israel is expected to start operating in August 2024.
It is reminded that on July 16, 2024, the dividend from the 2023 earnings, amounting to 1 Euro per share (gross), will be paid.
Citi and Pantelakis Securities See Over 20% Upside Potential for the Stock
Citi and Pantelakis Securities predict more than 20% upside potential for Jumbo stock, despite the recent downgrade of the guidance from the company's management for the 2024 results.
Citi Estimates
Citi maintains the target price at €32.5, with an estimated upside of 23.9% from current levels. Combined with the dividend yield expected to reach 9.1%, the total return is estimated to reach 33%. The investment bank issues a buy recommendation for the stock.
The target price of €32.5 derives from the average valuation based on the EV/EBITDA multiple, estimating that Jumbo will trade at 9 times the EV/EBITDA ratio for 2025 with a slight premium compared to the 5-year average, and from the discounted cash flow method. The target price implies approximately 14 times the P/E ratio for 2024, according to Citi.
Pantelakis Securities Estimates
Pantelakis Securities sets the target price at €36, with an estimated upside of 37%. They give an overweight recommendation and highlight that Jumbo is attractively priced at 10.1 times the P/E ratio for 2025 and 6.8 times the EV/EBITDA ratio.
Pantelakis Securities calculates that the market at current levels discounts a long-term drop in the EBITDA margin to 17.8% from 36.8% in 2023, which is not justified. Furthermore, they mention that the strong cash flow performance in 2025 at 8% and the generous and sustainable dividend payments (6.9%) further enhance Jumbo's valuation attractiveness.
Conclusion
Despite the downgrade of the guidance from Jumbo's management for the 2024 results, both Citi and Pantelakis Securities see significant upside potential for the company's stock. Their forecasts are based on stable valuations and estimates for strong cash flows and sustainable dividend yields, making Jumbo stock an attractive choice for investors.
Detailed Report
Jumbo, one of the leading retailers in Greece, operates in the sale of toys, baby products, gift items, household goods, stationery, seasonal and decorative items, books, and related products in Greece, Cyprus, Bulgaria, and Romania. This analysis focuses on the financial data and technical indicators of Jumbo S.A.'s stock, providing a comprehensive overview for investors and analysts.
Technical Analysis
Open: €25.24
High: €25.24
Low: €24.72
Close: €24.72
Moving Averages (EMA):
EMA 20: €25.52
EMA 50: €26.05
EMA 100: €26.42
EMA 200: €26.54
Jumbo's stock price is below all major moving averages, indicating a downward trend in the short, medium, and long-term horizons.
Relative Strength Index (RSI):
RSI (14): 31.23, indicating that the stock is in the oversold zone.
MACD:
Histogram: 0.0070
MACD: -0.3640
Signal: -0.3711
The MACD indicates bearish momentum, with the MACD line below the signal line.
Pivot Points
Support Levels:
S1: €24.82
S2: €24.30
S3: €23.84
Resistance Levels:
R1: €25.89
R2: €26.26
R3: €26.78
The stock price is near the first support level, indicating potential reversal points.
Financial Data
Key Statistics:
Market Capitalization: €3.43B
Trading Volume: 123.75K (30-day average volume: 173.45K)
P/E Ratio: 11.3x (below the Greek market average)
Revenue Estimate: €34.14
Analyst Forecasts:
Highest Estimate: €38.00
Lowest Estimate: €31.10
Average Estimate: €34.14
Analysts predict a 38.12% increase in stock price over the next year, based on current performance and future prospects.
Valuation Estimate
Jumbo's stock appears undervalued compared to its intrinsic value, based on analyst forecasts and market prices.
Future Growth
Key Information:
Earnings Growth Rate: 5.8% annually
Revenue Growth Rate: 7.1% annually
Expected Return on Equity: 23.8% in 3 years
Recent Updates:
Target price increased by 7.7% to €33.89 (May 23)
Target price increased by 7.3% to €33.76 (May 6)
Target price increased by 8.1% to €28.50 (August 11)
Target price increased by 8.4% to €27.64 (June 27)
Past Performance
Key Information:
Earnings Growth Rate: 14.2% annually
EPS Growth Rate: 14.2% annually
Revenue Growth Rate: 6.2% annually
Return on Equity: 22.8%
Net Margin: 28.0%
Jumbo has shown strong performance in previous years, with steady earnings and revenue growth, and high return on equity.
Jumbo S.A. demonstrates solid performance and has good growth prospects. Despite the recent drop in stock price, analysts remain positive about the company's future, with predictions for significant stock price increase over the next year. The company continues to invest in new markets and improve the efficiency of its existing operations, making it an attractive choice for investors.

Piraeus Financial Holdings SA Poised for a Potential Rebound -TAPiraeus Financial Holdings SA's recent price movements suggest the stock might be preparing for a positive turnaround, offering an intriguing opportunity for investors. Currently trading around €3.62, the stock finds itself at a critical support level that could act as a strong base for a potential rally.
One of the key indicators suggesting a possible rebound is the stock's position relative to the 200-day Exponential Moving Average (EMA). Holding above this long-term trend line implies that the broader trend remains bullish, despite recent short-term volatility. Additionally, the shorter-term EMAs are showing signs of convergence, often a precursor to a breakout.
Volume analysis also paints a promising picture. Recent downtrends have been accompanied by high trading volumes, a sign that suggests strong buyer interest. This accumulation phase could signal that investors are taking advantage of lower prices, setting the stage for an upward movement.
Technical indicators further support this optimistic view. The Moving Average Convergence Divergence (MACD) is approaching a potential bullish crossover, hinting at a momentum shift. Meanwhile, the Relative Strength Index (RSI) is hovering around 38, nearing oversold territory. A bounce from this level could indicate that selling pressure is fading, paving the way for buyers to step in.
Fibonacci retracement levels also show that the stock is navigating key support zones. A rebound from current levels could target the 0.618 and 0.5 retracement levels, providing a clear path to recovery if momentum shifts. Furthermore, pivot points highlight that a move above €3.624 could aim for resistance at €3.987, indicating a potential reversal pattern.
Overall, Piraeus Financial Holdings SA seems to be on the cusp of a potential upswing. If current support levels hold and buying interest continues to grow, a bullish shift may be imminent, offering investors a favorable risk-reward scenario in the coming days.
Support Levels:
The stock is currently at a critical support level around €3.62. If this support holds, it could act as a strong base for a potential rebound.
There's a significant Fibonacci support level at the 0.786 retracement level around €3.769, indicating that this price region is a crucial area of interest for buyers.
Moving Averages:
The stock is still above the 200-day EMA, a strong indication that the long-term trend remains positive. Historically, holding above the 200-day EMA suggests that the overall trend has room to move higher.
The convergence of the shorter-term EMAs (20, 50, 100) indicates that a consolidation phase might be ending, potentially leading to a breakout as market forces decide on the next direction.
Volume Analysis:
There have been a few spikes in volume during downward movements, indicating strong interest from buyers. High volume in this context often means that there is accumulation happening, a positive sign of potential price recovery.
MACD Indicator:
Although the MACD line is currently below the signal line, it's nearing a potential crossover. This suggests that momentum may soon shift from bearish to bullish, which could spark a rally.
A bullish crossover would reinforce the idea that the downtrend might be losing steam, with buyers ready to step in.
Relative Strength Index (RSI):
The RSI is around 38, suggesting that the stock is nearing oversold territory. This is often an indicator that a price reversal is on the horizon, providing a good buying opportunity for traders.
Fibonacci Levels:
The current price action is trading within important Fibonacci retracement levels, with the potential to move back towards the 0.618 and 0.5 levels if support holds. These levels could act as targets if the stock begins to move upwards, indicating that there's a strong base for recovery.
Pivot Points:
The stock is close to S2 (€3.624), and if it finds support here, a movement towards the pivot point or even R1 (€3.987) could be feasible. This would represent a bullish reversal pattern if confirmed by upcoming candles.
Positive Outlook Summary:
If the current support levels hold and there's a bullish crossover in the MACD, along with a bounce from the oversold RSI, there’s a strong chance that the stock may resume its upward trend. Traders could look for confirmation with increased buying volume or a close above the recent resistance levels to affirm a positive shift in market sentiment.

Alpha Bank Shows Impressive Performance Alpha Bank Shows Impressive Performance in the First Nine Months of 2024, with Positive Indicators Boosting Investor Confidence and Paving the Way for Upgraded Forecasts for the Rest of the Year.
Alpha Bank reported adjusted net profits of €666 million, showing a 16% annual increase, while net profits reached €489 million. The impressive increase in earnings per share to €0.27 highlights the bank's profitability, with a return on equity of 14.4%.
Net interest income showed a 2% annual increase, while fee income saw an impressive rise of 11%, reaching €306 million. This growth in fee income reflects the bank’s success in diversifying its revenue streams and expanding into payment and wealth management services.
The non-performing exposure (NPE) ratio stands at a low 4.6%, underscoring the resilience of the bank’s portfolio and prudent risk management. Meanwhile, the cost of risk has been significantly reduced to 63 basis points, contributing to the improvement in the bank’s asset quality.
The increase in loans by 8% and deposits by 10% reflects strong customer confidence and the continuous strengthening of the bank’s portfolio. Alpha Bank seems to be adapting exceptionally well to the increased market needs, especially in the business loan segment.
The bank’s balance sheet is well-structured to withstand interest rate reductions, with strong capital adequacy and a proper asset allocation. This provides stability and protection against potential market fluctuations, with minimal impact on net interest income.
The increased demand for business loans is reflected in a 67% rise in corporate loans since 2018, with Alpha Bank outperforming the sector average in loan growth. The positive trend in loan demand is expected to continue, offering further growth opportunities.
Alpha Bank holds a leading position in wealth management, with the largest mutual funds under management in Greece. The expected increase in fee income by 2026, particularly in the payments and wealth management sectors, supports the bank's strategy for revenue diversification.
The bank is on track for further growth in earnings per share, with an expected return reaching €0.35 by 2026, thanks to continuous improvements in operational efficiency and strong financial performance.
Alpha Bank’s capital adequacy is higher than the average of Greek banks, with a CET1 ratio of 15.5%, while over 30% of its market cap is expected to be distributed as dividends by 2026. This strong capital base enables management to reward shareholders while maintaining sufficient capital reserves.
Detailed Financial Data of Alpha Bank for the First Nine Months of 2024
Net Interest Income
Net interest income amounted to €1.243 billion for the first nine months of 2024, showing an annual increase of 2%. Despite stable interest income in recent quarters (€410 million in Q3 2024), the bank manages to maintain a steady income in its core area.
Fee Income
Fee income reached €306 million, up 11% compared to the same period in 2023. This increase confirms the effectiveness of the bank’s strategies to diversify its revenue sources, primarily through payment services and wealth management.
Trading and Other Income
Trading and other income saw an impressive 81% increase, reaching €95 million. This reflects the bank’s success in seizing opportunities in the markets and other investment activities.
Operating Income and Expenses
Operating income for the first nine months of 2024 amounted to €1.643 billion, up 6% compared to the previous year.
Total operating expenses remained steady at €627 million, with no change, indicating successful cost management despite increased activity. The combination of revenue growth and expense stability demonstrates the bank’s improved efficiency.
Pre-Provision Income
Pre-provision income increased by 11%, reaching €1.016 billion. This increase is particularly significant as it strengthens the bank’s resilience to potential risks and lays the groundwork for healthy growth.
Impairment Losses
Impairment losses decreased by 20%, amounting to €173 million. This reduction is very positive, reflecting the improvement in the bank’s portfolio quality and reduced need for provisions against bad loans.
Profit Before Tax
Profit before tax amounted to €838 million, marking a significant increase of 18% compared to the same period last year. This increase reflects the positive impact of cost management and increased revenues.
Net Profit After Tax
Net profit after tax amounted to €489 million, showing a slight decrease of 2% compared to 2023. Although this decrease might seem negative, it is offset by the increase in adjusted net profits.
Adjusted Net Profit After Tax
Adjusted net profit after tax increased by 16%, reaching €666 million. This increase reflects the bank's strong financial performance and positive results without the impact of extraordinary expenses or other adjustments.
Alpha Bank Shares Show Several Positive Indicators According to Analysts:
Undervalued Market Price: Alpha Bank shares are trading at levels significantly below their estimated fair value, with a 55.5% discount. This means it offers substantial value for investors seeking to benefit from its potential future appreciation.
Earnings Growth Forecast: Alpha Bank’s earnings are forecasted to grow at an annual rate of 18.2%, significantly exceeding both the market average and savings rates. Additionally, historical data show a 25.5% annual growth in earnings over the past five years.
Analysts’ Consensus for an Upward Trend: Analysts are optimistic and agree that Alpha Bank’s stock price will rise by around 49.2% over the next year. This reflects market confidence in the company’s potential.
Valuation Based on Price-to-Book Ratio (PB): The price-to-book ratio for Alpha Bank shares is at 0.5x, indicating that the market values the stock at a very low level compared to its net book value. This suggests the stock could be a good buying opportunity relative to its sector.
Strong Financial Health: Alpha Bank shows adequate deposit levels and healthy loan levels, with an appropriate loan-to-deposit ratio of 70%. Although non-performing loans are at 3.8%, this percentage is not high enough to pose a risk, and the company has sufficient provisions for bad loans.
Expected Revenue Growth: Although the forecasted annual revenue growth is 7.9%, this rate is positive for the company’s growth prospects, surpassing the market forecast (5.1%).
Technical Analysis
The technical analysis of Alpha Bank’s stock shows a strong upward trend, supported by various indicators and support and resistance levels.
Moving Averages (EMA)
The Exponential Moving Averages (EMAs) for 20, 50, 100, and 200 periods indicate an upward trend, with the stock trading above all these levels, signaling strong bullish momentum.
Relative Strength Index (RSI)
The RSI is at 80.72, indicating that the stock is in the overbought zone. While this suggests high demand and bullish momentum, it also poses a risk for a possible correction.
MACD (Moving Average Convergence Divergence)
The MACD line (0.0359) is above the signal line (0.0278), indicating an upward trend. The positive value of the Histogram (0.0081) further reinforces the bullish trend.
Trading Volume
Volume is on an upward trend, with a total volume of 1.777 million. The increase in volume supports the upward movement, as it indicates growing investor interest in buying the stock.
Fibonacci Levels
The Fibonacci levels confirm support and resistance points:
0.618 level at 1.4680 serves as support.
Level 1 at 1.4960 also acts as a significant support level.
Support and Resistance Levels
R1 (Resistance 1): 1.5495, which has been exceeded, with the current stock price slightly above this level.
R2 (Resistance 2): 1.5795, which could act as a point of slowing the upward trend.
S1 (Support 1): 1.4275, providing fundamental support in case of a correction.

Potential Setbacks for METLEN LSE Listing and Investor SentimentI am revising my estimate for the performance of METLEN's stock, as information suggests a potential delay in its listing on the LSE . Although the company's nine-month results are particularly positive, this uncertainty may impact future returns.
METLEN's turnover increased by 3%, reaching €4,203 million, while earnings before interest, taxes, depreciation, and amortization (EBITDA) grew by 6% to €763 million. Net profits rose by 4% to €482 million, with earnings per share amounting to €3.49. Despite investments, the net debt ratio remained stable at 2.05x EBITDA.
Regarding the rumors of Mr. Mytilineos's potential involvement with Hellenic Petroleum (ELPE), I refer you to the Prime Minister's statement: "It is not patriotic to import natural gas and oil from abroad when we can exploit domestic energy sources."
Finally, it is now certain that the government will impose a windfall tax on the excess profits of energy companies, a development expected to negatively affect METLEN's stock performance. While this decision aims to boost public revenues, it creates uncertainty for foreign institutional investors, who may reconsider their positions in the Greek energy market due to exposure to unpredictable tax burdens. This could make attracting substantial investment capital in the energy sector more challenging.
TARGET PRICE: 28.26

Technical Analysis Confirms Titan’s Bullish TrendTitan continues to attract the interest of both investors and the broader market, showcasing an impressive performance on stock exchanges and reporting strong financial results for the first nine months of 2024. With its stock price closing at €39.80, marking a 2.71% increase, the company confirms its robust momentum.
Technical Analysis: Steady Upward Momentum
The technical outlook of Titan’s stock highlights a solidifying upward trend. Exponential Moving Averages (EMAs) across various timeframes (20, 50, 100, and 200 days) support the positive perspective. The current stock price is notably above these averages (EMA 20: €36.44, EMA 50: €34.68, EMA 100: €33.15, EMA 200: €30.41), indicating strong buying activity.
The MACD indicator (12, 26, 9) reinforces this momentum, with a positive divergence between the MACD Line (1.582) and the Signal Line (1.151) and a Histogram value of 0.4312. Pivot Points also indicate the stock approaching the first resistance level (R1: €41.25), with strong potential to breach higher levels (R2: €43.80) if the upward momentum persists.
Key Moving Averages (EMAs)
The EMA indicators signal a clear upward trend:
EMA 20: €36.44
EMA 50: €34.68
EMA 100: €33.15
EMA 200: €30.41
The stock price remains substantially above all these averages, underscoring the strength of its long-term bullish trajectory.
MACD (12, 26, 9)
The MACD indicator confirms the upward dynamics:
MACD Line: 1.582
Signal Line: 1.151
Histogram: 0.4312
This positive divergence suggests sustained buyer interest.
Pivot Points and Key Levels
Pivot Point calculations outline support and resistance levels as follows:
R1: €41.25
R2: €43.80
S1: €34.25
S2: €29.80
The proximity of the price to the first resistance level (R1) signals a potential breakout towards higher levels if the upward momentum continues.
Titan Cement’s technical outlook reveals strong upward momentum, supported by moving averages and MACD. The stock’s position relative to Pivot Points suggests increased demand, potentially targeting the €41.25 level.
Strong 9-Month Financial Results
Titan Group reported positive results for the first nine months of 2024, with all geographic sectors contributing to growth. Sales increased by 4.9% to €1.985 billion, while EBITDA rose by 14.6%, reaching €455 million. Improved selling prices, enhanced operational efficiency, and reduced fuel costs boosted profit margins.
Notably, net profits rose by 20% to €238 million, while earnings per share stood at €3.19. S&P’s credit rating upgrade to “BB+” and the reduction of the net debt-to-EBITDA ratio to 1.1x underscore the company’s financial stability.
Strategic Initiatives and Growth
The Group continues to invest in strategic initiatives with a focus on sustainable growth. The acquisition of quarries and concrete plants enhances production capacity. Simultaneously, the advancement of the carbon capture project IFESTOS in Greece highlights the Group’s commitment to environmental sustainability.
The planned listing of Titan America’s operations on the New York Stock Exchange, expected in Q1 2025, is set to further boost the company’s expansion strategy in the U.S.
Outlook: Robust Performance Amid Challenges
Despite global economic challenges, including inflationary pressures and geopolitical uncertainties, Titan Group remains focused on growth. Demand for cement is expected to remain strong, especially in the U.S. and Europe, driven by public infrastructure projects and private investments.
In Greece, the economy shows resilience, with private sector investments and EU funds fueling growth. Meanwhile, Balkan countries and Egypt display mixed results, with long-term prospects depending on local economic stability.
Titan’s stock appears attractive for investors seeking stable returns in a high-uncertainty environment. With strong technical and fundamental indicators, a potential breakout above €41.25 could pave the way for further gains. The anticipated Wall Street listing and commitment to sustainable development enhance the stock’s long-term value.
Titan is poised to continue its growth trajectory, supported by strong performance, green development strategies, and international opportunities. With current dynamics, 2024 is shaping up to be a milestone year for the Group in both sales and profitability.

Eurobank Holdings: Technically Weak with Pressure on Stock PriceEurobank Holdings' stock presents a negative technical picture as it hovers near recent lows, showing signs of weakening. The stock price stands at €2.496, recording a marginal decline (-0.28%), while technical data indicates limited chances of recovery.
Technical Analysis Overview
Moving Averages (EMA 20/50/100/200) suggest a stabilizing trend with downward prospects.
EMA 20 is at €2.492, EMA 50 at €2.500, and EMA 100 at €2.500, forming a strong resistance level that prevents upward movement.
EMA 200 at €2.491 is being heavily tested as a support level.
Technical Indicators:
MACD is negative (-0.0058), confirming weak stock momentum.
RSI at 47.47 indicates neutrality, with a lack of strength to surpass the critical 50-level.
Fibonacci Levels & Resistance-Support Points:
The stock fails to hold above the 0.236 Fibonacci level (€2.496), with the next support at €2.470.
The Pivot Point resistance (€2.512) has been tested but not successfully surpassed.
Volume Analysis:
Trading volume stands at 14.12 million shares, with increased selling pressure on downward moves, reflecting investor caution.
If selling pressure persists, a potential drop to S1 (€2.452) cannot be ruled out.
Key Technical Weaknesses
Price Weakness & Lack of Recovery Potential:
The stock price is currently at €2.492, down -0.20%.
Despite previous recovery attempts, it has failed to sustain higher levels and now moves near its daily lows.
Moving Averages Indicate Downward Bias:
EMA 20 (€2.492) closely aligns with the current price, signaling weak short-term bullish momentum.
EMA 50 and EMA 100 (€2.500) act as resistance, indicating potential failure to move higher.
EMA 200 (€2.491) provides temporary support, but the price seems likely to break below it.
MACD Shows Negative Momentum:
MACD at -0.0058, below its signal (-0.0082), suggests continued downward pressure.
The positive histogram is minimal (0.0024), reflecting weak buying interest.
RSI Indicates Weak Upward Momentum:
RSI at 47.47, below the neutral 50-level, shows sellers still dominate.
The RSI-based MA (39.14) suggests the stock was recently in oversold territory but lacks strong upside movement.
Fibonacci & Key Support-Resistance Levels:
The stock failed to maintain the 0.236 Fibonacci level (€2.496), showing an inability to recover.
Key support at €2.470, with a possible decline to lower levels if selling pressure persists.
Pivot Point resistance at €2.512 remains challenging to break.
Volume Confirms Selling Pressure:
Trading volume of 14.12M suggests increased selling on downward movements, indicating that sellers are in control.
Bearish Technical Outlook
Eurobank Holdings' technical outlook remains weak, with the price moving below significant resistance levels and indicators suggesting limited upside potential. The stock's inability to break above €2.500 and persistent pressure below moving averages signal a potential continuation of the downward trend, especially if it breaks below €2.470.

OPAP: A Safe Bet in Uncertain MarketsOPAP: A Safe Bet in Uncertain Markets - OPAP Delivers Stability, Dividends, and Buybacks
By Konstantinos Gougakis – April 8, 2025, 09:47
When international markets swing to the rhythm of uncertainty, geopolitical instability, and interest rates going up and down like an elevator, investors stop looking for the next unicorn. They look for stocks that offer stability, transparency, dividends, and solid prospects. They look for “corner store” stocks—established, reliable players. And one of the most prominent examples on the Greek market is, without a doubt, OPAP.
OPAP has consistently shown it can perform even in times of crisis. It has strong liquidity, solid operating performance, investments that pay off, a digital transformation well underway, and—most importantly—a strategy that doesn’t shift with the wind. Now, it’s adding another key strength to its arsenal: a new two-year share buyback program.
The program covers up to 5% of its share capital, with a proposed buyback range between €0.30 and €25 per share. That gives OPAP a flexible tool it can activate only when the Board of Directors sees it as the best available value move. This isn’t for show—it’s a deliberate, targeted action to benefit shareholders.
To put it simply: when a company buys back its own shares, fewer shares remain in the market. So, for those holding on, the value of each share goes up. It’s a clear sign of confidence in the business and a “thank you” to long-term investors. In uncertain times, moves like this matter.
And OPAP isn’t stopping there. Its 2024 financials exceeded expectations:
Net operating profits of €828 million
Profit margin of 36%
11.5% GGR growth in Q4
Citi called the results “outstanding,” while J.P. Morgan and AXIA Ventures raised their price targets and issued new buy recommendations.
OPAP is also making steady digital progress. Its online platform accounts for 31% of GGR, and the Opap Store app saw average spend per visit grow from €27 to €35 in a year. Joker is hitting record numbers, Eurojackpot made history with over 1 million players, and scratch card revenue now makes up 12.2% of the lottery portfolio.
The company is also refinancing €390 million in loans, securing stability through 2032. With €490 million in cash reserves by the end of 2024, OPAP is well-positioned to invest and continue supporting both dividends and share buybacks.
The new dividend of €0.80 per share (4.7% yield) will be paid in May, while a €150 million buyback has already been completed, aimed at canceling shares. The new buyback is another part of OPAP’s value-return strategy—not flashy, just effective.
And the market is responding: three top international firms have upgraded their forecasts, calling OPAP attractively priced with strong upside potential. With an EV/EBITDA ratio of 7.1x for 2026, OPAP is seen as a solid, low-risk investment with dependable returns.
Bottom line: OPAP doesn’t make promises—it delivers. In stormy seas, some look for lighthouses. Like it or not, OPAP has become one of them.

Bullish Momentum with Overbought SignΤechnical Analysis Report: Bullish Momentum with Overbought Signals
JUMBO: Shareholder Update on Q1 2025 Sales Performance
The JUMBO Group, staying true to its commitment to investors and consumers, is releasing today the latest figures regarding March sales and overall performance for the first quarter of 2025.
The recent global trade turbulence, sparked by a new wave of tariff conflicts, is reshaping international commerce, creating an unpredictable environment and heightening mid-term uncertainty.
Sales Overview
JUMBO Group's sales for March 2025 decreased by approximately -2% compared to the same month last year. This decline is largely attributed to seasonality in Greece and Cyprus, as Carnival was celebrated on March 2 this year, versus March 17 in 2024.
In contrast, total Q1 2025 sales for the Group increased by approximately +8% year-on-year.
Additionally, sales during the first 15 days of April suggest a rebound in growth pace, following the temporary disruption in March caused by earlier seasonal demand for Carnival-related products.
Key Context
The Group highlights to its shareholders that the current volatility in global trade makes it nearly impossible to reliably plan for costs and inventory—especially for businesses with significant import/export operations.
One of the few short-term positives is the favorable exchange rate trends and the notable drop in global oil prices.
More detailed information—and potentially a first management outlook on the Group’s 2025 financials—will be shared in the annual financial results for FY 2024, scheduled for release on April 28, 2025.
Sales by Country
Greece
In March 2025, net sales of the parent company (excluding intercompany transactions) fell by about -7% year-on-year.
For Q1 2025 overall, net sales rose approximately +10% compared to the same period last year.
Cyprus
Sales in Cyprus stores declined -8% in March 2025 compared to the previous year.
However, Q1 2025 sales were up around +6% year-on-year.
Bulgaria
Sales in Bulgaria were up by about +4% in March 2025 year-on-year.
Overall Q1 sales in the country increased by approximately +2%.
Romania
Sales from both physical stores and the e-shop rose by roughly +12% in March 2025.
Q1 sales in Romania were up by about +6% compared to the same period last year.
Store Network
As of March 31, 2025, the JUMBO Group operated 89 stores:
53 in Greece
6 in Cyprus
10 in Bulgaria
20 in Romania
The Group also operates e-shops in Greece, Cyprus, and Romania.
Through partnerships, JUMBO-branded stores are present in 7 additional countries—Albania, Kosovo, Serbia, North Macedonia, Bosnia, Montenegro, and Israel—with a total of 40 partner-operated stores. Notably, the Group opened its third large-format JUMBO store in Israel in early April.
Technical Analysis Report
As of the latest trading session, the stock is showing strong bullish momentum, with multiple technical indicators supporting the continuation of the uptrend.
🔹 Price Action
The stock is currently trading at €26.08, having formed a strong recovery from the recent low of €23.06. The price has now surpassed previous resistance levels, nearing the recent high at €25.86, which may act as a short-term resistance.
🔹 Fibonacci Retracement Levels
A Fibonacci retracement applied from the low of €23.06 to the high of €25.86 highlights key support zones:
23.6% level: €25.20
38.2% level: €24.80
50.0% level: €24.46
61.8% level: €24.13
78.6% level: €23.66
These levels serve as potential support in case of a pullback.
🔹 Exponential Moving Averages (EMA)
The stock is trading above all major EMAs, which is a clear bullish signal:
EMA 20: €25.65
EMA 50: €25.25
EMA 100: €25.10
EMA 200: €25.35
This crossover pattern confirms strong upward momentum and a likely trend continuation.
🔹 MACD Indicator
MACD Line: 0.2102
Signal Line: 0.2064
Histogram: 0.0039
The MACD is slightly above the signal line, indicating bullish momentum, though the small histogram suggests this strength is moderate.
🔹 Relative Strength Index (RSI)
Current RSI: 72.12
RSI Moving Average: 64.38
The RSI is currently above 70, placing the stock in overbought territory. This could indicate a potential short-term consolidation or correction, though not necessarily a trend reversal.
The technical indicators collectively suggest a bullish outlook. However, with the RSI entering overbought levels, traders should be cautious of a possible pullback toward support zones at €25.20 or €24.80. A breakout above €25.86 could signal further upside potential.

Jefferies: Maintains "Buy" Rating with a €6.25 Target PriceJefferies: Piraeus' Acquisition of National Insurance Boosts Profitability and Capital Position – Maintains "Buy" Rating with a €6.25 Target Price
The acquisition of 90% of National Insurance by Piraeus Bank for €540 million is a highly strategic move that, according to Jefferies' analysis, will significantly enhance the bank's profitability and overall financial position.
A Deal That Strengthens Piraeus – “Buy” Rating Maintained
Jefferies estimates that the National Insurance acquisition diversifies Piraeus' revenue streams and strengthens its fee income sector, bringing it closer to leading European banking institutions.
The investment firm maintains its “buy” rating for Piraeus Bank, setting a €6.25 price target, confirming its confidence in the bank’s prospects following this strategic move.
Profitability & Return on Equity Boost
This transaction is expected to increase earnings per share (EPS) by approximately 5%, while return on tangible book value (RoaTBV) is projected to rise by 100 basis points (bp). At the same time, Piraeus continues to target a cost-to-core-income ratio of around 35% for the 2025-2027 period, maintaining strong operational efficiency.
Positive Capital Impact – Danish Compromise Implementation
The acquisition will impact Piraeus’ total capital ratio by 150 basis points, reducing it from 20% to over 18.5% in 2025. However, the bank plans to apply the Danish Compromise, which, if implemented, would reduce the impact by 50 basis points, keeping the net effect at 100 basis points.
Importantly, the CET1 ratio is expected to remain above 13% throughout the 2025-2027 business plan, while the dividend distribution policy at 50% of profits remains unchanged.
National Insurance: A Leading Player in the Greek Market
National Insurance is the top insurance company in Greece, with 15.8% growth in gross written premiums (GWP) in 2024, surpassing the market average of 8.7%. The company is expected to maintain a 14.6% market share in 2024, with 17% in life insurance and 11% in general insurance.
With total assets of €4 billion and equity of €400 million, National Insurance reported normalized net earnings of €100 million in 2023. Its extensive network of corporate and affiliated insurance agencies generates a significant portion of its revenue.
Strong Growth in the Bancassurance Market
Piraeus Bank expects the Greek insurance market to continue expanding, with gross written premiums rising to €7 billion from €5.5 billion by the end of 2024.
In Bancassurance, a key strategic sector for Piraeus, the market size is projected to grow from €1.4 billion to €2 billion, highlighting the increasing significance of bank-led insurance services in Greece.

End of the Sharp Decline? A Signal for a Eurobank Rebound
The Eurobank Holdings stock appears to have reached critical support levels, suggesting that the sharp decline of recent sessions may be nearing its end. With the price approaching the EMA 100 & 200 (2.394 and 2.288, respectively), there is an increased likelihood of a technical rebound as selling pressure may be subsiding at these levels.
The RSI (40.21) indicates that the stock is close to oversold territory, which has historically led to upward movements. Meanwhile, the MACD, although still in negative territory, shows signs of stabilization, suggesting that the downward momentum may be weakening.
If the stock manages to hold above the 2.394 level, an immediate rebound toward resistance at 2.459 – 2.483 is the most probable scenario. However, if these levels are broken downward, there is a risk of testing the 2.288 support zone.
The next trading session will be crucial, as a strong buying reaction could signal the end of the correction and put the stock back on an upward trajectory.

Eurobank: Risks from Interest Rate DependenceEurobank: Risks from Interest Rate Dependence – Losing Ground to Competitors – (Morgan Stanley Analysis)
Eurobank, although still one of the strongest Greek banks, is facing challenges that could impact its growth trajectory and attractiveness to investors. According to the latest Morgan Stanley report, the bank has been downgraded from Overweight to Equal-weight, reflecting concerns about its prospects compared to its competitors in the Greek banking sector.
Downgrade and Limited Upside Potential
Eurobank, which was previously considered one of the most robust Greek banks, has lost its privileged position as analysts have downgraded its stock. The new price target set by Morgan Stanley is €3.18, slightly up from €2.77, but with a lower profit potential compared to other Greek banks such as Piraeus and Alpha Bank, which maintain higher upside potential. This development indicates that, despite its positive financial results, Eurobank does not offer the same investment appeal as its competitors.
Lower Return on Equity
One of the key issues affecting Eurobank’s investment position is its performance relative to its competitors. Its Return on Tangible Equity (ROTE) is estimated at 15.4% for 2025 and 14.8% for 2026, slightly lower than National Bank of Greece (15.1%) and Piraeus Bank (13.7%). While these numbers are strong in absolute terms, they highlight that Eurobank does not have the same profit growth potential as other Greek banks.
Limited Loan Growth and Lower Net Interest Income
Eurobank is experiencing moderate loan growth, with an estimated increase of 4.9% in 2025 and 2.8% in 2026, compared to 7.5%-8% for Piraeus Bank. This means that Eurobank may not benefit as much from Greece’s economic recovery and rising investment activity in the country. Additionally, its Net Interest Income (NII) is expected to reach €2.5 billion in 2025, marking only a small increase, which limits the bank’s ability to achieve higher profitability.
Interest Rate Risks and Capital Reserves
Another concern for Eurobank is its sensitivity to interest rate cuts. The Greek banking market is highly dependent on ECB interest rates, and a potential reduction in these rates could negatively impact the bank’s interest income. Furthermore, although its capital position is adequate, it is not as strong as its competitors. Its CET1 ratio is expected to be 16.8% in 2026, lower than National Bank of Greece (17.8%).
Although Eurobank remains one of the top Greek banks, it faces significant challenges that limit its growth potential. The downgrade of its stock, lower growth dynamics, and sensitivity to interest rate changes make it a less attractive investment choice compared to Piraeus and Alpha Bank. If the bank fails to achieve higher loan growth and improve its profitability, it may lose ground to its competitors, limiting its stock’s upside potential.

intracom 4hChart Analysis - Intracom Holdings (CR)
The chart illustrates the following:
Double Bottom Formation: A clear double bottom pattern has been formed, with the price breaking above the neckline around €3.00. This breakout signals potential further upside.
Uptrend Confirmation: After breaking the neckline, the price has continued upward, reaching the resistance zone at €3.12. This movement aligns with the typical progression of a double bottom pattern.
Support and Resistance:
Support: The neckline area around €3.00 now acts as a strong support level.
Resistance: The price faces short-term resistance at €3.12. A breakout above this level could trigger additional upside momentum.
Outlook: As long as the €3.00 support holds and the €3.12 resistance is broken, the next target is projected around €3.25, with a potential final target at €3.50.
Technical Indicators:
The breakout is supported by positive momentum.
Trendlines indicate a continuation of the upward trend.

Titan Cement: Impressive its progress in 2024Titan Cement (TITC) Group, the Titan of the Athens Stock Exchange, which was the first stock I bought as an investor in 1987, ended 2024 with a shower of new historical highs in its share value.
The group posted record sales in the nine-month period at 1.984 billion euros, up by +4.9% compared to the corresponding period last year. At the same time, it posted a strong increase of +14.6% in EBITDA profits, closing at 454.5 million euros, from 396.7 million euros in the nine-month period last year, while it also had a significant increase of +20.3%, to 237.8 million euros, from 197.6 million euros, in net profitability.
In 2025, we will also have the listing of Titan America on the New York Stock Exchange, thus giving significant goodwill to the group, while the raising of several hundred million dollars will further lower the already “wonderful” net debt / EBITDA ratio, which at the end of last September was at 1.10x.
From a diagrammatic point of view, the stock is moving within the strongly upward “S” channel governed by the two pivots of 2019. Here it is clearly visible that the stock has now taken an upward slope towards 44 euros, with a possible development of breaking the four-year channel with a move towards 48 to 50 euros.

GEK Terna: Profitability will be beyond expectationsGEK Terna (GEKTERNA), the national champion in the infrastructure and concessions sector, will appear even stronger in 2025, with Attiki Odos and Egnatia Odos starting to fill its coffers.
Of great interest is the analysis by Eurobank Equities, which predicts the group's revenues to increase from 2.96 billion euros in 2024 to 3.3 billion euros in 2025 and 3.6 billion euros in 2026, with its profitability, however, "breaking them". Specifically, EBITDA profits are expected to increase by +38%, from 452.4 million euros in 2024 to 623.8 million euros (!) in 2025 and to 692.5 million euros in 2026. euros in 2026.
The concessions sector is expected to be the spearhead of the group for the coming years, an element that would easily lead the management to decide to list it on the Stock Exchange. A sector that is expected to bring operating profits of more than 480 to 500 million euros (!).
In the long-term diagrammatic analysis, we have a strong upward channel “D”, which has governed the share price since January 2016. An 8-year formation that pushes the share higher and higher, breaking through the gates of 7.56 euros, 10.18 euros, 14.18 euros and is now approaching 20.25 euros, which will lead to 24.70 euros.

Cenergy Holdings:The incredible growth story extends beyond 2030In the case of Cenergy Holdings (CENER), words are unnecessary.
The growth story of this group is incredible and extends beyond 2030. The comparison of this year's nine months with last year is characteristic, with the percentage figures having escaped, such as the +44% in EBITDA from 137 million euros to 196.8 million euros and the more than doubling in pre-tax profits of 123 million euros from 60.1 million euros and after-tax profits of 100.26 million euros from 47.16 million euros, reminiscent more of an IT company than a giant industrial group.
So in this group that is going to reach 400 million euros in operating profits in the next two years, before even putting the new Hellenic Cables factory in the US into full operation, the long-term chart of the stock shows a strong upward trend.
The stock, taking prices within the “W” channel, has broken resistances such as those at 3.465 euros, 7.20 euros and around 10.18 euros, in order to continue towards 12.80 euros. The extension of this pattern gives prices even above 14 euros.
