Ping An Group (2318) is on the long riseHere is my Elliott Waves analysis for 2318 on HKEX. I did it for all history of the group and believe that we are at the start of wave 3 of very very big 3 now, which means it is going to be multi-year rise, of course, if the count is correct.
After making a long correction, which I labeled as W-X-

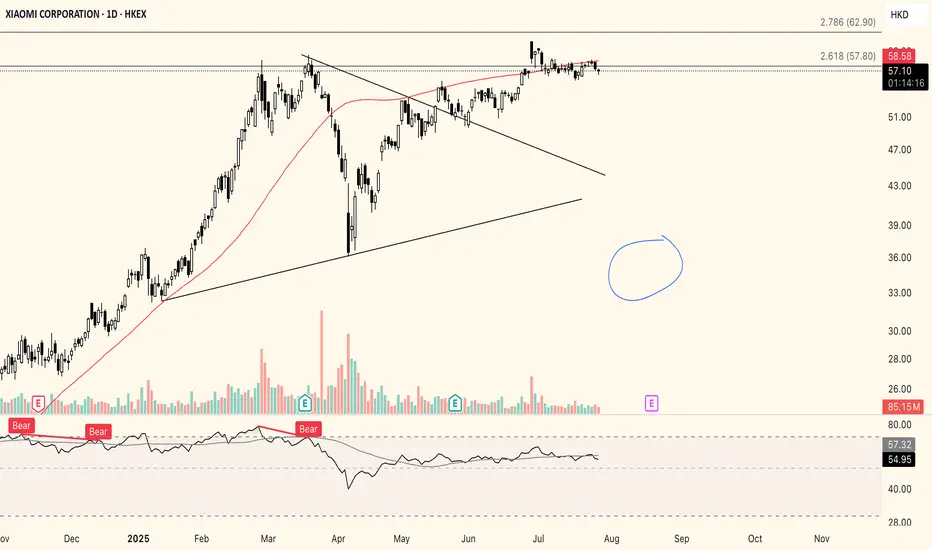
Xiaomi is going to get a fresh haircutAs you can tell by looking at the chart, there seems to be a distribution at play here. After hitting a HTF 2.618 extension, there was quite a steep retracement that resulted in what looked like a bull flag. With recent sweep of that same high at the 2.618 extension, it now looks like Xiaomi will br
Xiaomi probably “bottomed” as China most major stocks. 8/Nov/22Xiaomi’s share price probably found its long term base with double bottom pattern at support zone.

Limited downside risk for CRB HoldingsI will be nibbling this stock this week as I believe the bottom is here and while I may not buy at the exact bottom, I believe the premium segment of CRB Holdings will continue to grow strong.
The upside potential is high.
Please DYODD

You must be ready for the breakNothing is certain but it consolidates for quite a while the elastic is well stretched

Pop Mart Rockets 600%, Riding Labubu Hype and Overseas SalesPop Mart International Group Ltd has shown remarkable growth, driven by the popularity of its Labubu collectibles and strategic IP collaborations.
The stock has surged nearly 600% over the past year, supported by strong overseas revenue growth (183% YoY) and celebrity endorsements. However, regul

BYD–Smart Money Push Back Zone | Impulsive Bullish Move Coming?HKEX:1211 Description / Idea:
So, BYD will reach the purple "Push Back" zone this week or at the latest next week, where many long traders and probably also the smart money will come back into the market.
📌 Entry: between 110 and 115 HKD
📌 Stop Loss: below April low (~101 HKD)
📌 Take Profit: I wi

BYD: Heading for the Low!BYD remains on a downward trajectory, with the current leg expected to carve out the low of magenta wave while staying above key support at HK$111. Under our primary scenario, this level should trigger a strong upward reversal, which should set the stage for the completion of the broader green wav

Tencent Holdings – Potential Wave Count and ForecastAs current price action unfolds, a Wave 5 (gray) forming as an ending diagonal appears to be the most likely scenario. However, the micro count remains open to interpretation and may differ slightly. Continued observation should eventually provide clarity and confirmation at the lower degrees.This e

2400 - 3 months HEAD & SHOULDERS══════════════════════════════
Since 2014, my markets approach is to spot
trading opportunities based solely on the
development of
CLASSICAL CHART PATTERNS
🤝Let’s learn and grow together 🤝
══════════════════════════════
Hello Traders ✌
After a careful consideration I came to the conclusion that:
-

See all popular ideas
Community trends
Stock collections
All stocksTop gainersBiggest losersLarge-capSmall-capLargest employersHigh-dividendHighest net incomeHighest cashHighest profit per employeeHighest revenue per employeeMost activeUnusual volumeMost volatileHigh betaBest performingHighest revenueMost expensivePenny stocksOverboughtOversoldAll-time highAll-time low52-week high52-week lowSee all
Tomorrow
2185SHANGHAI BIO-HEART BIOLOGICAL TECHN
Actual
—
Estimate
—
Tomorrow
8083YOUZAN TECHNOLOGY LTD
Actual
—
Estimate
—
Tomorrow
268KINGDEE INTL SOFTWARE GROUP
Actual
—
Estimate
−0.01
HKD
Tomorrow
1875BIODLINK INTERNATIONAL CO LTD
Actual
—
Estimate
—
Tomorrow
666REPT BATTERO ENERGY CO LTD
Actual
—
Estimate
—
Tomorrow
8239CAPITAL FINANCE HOLDINGS LTD
Actual
—
Estimate
—
Tomorrow
880SJM HOLDINGS LIMITED
Actual
—
Estimate
—
Tomorrow
1415COWELL E HOLDINGS INC
Actual
—
Estimate
0.59
HKD
See more events
Sector 10 matches | Today | 1 week | 1 month | 6 months | Year to date | 1 year | 5 years | 10 years |
|---|---|---|---|---|---|---|---|---|
| Finance | ||||||||
| Technology Services | ||||||||
| Retail Trade | ||||||||
| Energy Minerals | ||||||||
| Communications | ||||||||
| Producer Manufacturing | ||||||||
| Electronic Technology | ||||||||
| Transportation | ||||||||
| Health Technology | ||||||||
| Consumer Durables |