How to use chart to determine your DCA strategyLooking at the monthly chart of Alibaba, it is unfortunately not out of the woods , yet ! Yes, there has been a slew of good news, government support, foreign investors pouring money into the big tech of China, etc. But, little does this move the bullish needle.
The yellow circle shows a bearish pin bar and if it is supposed to work as it says, then I am looking at 95 price level to accumulate. Of course, there are others who prefer to average on a monthly basis, no matter what the price is. Good for you !
For me, I can deploy my funds to other promising assets like Gold , EURUSD ,etc.
It is a challenge for some traders/investors that they have to part off with their money every time they read the news, see a chart or have a discussion with friends, as if they are afraid of missing out (FOMO).
Relax, the market always give you opportunities to enter the market .

BYD–Smart Money Push Back Zone | Impulsive Bullish Move Coming?HKEX:1211 Description / Idea:
So, BYD will reach the purple "Push Back" zone this week or at the latest next week, where many long traders and probably also the smart money will come back into the market.
📌 Entry: between 110 and 115 HKD
📌 Stop Loss: below April low (~101 HKD)
📌 Take Profit: I will share the exact TP later as it depends on timing and the upper trendline, where the higher highs usually get rejected.
🔍 The upward move is forming like the last one in an ABC pattern and will most likely run between the 78.6% and 50% Fibonacci levels. I plan to hold it continuously as long as the structure remains bullish.
⚠️ If the stock falls below the April low, I would rather sell at around 102 HKD.
💡 Since BYD fell below the 78.6% Fibonacci level last night and the split shares were released today, the sell-off could already begin today if the level is retested beforehand.
#BYD #HongKongStocks #SmartMoney #PushBackZone #SwingTrading #Fibonacci #ABCPattern #TradingAnalysis #TechnicalAnalysis #BullishSetup

BYD: Heading for the Low!BYD remains on a downward trajectory, with the current leg expected to carve out the low of magenta wave while staying above key support at HK$111. Under our primary scenario, this level should trigger a strong upward reversal, which should set the stage for the completion of the broader green wave . Only after this upside move do we expect a deeper correction, which should eventually break through support at HK$111 and HK$67.60 to form the low of green wave . That said, we can’t rule out an earlier breakdown. There’s a 33% probability that the high of green wave alt. is already in. In this case, the price could breach support sooner, suggesting the low of wave alt. may form ahead of schedule.
📈 Over 190 precise analyses, clear entry points, and defined Target Zones - that's what we do.

Tencent Holdings – Potential Wave Count and ForecastAs current price action unfolds, a Wave 5 (gray) forming as an ending diagonal appears to be the most likely scenario. However, the micro count remains open to interpretation and may differ slightly. Continued observation should eventually provide clarity and confirmation at the lower degrees.This ending diagonal seems to be approaching completion. A sudden reversal could suggest that Wave 4 (pink) within the diagonal is not yet finished, as the recent downward move resembles a single impulse rather than a full ABC correction. That said, this alternative is less probable given that, by the rules of a contracting ending diagonal, Wave 4 (pink) should be shorter than Wave 2 (pink). Structurally, the current labeling still fits well with Wave 4 (pink) already being completed.For now, the focus should shift to the upside, watching for a developing ABC structure within Wave 5 (pink), which would complete both the ending diagonal and the larger-degree Wave 5 (gray). Upon completion, we should anticipate a significant correction. Based on current wave dynamics, this gray Wave 5 is likely to end in a truncation or produce only a marginal new all-time high.
Disclaimer: This analysis is for informational and educational purposes only and should not be considered financial or investment advice. All trading involves risk, and you should perform your own due diligence before making any trading decisions. The author is not responsible for any losses that may arise from reliance on this content. Always trade at your own risk.

Ping An Group (2318) is on the long riseHere is my Elliott Waves analysis for 2318 on HKEX. I did it for all history of the group and believe that we are at the start of wave 3 of very very big 3 now, which means it is going to be multi-year rise, of course, if the count is correct.
After making a long correction, which I labeled as W-X-Y, the stock started to print a leading expanding diagonal. I detected this pattern in a number of stocks in China as situation started to improve with government support (JD is an example, see my previous idea).
I believe that correction is 99% behind as we gapped up today on decent volumes from the bullish flag upper edge. And this today's move pushed the price above 200 Weekly EMA and closed there.
Bullish cross of 50 to 100 EMAs on weekly is coming right now.
I don't want to wait for EMAs to perfectly line up as now there is enough evidence for we are set to go higher long term.
Full big picture labelling can be found here:

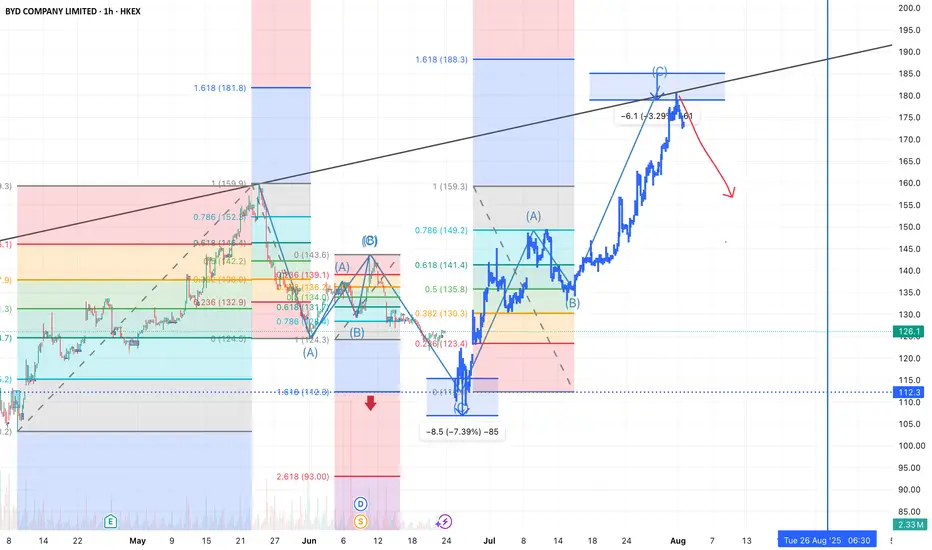
BYD Analysis📈 Summary:
BYD has completed a clear ABC corrective structure followed by a strong impulsive wave, reaching a significant resistance zone. Multiple Fibonacci extensions and a long-term trendline converge around the 185–188 level, indicating a potential local top. The market appears overextended, and a retracement is likely.
📊 Technical Analysis:
The chart shows multiple Elliott Wave patterns, with two corrective ABC structures visible prior to the recent rally.
Price has reached the 1.618 Fibonacci extension (~188) of the previous impulse, aligning with a strong resistance zone and a long-term trendline.
A bearish rejection is starting to form around this zone, suggesting a possible trend reversal.
The red arrow indicates the projected downward move, with potential support around 135–140 and possibly down to 112.3, where the 1.618 extension of the prior correction lies.
Volume shows signs of weakening as the price climbs, often a sign of exhaustion in bullish momentum.
🔍 Key Levels:
Resistance: 185–188 (Fibo extension & trendline confluence)
Support Zones: 149.2 (0.786 retracement), 135.8 (0.5 Fibo), 123.4 (0.236), and 112.3 (1.618 extension)
📆 Timeframe: 1h chart (short- to mid-term outlook)
Tencent Holdings back to 700 price level In Feb 2021, that was the peak of Tencent Holdings at 700+ price level.
Currently, we have cleared the resistance at 483.20 and I expect it to break above the 522 price level within the next few months. Once this level is broken up, it should head towards the 700+ price level.
It won't be a straight line up as it was in 2020/2021 so patience is much needed here. With the Chinese government paying a lot of attention to AI, this tech giant is certain to receive incentives/grants to further its plans in AI, cloud infrastructure ,etc.
Any retracement to me is a good accumulation point.

Speculative stock - 6693 (newly listed IPO) Trade with care30.60 was the jinx where the price level could not surpassed. If you have to trade this stock, please make sure you have SL in place and uses 1-2% of your capital for it, no more.
As usual , please DYODD

Tencent: Searching for Wave A’s LowTencent’s corrective A-B-C structure is struggling to finish wave A. Our primary scenario calls for a drop toward support at HK$364.80, where wave A should bottom. That should open the door for wave B, followed by a deeper leg down in wave C—into the magenta Long Target Zone between HK$325.60 and HK$229.00. This zone should mark the completion of wave (2), setting up a long-term bullish reversal in wave (3), which may eventually target resistance at HK$715. However, if price breaks below HK$188.60, our wave alt. scenario will take over (36% probability), signaling an even deeper low before the next bullish impulse.
📈 Over 190 precise analyses, clear entry points, and defined Target Zones - that's what we do.

2400 - 3 months HEAD & SHOULDERS══════════════════════════════
Since 2014, my markets approach is to spot
trading opportunities based solely on the
development of
CLASSICAL CHART PATTERNS
🤝Let’s learn and grow together 🤝
══════════════════════════════
Hello Traders ✌
After a careful consideration I came to the conclusion that:
- it is crucial to be quick in alerting you with all the opportunities I spot and often I don't post a good pattern because I don't have the opportunity to write down a proper didactical comment;
- since my parameters to identify a Classical Pattern and its scenario are very well defined, many of my comments were and would be redundant;
- the information that I think is important is very simple and can easily be understood just by looking at charts;
For these reasons and hoping to give you a better help, I decided to write comments only when something very specific or interesting shows up, otherwise all the information is shown on the chart.
Thank you all for your support
🔎🔎🔎 ALWAYS REMEMBER
"A pattern IS NOT a Pattern until the breakout is completed. Before that moment it is just a bunch of colorful candlesticks on a chart of your watchlist"
═════════════════════════════
⚠ DISCLAIMER ⚠
Breakout Area, Target, Levels, each line drawn on this chart and any other content represent just The Art Of Charting’s personal opinion and it is posted purely for educational purposes. Therefore it must not be taken as a direct or indirect investing recommendations or advices. Entry Point, Initial Stop Loss and Targets depend on your personal and unique Trading Plan Tactics and Money Management rules, Any action taken upon these information is at your own risk.
═════════════════════════════

Fasten your seatbelts - China Southern Airlines to fly higherChina’s recent decision to grant visa-free entry to citizens of four Gulf Cooperation Council (GCC) countries—Saudi Arabia, Oman, Kuwait, and Bahrain—from June 9, 2025, is expected to significantly boost travel demand between China and the Gulf region.
Key benefits for China Southern Airlines:
> Increased passenger traffic from GCC countries for tourism, business, and cultural exchange.
> Opportunity to expand direct flight routes to major Gulf cities, enhancing its international network.
> Stronger hub positioning for cities like Guangzhou and Urumqi as gateways for Middle East–Asia connectivity.
> Improved load factors and revenue from both inbound and outbound travel, especially during peak seasons.
This policy complements earlier agreements with the UAE and Qatar, which already enjoy 30-day visa-free access, effectively making all GCC nations visa-exempt for short-term visits to China
Basis review of monthly chart, price has potential to retest level of 5.70 which is 46% upside from current level of 3.90. Price needs to breach the overhead resistance of 4 and sustain above it for multiple days for the upside momentum to kick in. However, this view is negated if price breaks below 3.20 level.

Scale out before this POPSWhen the mainstream media was telling you that China was not investable, I was working hard on my TA and buying positions. I consider myself a contrarian investor, this is where the best opportunities present themselves. If you follow my trades here you will know I had called out the start of the new bull run in the Hong Kong exchange, or the dead-cat bounce spending on how you look at it, very early on.
I took the basket approach on a handful of Chinese names. Namely Alibaba, BYD, Tencent, Baidu and Pop Mart.
This worked out very well for me (except Baidu) but nothing better than Pop Mart, unfortunately the smallest position of the lot.
So why a Chinese toy company? If you have children into the latest and hottest toys, I suggest you look into the parent company. This particular company had a beautiful chart as it had broken the end of the downtrend, along with a reclaim of the POC. What followed was a gargantuan 1000% rise. I have taken 50% off the table today as I see this as the final wave of the Wave 5 supercycle. I do think this still has legs and profits will continue to soar for the next quarter or two, but I’m not greedy, this has exceeded my expectations and then some. So I have started to scale out, this is the way.
Not financial advice, do what’s best for you
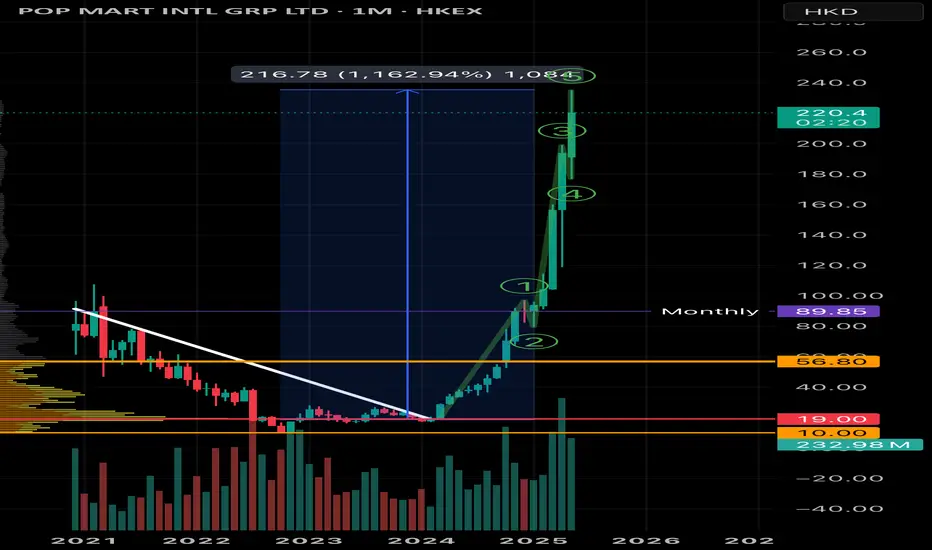
IP goods economy worth US$50 billionSee my first discovery here
Read latest article here
From the 40 dollar range when I first discovered but did not nibble or go LONG (yes , I wanted to kill myself, haha), this stock has gone up 492% !!!! Not in 10 years time but merely 1 year. It beats most of the tech stocks in US as well.
If there is any consolation , here it is . It will be included in the HSI components and so long as I am LONG in HSI, I will still benefit in the rise though not as meteoric on its own.
We are now in the year 2025 and investing theme may also need to be adjusted like the good old Food & beverage , Personal Care, Banks, Financials ,etc. We now need to look at the world of investing in a different lens.
I will make it a point to go out more often to hunt for new ideas, read more extensively and in search of the next multi-bagger.

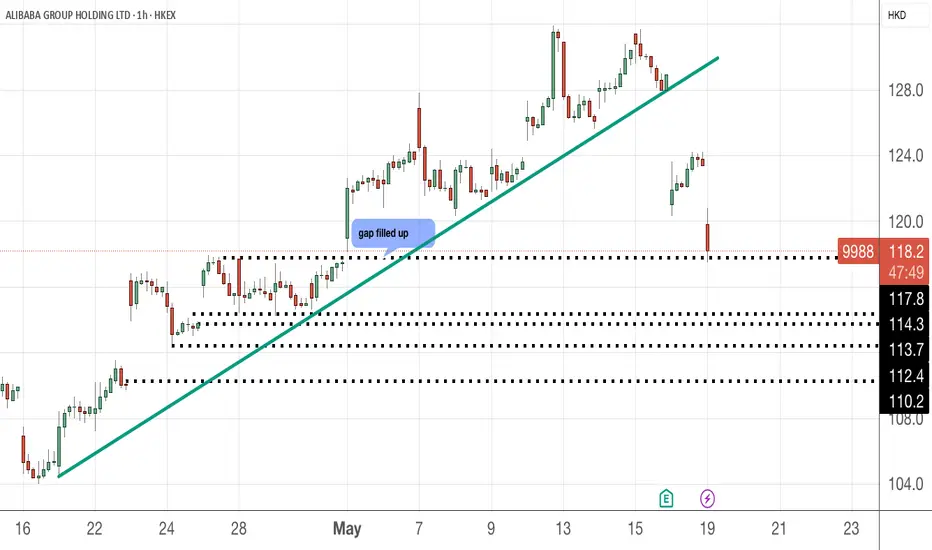
9988 dropped more than 4% .....In the 1H chart, we can see the price action has broken down from the bullish trend line and there are several gaps that it can possibly fill up. The first one at 117.8 is completed. So, if you want to go LONG/accumulate, go in in tranches instead of one lump sum. Yes, you may lose a bit in brokerage fees but the average price you get is much better.
Nibbled some for now
Please DYODD
Double three corrective wave likely endingHKEX:1898 Is looking at a resumption of an uptrend as the double three corrective wave structure is likely to be terminal as both Stochastic Oscillator and 23-period RSI is looking at confirmation of oversold signal. Meanwhile price action shows a complete confirmation of the cup and handle formation.
Major uptrend remain intact and breaking above the over head resistance will further confirm the upside.

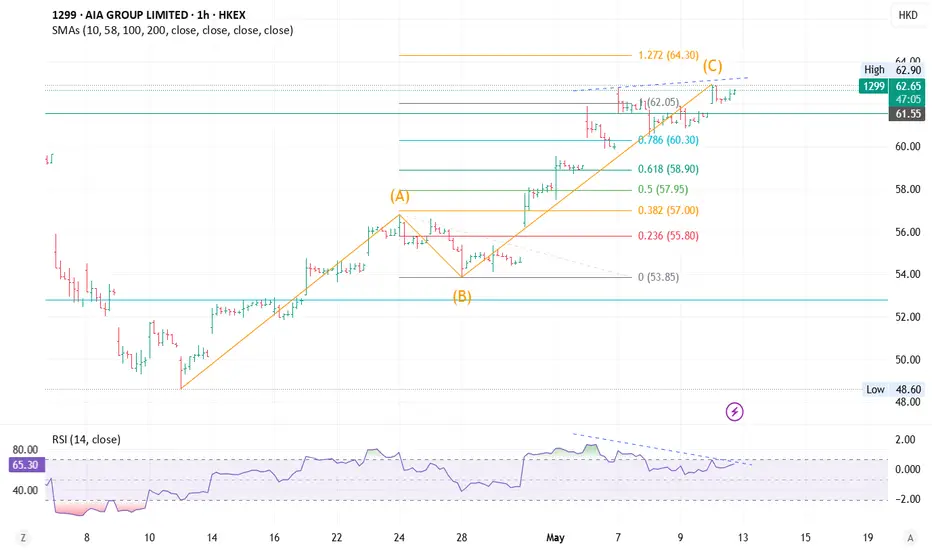
1299 Bearish DivergenceBearish divergence seen on 1 hr graph.
Expect to see 1299 leading drop with HSI in coming few weeks
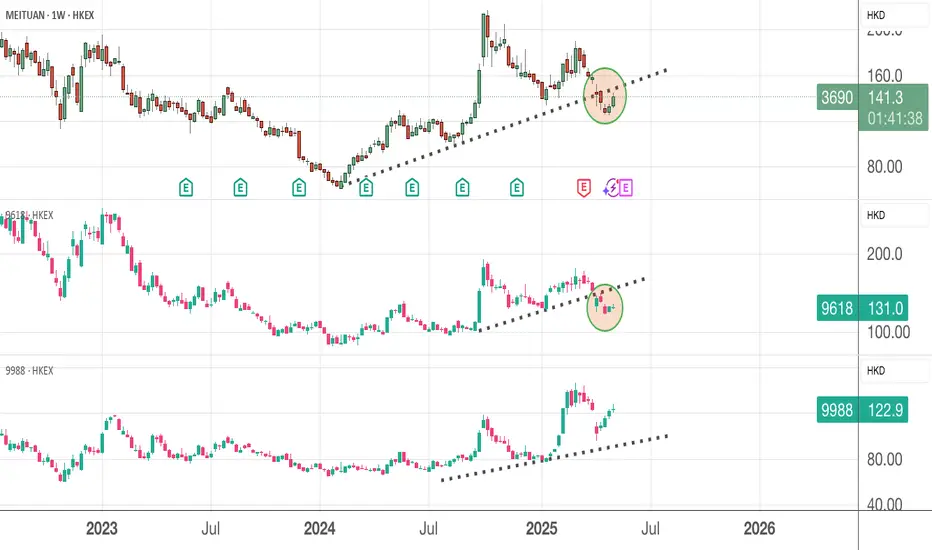
The battle is on for 3 top players in CHINAThe food delivery war is on amongst the three players with JD with vast amount of cash coming in to compete for a slice of the market. What other better ways to steal market share legitimately than to slash your price and entice your competitors's workers over with better benefits ?
You save money and time on training and they can be productive on day 1 where time is of the essence in this game. Meituan should join forces with JD.com and push Alibaba food delivery arm (Taobao and Ele Me) out of the game. Meituan is already the number one player with close to 70% market share and to grow organically - it is tough unless they are willing to offer more benefits to the workers (sadly they are looked upon as transactional costs and easily replaceable in a country like China with excessive people to hire)
Value add ? Nobody needs that when their stomach is growling, just deliver within time and the right order , that is all. That is why time is crucial and many accidents had happened especially during the peak hours (lunch and dinner time) and on rainy days. I have a lot of respects for these drivers, end of the day they are just someone's husband and daddy brining food to their own table by slogging hard under the harsh weather and speeding through the traffic.
I am vested in all 3 companies so will continue to observe the price action and update later.
Bullish Divergence for 9618 in dailyGiven the spot of bullish divergence in RSI,
and that 1-2-3-4-5 is potentially completed,
I would like to change my prediction from a bearish market to a bullish market.
The retracement to $115 will be completed in future months.
I estimate 9618 will be raising as B in this month

Target $115 on 2nd JuneLooking for price ratio A:C = 1:1
Target is 115.
By converging triangle, estimated date is 2nd June

Potential for a bullish market9988 may be going on a bullish 12345 or a big B.
However, since no bullish divergence for RSI right now,
we can forsee 9988 will still be raising in the coming week.


Converging triangle in 9618Converging triangle, potential drop to $118, or even $115 for fibonacci retracement

1810, Seera Holding Group SJSCHello,
Seera Holding Group SJSC.
Cash and Cash Equivalents, End of the Period 2023: 585,643 (Thousands)
Cash and Cash Equivalents, End of the Period 2024: 690,370 (Thousands)
Good Luck
