Citic is gonna fall further - Buy at next support Volume for buy is not back yet. Hence gonna wait out for a buy at lower zones

Tencent offers 50% discount or more this Christmas !Read latest articles here , here and here .
There is a Chinese saying that "Big trees attract the wind" which means that a tech giant like Tencent has certainly has the Central government hawkish eyes on them for a long , long time. The recent slew of measures imposed on them over the last few months seems like a bottomless pit (as one of my followers said and he is getting discouraged ) and depressing.
I totally agreed as the picture was not what many shareholders envisioned barely 10 months ago......
I have written some time ago (please search my posts) on concentration vs diversification strategy in setting up your investment portfolio. Again, this is not a hard and fast rule. There are people who bought only one company , say Coca Cola or Amazon or even BTCUSD and become millionaires and multi-millionaires from it. For me, I like to diversify , buying into the specialty of different companies in their respective industries. Boeing is good in aircraft and maintenance but can't do what this tech company do and neither do the tech company wants to invest the time, money and resources to do what Boeing has done over the years.
Hopefully, out of 10 stocks you pick with solid and good fundamentals, one or two become a multi-bagger that gives you 5-10 folds returns and that to me is excellent news.
Please DYODD and understand your objectives of buying into this company. How long are you prepared to hold ? What are your capital reserves ? Do you have a cut loss strategy ? Are you prepared to average in when it drops 30%, 50% , 65% ? Why yes ? Why not ? Having these answers mentally prepared helps you to steer clear of irrational thoughts and act on impulse buying or merely following calls of others who may have different strategies with you.

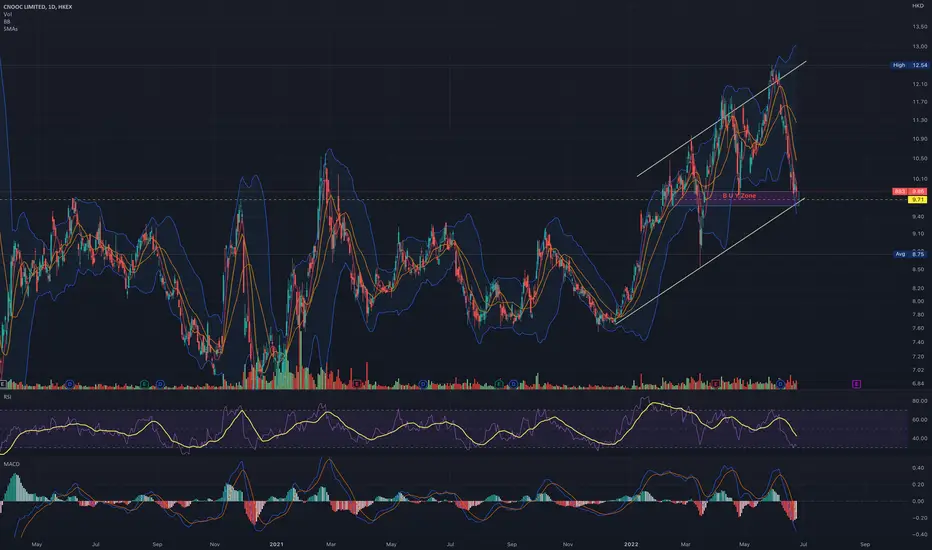
2nd Short closed in interesting area2nd position closed when the price rich an interesting area between the level price 10.30 and 9.70. let's see if the price will remain in this area and accumulate before will broke this 2 level. start a new trend going up or continuing the downtrend.
My vision is still short.

Short closed in interesting area Another position opened and closed in profit, and the price rich a level and an interesting area between the level price of 8.70 and 8.01 let's see if the stock will use this area to accumulate before the broken, continuing the downtrend or will use as a support to start a new up trend.
My vision is still short, let's see.

Protection the profit and high volatilityThe second position opened at 290.96 and closed at 279.02, with the volatility rising I decide a protective approach, in order to protect my profit. But my vision is still Short, let's see what will happens

Short and profitThe Bear Market is continuing for this stock, and it seems don't want to stop let's see how far will go.

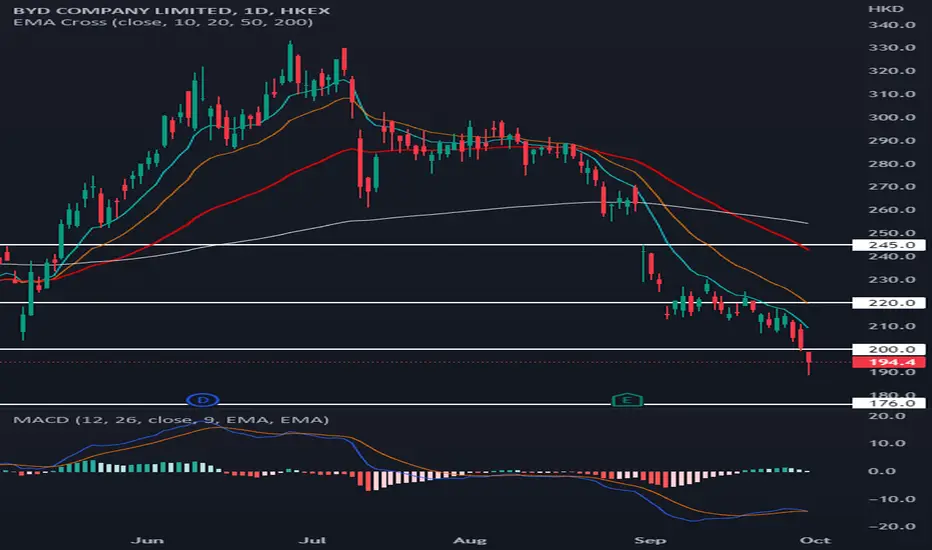
BYDBYD’s (1211) EMA10-EMA20 and MACD suggest prices could continue its downward trajectory. Prices are also below the HKD200 psychological level. Hence BYD could retest either the HKD176 or HKD165 support. However, a daily close above HKD220, which was also the EMA20, could propel prices towards the 31 August 2022’s gap down of HKD245.
Melco Presents a potential 75% reflexive opportunity.The great thing about a China reopening play is that no one is talking about it now. Everyone's mind is on Interest rates. Macau has resumed tour groups and Melco is a buy.
Entry 6.4
Target 9.0
Stop: 5.5 (Based on Fib Retracement)
Cheers,
Kavi

1810 AnalysisPrice played out according to what was analyzed last week. I was expecting the lows at 10.30 and price has taken. Right now, I'm expecting a bullish retracement to the upside, potentially to mitigate the bearish POI at 10.46.

1810 AnalysisPrice is playing out as analyzed last week. I'm expecting price to be playing out according to the Wyckoff accumulation schematic and expect price to head towards the lows at 10.30 to create a spring before price initiate an uptrend.

857 short after bearish hammerOpened below bearish hammer.
Filled next day, strong bullish hammer closed below 10MA, but slightly above both 100 and 200MA.
Risky trade in a hindsight we'll see how market decides soon.

1299 short on dailyMissed take profit by a penny, therefore moved stop right above previous consolidation and put take profit few pennies lower.
Monthly shows a good bearish hammer. Don't see no reason not to go lower.
Would've exit 30% here, but my lot is not divisible.

Bullish bottoming out after bullish candle breaks out of wedgeChina Suntien had a strong bullish reversal cup and handle formation, especially after a strong bullish candle broke out of the falling wedge/handle and the 22-EMA. 3.81 remain the crucial resistance to break.

TencentVery weak. Wait until it stabilizes on the lower time frame. Gap at 305.80 close to being filled. Trading at more than 2 standard deviation over 20-days this ultra short term rebound possible.

TencentVery weak. Wait until it stabilizes on the lower time frame. Note the downside gap at 306.00 which has potential to close. Trading at 2 std deviation over 20-days thus rebound inti underside of EMA's is possible."

BYD.....Correction not yet finished!Hello Traders,
BYD is on path with my forecast. The stock has declined to new lows, and this down-sequence isn't done yet!
On Friday, wave ((3)) has finished @ HK$ 224.60, and wave ((4)) should start.
A target area for this scenario is at or around the HK$ 250 levels.
If Friday's low was not the end of waves((3)), (may a wave 3 of one lower degree has ended), the stock will stay right on his path for lower price in the coming week.
But keep in mind! As steeper the correcting moves, the less the probability for the count is given!
BYD has to charge his battery for a new impulse!
Have a great Sunday.....
Ruebennase
Feel free to ask or comment!
Trading this analysis is at your own risk!

1810 AnalysisNo changes from my last analysis. Price is creating buy-side liquidity and is on a short-term down-trend. Price has already took some sell-side liquidity, but is unable to push higher. I'm expecting the lows at 10.30 to be taken before we see price take the buy-side liquidity.

2018.HKEX_Bearish Breakdown Trade_ShortENTRY: 13.68
SL: 15.16
TP: 11.18
- ADX>25
- Daily RS -ve
- Daily FFI -ve
- Weekly RS -ve
- Weekly FFI +ve
- Moving averages are aligned.
- Stoch RSI near 70 and dipping down.
- Entry based on today breakdown from range and >3% rebound off 10EMA with volume.
- Need to watch out for earning results which is approaching

WATCH $3320Bullish
- Higher lows
- IHS formation
- Double bottoms
- Funds accumulating
- Great fundamentals
- Needs to break above downward trendline & neckline
Entry idea
- For members
Stop loss depending on entry and risk appetite. But always set meaningful stops.
“The gem cannot be polished without friction, nor man perfected without trials.”
Cheers and happy trading!

700 AnalysisPrice has played out as my last analysis. Price is currently mitigating the bearish POI at 321.0. On its way up, it created sell-side liquidity. Right now we should keep a lookout on the lower timeframe for confirmation to see if price wants to continue upwards. From here, the most probably move will be a bearish retracement to take out the sell-side liquidity.

BYD.....Correction within a wave c!Hello Traders,
since my latter analysis, BYD has made no progress.
Instead, it was declining to 260 area, where the bullish count would be negated for the moment.
I have revised the count.
As a result, I count BYD correcting within a waves c of (y) of ((ii))!
Today, waves (3) (Micro degree) could have end!?
If so, the next move will be to the upside, developing as an a-b-c, finishing waves ((4)). After a decline below today's low is in the cards; finishing waves ((5)) of c of (y) of ((ii))!
At the bigger picture, this move, if so to come, will end a large correction, and BYD will start a new impulse within a wave's 3! Targets for this scenario are well above seen levels.
Have a great week....
Ruebennase
Feel free to ask or comment!
Trading this analysis is at your own risk!
The editor is invested!

1810 AnalysisPrice has been playing out as analyzed since 12 July. Volume is increasing on the down move. Right now, I'm still expecting price to take the lows at 10.30 before we can see price starting to initiate an uptrend
