TENCENT - 🧐🧐🧐Tencent holding up fairly well this morning after Friday's USTECH sell off...
Something to note is we do have a little unfilled gap below and we currently testing the short term uptrend.
-- MANAGE YOUR RISK - -
Disclaimer: All ideas are my opinion and should not be taken as financial advice.

TENCENT (0700)Tencent (0700) is currently trading near the green trendline. Its EMA10-EMA20 and MACD golden cross suggesting a possible uptrend. Hence there is a possibility of a retest of the HKD510 resistance with next resistance at HKD550.98. In contrast, a bearish bias and a short selling opportunity might arise if there is a daily close below the red trendline. Subsequently, downside support located at HKD400 and HKD368.

JICPT| Tencent in the late stage of accumulationHello everyone. It's been a while since I published ideas regarding Tencent. After analyzing the global market to identify the sweet spot to park the assets for my client, Tencent again got my attention.
From the daily chart, we can see the key anchored level around HKD412 is well respected after massive sell-off with above the normal volume. In my opinion, Tencent is in the process of accumulation, perhaps, the late stage.
The upper boundary of the sideway channel is HKD515 to HKD528. I'm looking for big size candle with high volume to take over it.
By setting the alert, let's see how it reacts to the boundary this time. The next target after confirmed breakout is HKD644.
What do you think? Give me a like if you're with me.

$NETEASE (9999) Key levels, Analysis & Targets$NETEASE (9999) Key levels, Analysis & Targets
Forecasting stock prices using Fibonacci theory to analyze price levels for "Stop Loss"

CK Asset Holdings Ltd (1113.HK) Ck Asset Holdings upside rally is still holding on after a strong break above the ascending triangle back in 29th December 2021. Despite a potential head and shoulder formation, we believe that prices will find support at 49.45-49.80, which is 2.43% change from the neckline resistance. Hence, we do believe that there could be a bear trap.

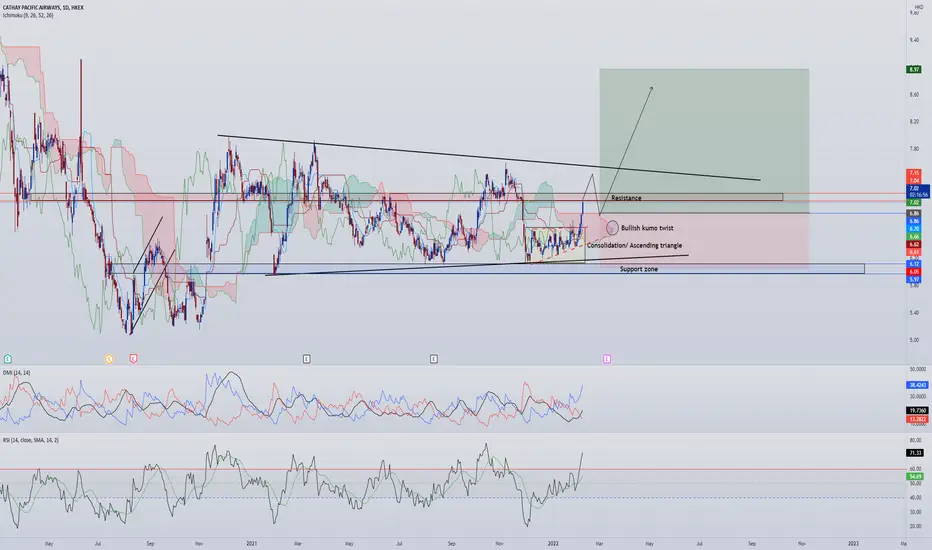
Cathay Pacific Airways (293.HK) - 5 wave terminal completedSymmetrical triangle formation hints a break to the upside after strong bullish momentum is confirmed by the Directional movement index. Furthermore, the breakout of the consolidation/ascending triangle confirms the bullish rally.
Expect some short-term correction upon breaking the immediate resistance zone at 7.04-7.15. Buy limit at 6.86.
CSC Financials (6066.HK)-Ascending triangle signal hope8.01-8.The downside corrective rout since Jan 2021 to July 2021 has come to a halt after prices consolidate from August 2021 to present. We may see an immediate upside break as the formation of the ascending triangle gave a very good hope. Either way, support zone 1 at 8.01-8.18 can be an alternative strong buying.

China Petroleum (386.HK) - Bearish divergence spottedSub-wave analysis suggest that China Petroleum is heading for a wave -4 correction to the nearest support zone at 3.91-3.96.

Ping An (2318.HK) - Buy at minor correction Since the breaking out of the descending triangle on 6th Jan 2022, the up trend is confirmed with the Ichimoku heading for a three bullish crossover. However, some weakness is observed at HK$60.90 immediate resistance thus we can take this opportunity to buy at support. DM+ is seen sloping upwards while DM- is seen sloping down below the Average directional index. As such, we believe overall trend is tilting towards the bullish side.

China Telco Players - benefiting from 5G Technologywww.chinadaily.com.cn
From a high of 88 in March 19, it has fallen to a low of 58 in early Dec this year. It has now break out from the descending channel on 16 Dec 19 and there is more upside to come.
The 5G technology drive will benefits the few big Telco players in China, China Mobile being one of them. This is one of the key areas that the Central Government is paying lots of attention and what US is trying to compete with China now.
www.cnbc.com

Do we still talk about Evergrande? In the last post on Evergrande we highlighted the clear Elliot waves down and another set of five completing.
Now we're gotten a bit of a bounce and that might be the ABC correction part of the move and we might be into a new set of legs down.
Evergrande is ... kinda low. A continued downtrend may be a problem for them.

China Evergrande Group speculative buyGovernment intervention to aid the crisis-hit property sector:
China Evergrande Group named a state firm official to its board.
Two of its peers sold assets to state-owned entities.
The buy volume was increasing lately.
If you want a short term speculative buy, China Evergrande Groupcould be your pick.
Looking forward to read your opinion about it.

JD Health if stay we will start to see potential reversalon technical aspect , price has broken down descending triangle which target around $53. Price will likely to stay sideway along the 45-55 range before confirming a trend reversal.

HKEX Ranging TradePrice is in a range for HKEX between 430 - 540.
If price were to reject above the current support and break above the trend line , we will expect to see a rise to 500 follow by 540.

1083.HKEX_Retracement Trade_LongENTRY: 6.33
SL: 5.80
TP: 7.29
- ADX>20
- RSI>50,RSI<70
- Daily RS +ve
- Daily FFI -ve
- Daily MACD -ve
- Weekly RS +ve
- Weekly FFI +ve
- Weekly MACD +ve
- Hit a high on 4 Jan 2022 and on retracement since then.
- Retraced until near 50% fib level on 18 Jan 2022 and uptrend line with above average volume and doji candle.
- Rebounded today with high volume.

Break above 23.6% will see next level
Price is still well supported above $418, 200days Moving Average and 23.6% Fibo.
Break above 38.2%, we may see $520 next week.

JD LogisticJD group share price has ben affected since Tencent has let go of its JD shares. However, price did not form new low in JD logistic . If price stay above 25.
We will expect it to go to 45 before retracement to form higher lower and with final target at $65

Ping An Bank broken downward trendPrice has long consolidated between $70 - $100. Which dipped to $50 recently. With a breaking of the downward trending, Ping An is most probably reversing from current area with the upward trend line to be the support where we should see price to go above 70 and fall back down shortly to $62.50 before the next wave up for share price to go back into the long consolidated zone.
TP1 : 70
TP2: 95.9
Final Target : 125

151 Want Want to go back in timeA number of Ross Hooks to get you into a trade after the range break. One particularly nasty shake-out bar, but then it becomes a RH. The last RH worked nicely if you had the patience.

CEB Bank (6818)One of the undervalue HK banking counter
If able stay above 2.78 and may breakout into an uptrend
VT Stock indicator is a stock breakout trend indicator for identifying the change of Mid to long term trend direction
(Disclaimer: for demonstrating own planned trade records study only and education purpose, not for recommend to buy or sell. Trade at your own risk)

Bank Of China (3988)VT stock indicator show change of trend direction
VT Stock indicator is a stock breakout trend indicator for identifying the change of Mid to long term trend direction
(Disclaimer: for demonstrating own planned trade records study only and education purpose, not for recommend to buy or sell. Trade at your own risk)

1798 Structure tradePrice coming back into support.
Long entry where buyers last showed up.
Buy 2.96 s/l 2.73
T/P at the ML gives >2.5RR.
Mod-Schiff, looking for a new high gives >5RR

Tencent... is it good to bottom pick now?My Humble Opinion on Tencent
Currently, the price is in the consolidation zone. Note that the "consolidation" process is a neutral term. It does not have a bullish or bearish bias. It just means that there are BOTH buyers and sellers interested within that narrow range. Hence there is a lot of transactions for a long period.
Over a period of time, either the sellers will run out of interest or the buyers will. When this happens, the price will move accordingly. Given that the primary uptrend is still intact, we can safely assume a small bullish bias on this consolidation. This does not mean that price will be 100% supported. It just means that the chances of price going up are slightly higher.
Should the price falls below 400 into the Bear Territory, traders will need to get the hell out. Value Investors might need to relook at the fundamentals before blindly averaging down.
If the price heads up after the consolidation, we will expect some form of selling pressure at 525 to 580. So do not expect a sharp recovery.
If I am looking to trade this, I will not touch Tencent until the price can recover above 600 (Bull Territory)
On the other hand, Value Investors may continue to pick up these stocks during this consolidation phase IF this company is aligned with your investment goals (certainly not aligned with mine)
Personal Verdict: Stay the hell away!
