when to buy tencent?wait for daily divergence to form... pattern to form b4 enter .typical long setup with good R:R awaiting

Tencent OK to buy around HK$400, Worst case HK$330recent crash in China tech provides solid opportunities
I'm OK to long Tencent around HK$400

TENCENT > MA SUPPORT > LONG1) 200 MA Support
2) All MA Trend up
3) STOCH oversold
4) Good financial, increase revenue and earnings past 4 years.

BYD(1211) BUY OR LONG, TARGET $400BYD a Chinese electric car company, confirmed a reasonable " Cup and Handle " pattern
and a target area of $400, with a stop loss of 10%.

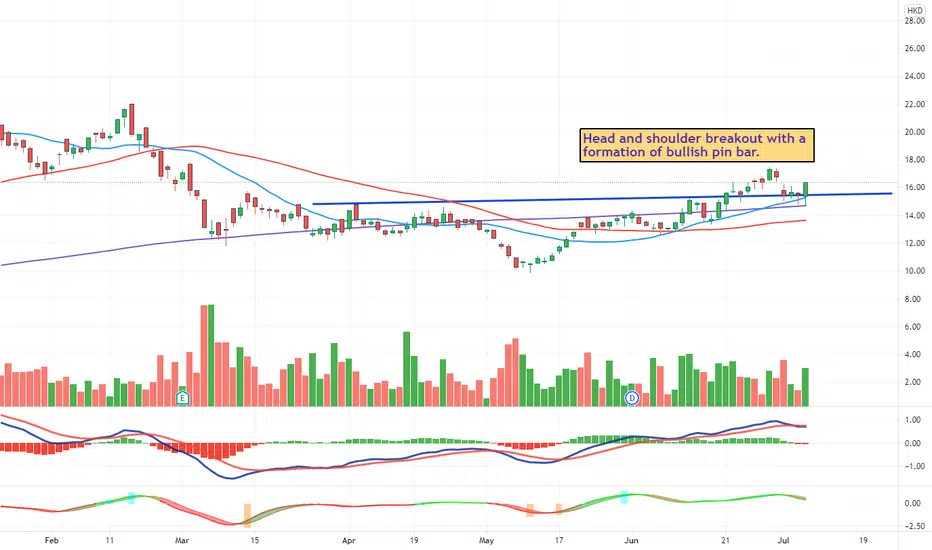
00175.HK consolidation breakoutThe bounce from the recent low is rather fast, expect a slight pullback to form a cup and handle before breaking out to new high.
I took off some positions at 27, hopefully can get it back around 25.

BYD's Biggest Dealer In China Signs Deal For 6,000 AutomobilesBYD is probably my favourite stock at the moment mainly because of its electric vehicles and the good news seems to keep on coming.
Article: finance.yahoo.com


Baba failed to close below the support levelIt appears that we are going to retest strong resistance.

It seems that the pullback is overPullback is over it seems, the long shadow candle suggests that there is buying pressure at the support. Lets see how this turns out

Hong Kong Tech Giant Tencent, is it time to buy? After a crash of 40%+ from the recent high in Feb, is it time to buy Tencent again?
Tencent has not closed below the 40 MA on the monthly chart yet.
The last few times it has fallen close to this moving average, it has provided a great buy opportunity for the short, mid, and long term.
Currently, the MA level to watch is 431.
If we close below this moving average, it could be a strong sign that downside risk has increased again...

TENCENT - Area of interest and possible relief- Tencent has been smashed by the recent developments in the Chinese markets.
- There is no clarity as to how this will play out going forward but looking at the chart we have approached strong support
- The loss of this level could lead to a further decline 360 / 262
-- MANAGE YOUR RISK - -
Disclaimer: All ideas are my opinion and should not be taken as financial advice.

Tencent SelloffGovernment crackdown on China tech has really set in. Now tencent is currently has had a similar low point to 2018 approximately 40%. Investors are stuck at a junction to decide whether the price goes up from here or down. If we take similar sell offs based off previous we see tencent at about 170, a further 60% from here. If we take the fundamental approach we see tencent bounce very soon.
So my game plan, Sold put strike @440 for 30c. If the share price stays below 440 on 30 Aug i am obliged to own at 440. If the stock stays above 440 I am collecting 30 c effectively having my entry lowered to 410 to sell another put

Tencent sell-off a little overdone?With the Chinese crackdown on tech stocks and the latest announcement banning for-profit education, Tencent has seen a significant impact on its latest share price. The latest move has seen price rejected all the way to the Monthly/Weekly S3 @ 490 which is considered very extreme from a technical standpoint and ignoring fundamental factors for a moment will provide an excellent risk to reward opportunity for a pullback to the yearly pivot @ 507 followed bt a gap close at the Monthly S2 @ 530. Should we see more downside the only other obvious major level of support is near 475


monitor and enter longmonitor and enter long...nothing much to lose as long as China still has an ageing population which requires asset management and insurance services.


2801 PINGAN > TRADE RANGE > LONG1) Multiple Support
2) Bullish pinbar
3) Stoch Oversold
4)Swing & trade range
Entry: 68.95
TP: 99.7
SL : 66

<TradeVSA> Pullback Completed with NS. LK Tech & ProsperousSign of Strength in the chart:
1. Reaccumulation
2. Strong uptrend
3. No major weakness at resistance
4. VCP
Disclaimer
This information only serves as reference information and does not constitute a buy or sell call. Conduct your own research and assessment before deciding to buy or sell any stock

Hong Kong Listed Vobile Back at the BottomVobile is at an interesting strong support area where previously it has fairly consistently bounced back off the bottom for a reasonable 30-40% type swing trade.
Worth a look if you think it will happen again :)

Yeebo's finally had a pullback so looking interesting.Yeebo is in the business of developing, manufacturing, and marketing display products including monochrome LCD,LCD Module, TFT module, Capacitive Touch Panel, Touch Display, etc. Yeebo's products have a strong global presence in key electronic market sectors including Industrial applications, Telecommunications, Medical equipment, and Electronic consumable products.
I see these LCD panels everywhere these days and I've been watching the momentum in their chart for a few days and have been waiting for a pullback into a value area to start to look for an entry. With todays drop of around 6% I'm keeping a closer eye on it now for an entry.
