China's SaaS: An 'Open Ocean' Up Ahead (4/4)China's cloud computing industry is still gradually developing, which implies infinite opportunities. When it comes to SaaS, the potential is even larger. This article is an overview of the country's cloud computing industry featuring the key players in the market, including Kingdee, Kingsoft, Youzan and Weimob.
Server device
In China, public cloud services have been increasingly popular, along with a number of existing customers showing desires to extend and customize the providers' offerings at their own expense. The country's cloud service value chain possesses enormous investment value at different levels. One reason is that the high cost of data migration generates solid user stickiness; the other reason is the relative independence of the sector from macroeconomic fluctuations. As projected by IDC, the cloud computing penetration among enterprises will increase to 15.8% by 2024 in China. By then, the market size will reach CNY 563.3 billion.
Currently, China's cloud market is at an early stage of development, with a lower market penetration rate compared with that in the United States. As per R&D World, China's spending on research and development (R&D) is expected to top with USD 621.5 billion in 2021, denoting a 25.5% share of the global R&D spending that year. In contrast, China's spending on cloud computing services only accounts for 6.2% of the global figure. It points to the fact that there is a great potential for the cloud computing market within China along with the continuing technological development.
11 out of the 20 most prominent tech companies in the US have been intensively engaged in the software-as-a-service (SaaS) business, which accounts for 40% of the value of those 20 companies. On the contrary, only 6 out of the 20 major tech players in China have SaaS business, occupying slightly 3% of the total value of those 20 largest Chinese techs. The industry's key players in China are the local SaaS providers such as Kingdee and foreign players that charge exorbitant prices in exchange for customized services.
Considering China's strict regulation on foreign companies, especially in various technology-related fields, the local companies are more likely to get the upper hand in the competition.
Weimob (02013:HK)
Weimob was founded in 2013 and currently has over 5,700 employees, 1,600 channel partners, and 3 million registered merchants. Providing cloud-based commerce and marketing solutions, it leverages Tencent’s social networking service platforms for SMBs in China. The company provides SaaS and other software for e-commerce, retail, catering, hotel, local life and other industries, enabling merchants to carry out traffic management, obtain public domain traffic, and supports them to achieve digital transformation.
In view of the recent trend of more enterprise customers maintaining direct connections with users through WeChat, Weimob will see strong momentum in digital commerce revenue growth and continue to expand its scope from the SaaS area to more extended services.

China's SaaS: An 'Open Ocean' Up Ahead (3/4)China's cloud computing industry is still gradually developing, which implies infinite opportunities. When it comes to SaaS, the potential is even larger. This article is an overview of the country's cloud computing industry featuring the key players in the market, including Kingdee, Kingsoft, Youzan and Weimob.
Server device
In China, public cloud services have been increasingly popular, along with a number of existing customers showing desires to extend and customize the providers' offerings at their own expense. The country's cloud service value chain possesses enormous investment value at different levels. One reason is that the high cost of data migration generates solid user stickiness; the other reason is the relative independence of the sector from macroeconomic fluctuations. As projected by IDC, the cloud computing penetration among enterprises will increase to 15.8% by 2024 in China. By then, the market size will reach CNY 563.3 billion.
Currently, China's cloud market is at an early stage of development, with a lower market penetration rate compared with that in the United States. As per R&D World, China's spending on research and development (R&D) is expected to top with USD 621.5 billion in 2021, denoting a 25.5% share of the global R&D spending that year. In contrast, China's spending on cloud computing services only accounts for 6.2% of the global figure. It points to the fact that there is a great potential for the cloud computing market within China along with the continuing technological development.
11 out of the 20 most prominent tech companies in the US have been intensively engaged in the software-as-a-service (SaaS) business, which accounts for 40% of the value of those 20 companies. On the contrary, only 6 out of the 20 major tech players in China have SaaS business, occupying slightly 3% of the total value of those 20 largest Chinese techs. The industry's key players in China are the local SaaS providers such as Kingdee and foreign players that charge exorbitant prices in exchange for customized services.
Considering China's strict regulation on foreign companies, especially in various technology-related fields, the local companies are more likely to get the upper hand in the competition.
China Youzan (08083:HK)
Youzan provides merchants with social network-based SaaS systems with omnichannel operations and integrated new retail solutions, applying PaaS cloud services to create business customization options while providing extended services, such as Youzan Guarantee, Youzan Distribution and Youzan Promotion.
Within Youzan's ecosystem, merchants can sell items via social networks, managing their own omnichannel retail through the company's SaaS solutions. The firm also offers a variety of cloud-based commerce services to merchants through a suite of SaaS products such as Youzan WeiMall, Youzan Retail, Youzan Chain, Youzan Beauty and Youzan Education. In addition, Youzan specializes in the SaaS business that supports SME merchants and facilitates retail transactions. Across industries, management teams lacking a technical background can easily open a customized online store on Youzan.
Youzan's gross merchandise volume (GMV) in 2020 was CNY 103.7 billion, a 61% increase compared to 2019's figure. In the same year, the gross profit margin of its SaaS products increased by 11.8%, reaching 76.0%.

China's SaaS: An 'Open Ocean' Up Ahead (1/4)China's cloud computing industry is still gradually developing, which implies infinite opportunities. When it comes to SaaS, the potential is even larger. This article is an overview of the country's cloud computing industry featuring the key players in the market, including Kingdee, Kingsoft, Youzan and Weimob.
Server device
In China, public cloud services have been increasingly popular, along with a number of existing customers showing desires to extend and customize the providers' offerings at their own expense. The country's cloud service value chain possesses enormous investment value at different levels. One reason is that the high cost of data migration generates solid user stickiness; the other reason is the relative independence of the sector from macroeconomic fluctuations. As projected by IDC, the cloud computing penetration among enterprises will increase to 15.8% by 2024 in China. By then, the market size will reach CNY 563.3 billion.
Currently, China's cloud market is at an early stage of development, with a lower market penetration rate compared with that in the United States. As per R&D World, China's spending on research and development (R&D) is expected to top with USD 621.5 billion in 2021, denoting a 25.5% share of the global R&D spending that year. In contrast, China's spending on cloud computing services only accounts for 6.2% of the global figure. It points to the fact that there is a great potential for the cloud computing market within China along with the continuing technological development.
11 out of the 20 most prominent tech companies in the US have been intensively engaged in the software-as-a-service (SaaS) business, which accounts for 40% of the value of those 20 companies. On the contrary, only 6 out of the 20 major tech players in China have SaaS business, occupying slightly 3% of the total value of those 20 largest Chinese techs. The industry's key players in China are the local SaaS providers such as Kingdee and foreign players that charge exorbitant prices in exchange for customized services.
Considering China's strict regulation on foreign companies, especially in various technology-related fields, the local companies are more likely to get the upper hand in the competition. Four companies discussed below are those positioned exceptionally well to benefit from the country's cloud upgrade:
Kingdee (00268:HK)
Holding 6.8% of China's cloud market, per EqualOcean data, Kingdee has maintained the largest share in enterprise SaaS cloud services for two consecutive years, while its enterprise-grade SaaS ERM (cloud ERP) and 'Financial Cloud' services have taken this position for 4 consecutive years. Kingdee is also one of the largest ERP software providers in China.
In 2020, Kingdee continued to redirect resources to the SaaS business, leveraging its large corporate customer pool, in an attempt to gradually alienate itself from the ERP software business by focusing on the development and promotion of subscription-based cloud products. As a result, the SaaS business reached 57% of the total revenue in the 2020 fiscal year, surpassing the ERP business (43%) for the first time. After cultivating a solid customer base in its ERP segment, Kingdee would be able to convert many of them into buyers of the other services.

Has Nayuki's Tea Moved Too Fast?On the first day of listing, Nayuki (also known as Naixue's Tea) opened 4.75% lower than the issue price, at HKD 18.86, and the largest intraday drop expanded to 11%.
As of press time, the total market value of Nayuki's Tea has fallen to HKD 30.34 billion from 32.3 billion.
Nayuki's Tea has completed a total of five rounds of funding ahead of the IPO. On June 21, it received its most recent strategic financing of CNY 4.87 billion with China Southern Fund, UBS Fund, China Guangfa Fund and CCB International as joint investors.
In recent years, the Chinese tea market has been growing rapidly. According to CBNData, China's new tea market is expected to exceed CNY 110 billion in 2021. The number of consumers of new tea drinks has hit 340 million high. At the same time, it is a competitive market, the survival rate of the industry is relatively low. As of November 30, 2020, there were over 300,000 Chinese 'New Tea' drinking stores, of which more than 130,000 were closed, liquidated, revoked, or de-registered, accounting for up to 43%.
From 2018 to 2020, the total revenue of Nayuki was CNY 1.09 billion, CNY 2.5 billion and CNY 3.06 billion respectively, of which the net loss was CNY 70 million, CNY 40 million and CNY 203 million, respectively. According to the prospectus, the main reason for the loss is the continuous expansion of business scale and tea shop network, which requires a large amount of funds to operate and deal with potential business opportunities.
Funded in 2015, the Shenzhen-headquartered company has 489 stores over 66 cities in China. The prospectus shows that, in terms of total retail consumption in 2020, Nayuki's tea is the second largest tea shop platform in China's 'New Tea' or high-end ready-made tea shop market, with a market share of 18.9%, second only to HeyTea.

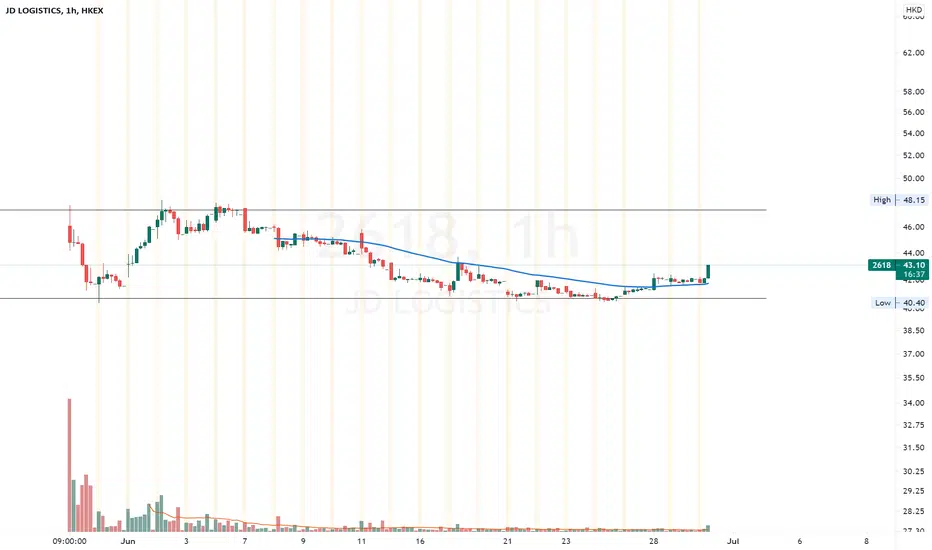
SEHK 2618 - JD LogisticsPromising spinoff of JD.com. Had a tiny consolidation above the moving average and is rising on volume today. Range Trade with a TP of $48
YADEA 1585 60$ before dec 2022I invested in this perfect stock after researching all data: positive cash flow, emloyment, investors, production, snowflake, value, debt <3

MEITUAN-W (HK 3690)Head and shoulder breakout. Any retracement will be an opportunity to go long, expect to take a profit of around 405 HKD.


Divergence DetectedI have bullish outlook on this due to divergence. Wait for the trendline to break for confirmation.

Yeahka ready for a new rally? Last year Yeahka had a great rally when Chinese SaaS stocks received attention from ARKK buys.
This has come all the way down, now it is undervalued.
Cathie is still holding.
A big guy from Tencent running the show.
Tencent owns a partial stake.
Great company. Square of china. Huge TAM.
Yes, there is competition. However, market is big enough to go to SQ-like valuation (that is a 5x). Give it a few years.
This is my personal opinion and not investment advice.


Expecting Further UpsideExpecting further upside after Tencent leaves Re-accumulation Phase (Trading Range) possibility entering in Mark Up Phase.
Over the Re-accumulation range, stock showed the transition from supply dominated action to weakening of supply to demand dominated action.
Stock is trading relatively stronger than the broad market (RS above zero), indicating strength in demand for the stock.
Price trading below $550 level will falsify the Mark Up Phase analysis and stock will reenter trading range.

Solar energy sector could be near to start another rally It doesn't really matter much which one you choose, they move pretty much the same.
They may have hit a bottom on May 13.
They have been falling since January.
I think they are still far from reaching their absolute maximums.
NYSE:SOL
AMEX:TAN
NASDAQ:FSLR
HKEX:968
NYSE:JKS
NASDAQ:ICLN
NASDAQ:SEDG
NASDAQ:RUN
NASDAQ:SPWR
NASDAQ:CSIQ
NASDAQ:VVPR

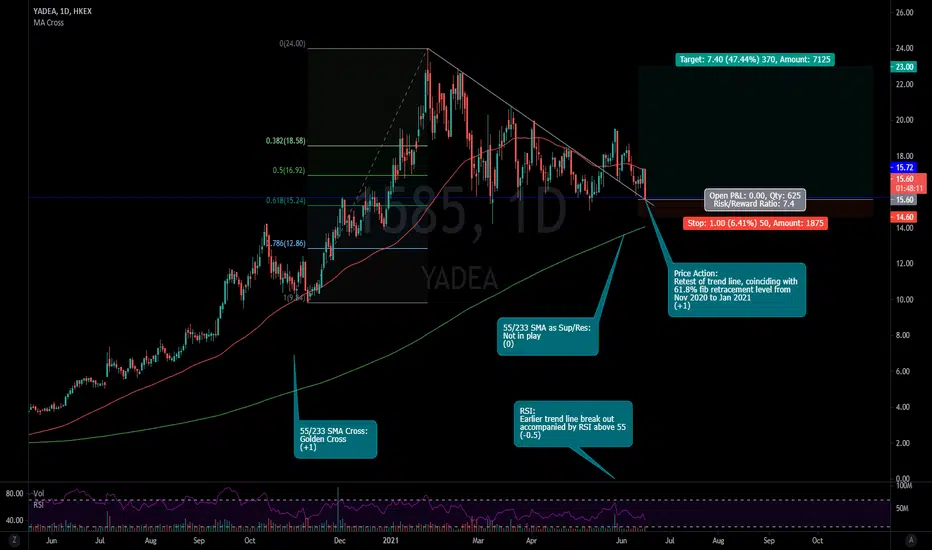
Time For Yadea To Continue Its UptrendHKEX:1585
Trade Indicators
55 & 233 Daily SMA Cross: +1
Using 55 and 233 as Fibonacci versions of 50 and 200 day moving averages
Currently in golden cross.
55 & 233 Daily SMA as Support & Resistance: 0
Currently not in play.
Relative Strength Index: -0.5
Earlier trend line break on May 20 was accompanied by RSI at 58. This shows strength above 55, but not overbought below 70.
Currently weak below 45.
Price Action: +1
Price is retesting the trend line that it broke out of on May 20, and is also sitting on a key support level at around $15.72, which coincides with the 61.8% Fibonacci retracement level of the move from Nov 11 to Jan 26.
Price Levels
Entry: $15-$16
Entry between this area of strong support.
Stop Loss: $14.60
A break below $15 could suggest further downside.
Target: $23.00
Targeting to take partial profits near the all-time highs, and letting the rest run as a continuation of this uptrend that started in March 2020 is expected to continue.
finance.yahoo.com
9988.HK Alibaba Pyramid of Doom over soon?After all the apocalypses they experienced since last year, It seem china BABA, gaining momentum soon. What's your take?
