Sihuan Pharma (460 SEHK) 15th April - Price broke out of triangle on 14/4 with volume 2x of previous 5 day MA. Waited for a pullback and long for 3K at 2.44 (days low was 2.41), SL at 1.99, which is the base of the last consolidation. Once price moves above 2.55 will tighten stop.

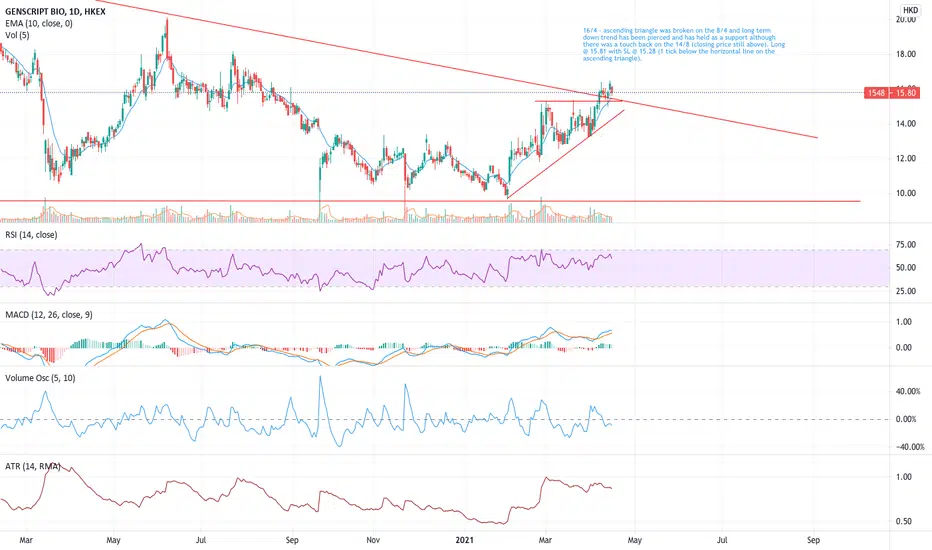
Genscript Biotech (1548 SEHK)16th April: Ascending triangle was broken on the 8/4 and long term down trend has been pierced and has held as a support although there was a touch back on the 14/8 (closing price still above). Long @ 15.81 with SL @ 15.28 (1 tick below the horizontal line on the ascending triangle).
Ping An Insurance [1-3 weeks view]This analysis is for a client.
Looks good for a short as price has looking to break below recent low back in Feb 2021.

LONG 1610 (Cofco)Expecting bounce from extremely oversold weekly and daily levels. If stop breached, be prepared to catch new daily reversal on lower levels with a tight stop.

LONG 1579 (Yihai)Expecting bounce from extremely oversold weekly and daily levels. If stop breached, be prepared to catch new daily reversal on lower levels with a tight stop.

Cherish your life Please spend a minute or two and join me to pray for the family of Mr Wang Long. Read his story here
There are many compartments of our lives, depending on which stage we are in.
We have
Family
Health & wellness
Career
Hobbies/Interests
Spiritual
Finance
Community
The above is just a rough guide and you can slice and dice the way you want to run your life. While making money is important since we need a certain amount to sustain our lifestyle but it should not be overbearing and take over all areas of your life that lose focus on the other areas.
There is a chinese saying, when young , you have health but you did not take care of it and slog and toil and play , diminish its importance and when you aged, you have money but no health. Often, I see mens and womens in their 50s-60s on wheelchairs and some even begging on the streets.
Think of it this way - you can lose all your money and start over again but if you lose your life, that's it. Same as diversification in stocks strategy, we must also diversify our time into other important parts of our lives.
Yes, having losses is painful, having to pay off the debts is painful but to take one's life and leave the family behind is even more painful to bear. Where there is a will, there is a way , so we must exercise prudence in our investing/trading and not let it affects our lives too much.
What goes down must come up and what goes up will also come down. Like the four seasons, each has its time.
Ecclesiastes 3:1-22 ESV /
For everything there is a season, and a time for every matter under heaven: a time to be born, and a time to die; a time to plant, and a time to pluck up what is planted; a time to kill, and a time to heal; a time to break down, and a time to build up; a time to weep, and a time to laugh; a time to mourn, and a time to dance; a time to cast away stones, and a time to gather stones together; a time to embrace, and a time to refrain from embracing; ...

Sunny Optical IdeasEntered some sunny optical stock and have a lot of confidence due to the recent underperformance of the Hang Seng Tech Index. Looking for $220 and let's see if that happens!

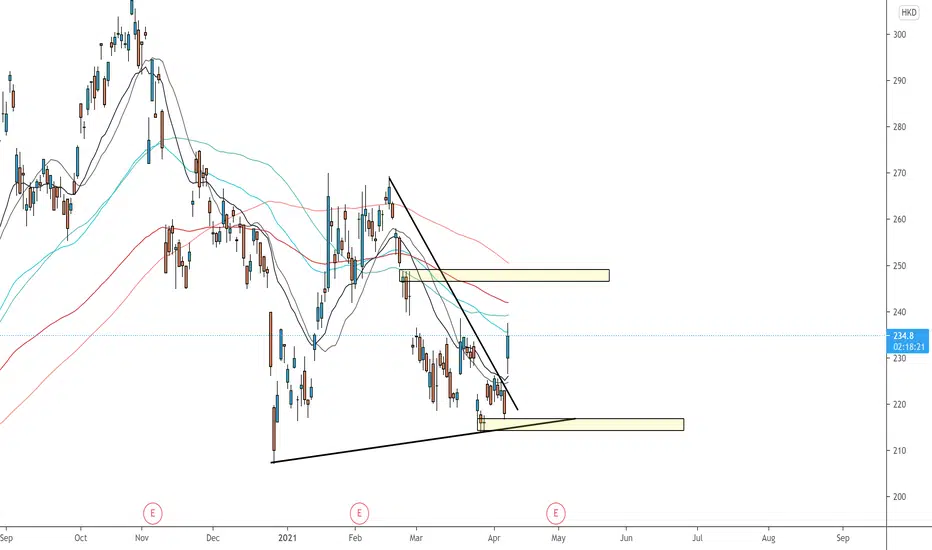
Random HK OpinionOne nice neat suggestion for Hong Kong post/delivery stock? I am looking for $250 level and feel free to dive in :D

Tencent 700Hk - Slow & SteadyCurrently at a 24% discount off the peak of 775.5HKD on 17 Feb 2021, China/HK techs been facing alot of noise due to China Government policies to rein in the tech sector.
Currently after the 2.8Billion USD fine on Alibaba, there was a major news selloff on the 13 Apr 2021 that regulators invited most tech
for a meeting such as Tencent / JD / Meituan / Pinduoduo and more. However a major contrast was that the techs were all given 1 month notice to change and adhere to the guidelines which shouldn't be an issue.
Key point to hold long term
generating massive revenues from mobile gaming such as PUBG MOBILE and continue churning out games (E-sports as ongoing trend)
PUBG Mobile was the highest grossing game in 2020, generating $2.6 billion in revenue.
It has been downloaded over 730 million times.
In Q3 2020, over 50 million people played the game daily
www.businessofapps.com
sensortower.com
Strong business fundamentals / balance sheet / well invested into multiple companies
Target pricing on 11 June 2021
TP High - 700
TP Low - 641
For discussion & education, Invest at your own risk


Have a pie of Chinese Healthcare market Read latest news here and here
What will be the new US President , Joe Biden stand on US-China relationship ? Will he continue to impose trade tariffs like Donald Trump ? How about the delisting of Chinese stocks on Wall Street ? If the latter continues to happen, we can expect more Chinese companies returning to HK to get a second listing.
Chart wise, this IPO has gone up quite a fair bit from its IPO price of 70 dollars. Now, it is undergoing a correction and I expect 133.3 to 145.5 to be the next support level it will revisit before we see bullish trend resuming.

The worst might be over Record breaking lost with no full recovery in sight ?Appears to have reversed on the monhtly, week and daily chart.
Perhaps Vaccines passport will be the next play for this recovery. lets not forget how many people need to travel when there's some form of normality in-spite of potential hikes in everything

1810150 EMA (daily layout) BIG CAP STRONG FUNDAMENTAL COMPANY. Very long term position. Comments please.

Bullish on BABA after being fined $2.8BFinally got the result of the anti-monopoly probe. $2.8 billion is a big number. 4% of its whole year sale in 2019. But bad news is good for BABA. For me, it's an ending of phase 1. Things might be bad for other Chinese tech companies as they may be next targets.
From the chart, I suggest buying at the pullback, say 226.
Boqi Environmental Protection (02377) granted 3.12 million shareBoqi Environmental Protection (02377) issued a notice that on 7 April 2021, the Company offered to grant 3.12 million Share Options to eligible grantees pursuant to the Share Purchase Plan adopted on 29 December 2020 at an exercise price of HK $1.51 per Share.

Tencent fighting downtrendHi,
Seems that downtrend is broken.
Daily oscillators in deep minus (bullish). Weekly oscillators showing golden cross.
I opened a position here.
BUT. Could drop to 583-595 level for a short time.
PS. My personal opinion, that 0700 should grow.
AG

Galaxy Ent is facing bearish pressurePrices are approaching our resistance in line with our fibonacci confluence levels where we could see a reversal below this level. Ichimoku cloud is showing signs of bearish pressure as well, in line with our bearish bias.

Sunny Optical is facing bearish pressure Prices are facing bearish pressure from our resistance in line with our 61.8% Fibonacci retracement and 100% fibonacci extension where we could see a further drop below this level.

Future of Tencent ?Yes like many investors, I too did not like what I had read thus far about Tencent and it subsidiaries. Article here
Will it follow the fate of Baba where share price plunged more than 30% from its peak ?
I suspect more volatility ahead for HK and China Tech companies and movement in Nasdaq could also have an impact on its share price. Now with the 1400 stimulus in the hands of the US citizens, would this 100 over billion dollars be pour into the market ?
If yes, then we could potentially see a spike up soon and high tide rises all vessels and that would help the HK and China shares as well.
So, for those who bought at a high price and feel you do not want to stomach further risks, then you may want to cut loss and buy back when it is cheaper. I own Tencent along with many other companies with some in the red as I bought at higher prices but overall portfolio still in the green.
I am also taking partial profits for some stocks that have gone up quite a fair bit over the last 2 months. My short term trades have not been too good as well leading to some losses. So, I am taking a short break from trading and focusing on reviewing my portfolio.
I could be taking some short positions to take advantage of the market volatility and I would post soon if I encounter any interesting company.
Till then, stay safe, always use a stop loss, allocate proper capital and understand that market does not move in a linear fashion but series of ups and downs. It is what you do with your mind during this downtime that sustain you to go forward. For Tencent and Baba which I owned both companies, I find their business model are still intact and thus the recent selldown would be a good opportunity for me to accumulate its shares. But that is imo and I do not represent the majority so take a pinch of what I do and do your own due diligence.

