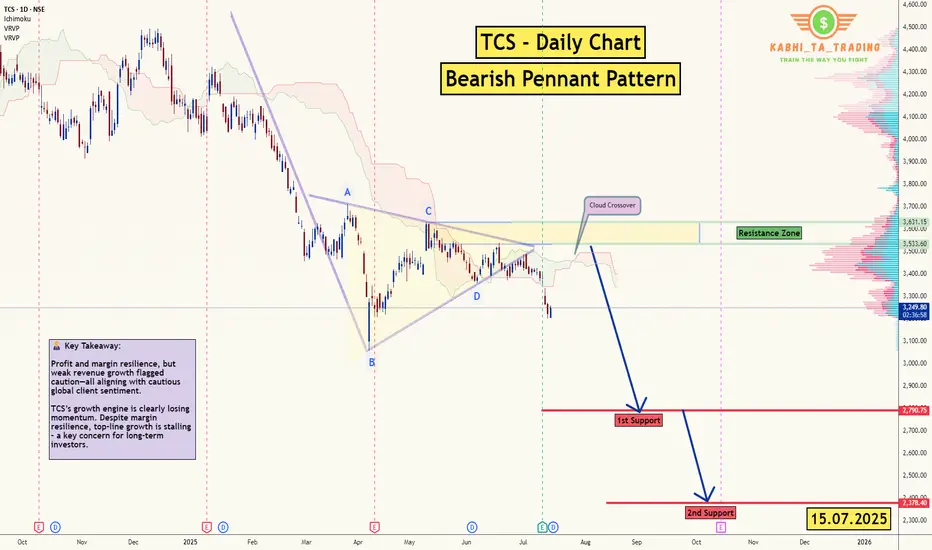
TCS - D1 - Bearish Pennant 🧾 1. 📊 Q1 FY26 Earnings Summary
i. Revenue: ₹63,437 cr (~US $7.4 bn), up just 1.3% YoY, missing expectations of ~₹64,667 cr
ii. Profit/margin held up; revenue disappointed.
📌 Key Takeaway: Profit and margin resilience, but weak revenue growth flagged caution—all aligning with cautious global client sentiment.
🔮 2. Upcoming Events & Catalysts :
Ex‑Dividend Date: Record date July 16, for interim dividend of ₹11/share.
Macro Cues: U.S. tariff developments, global IT spend trends, and sector peers (HCL, Infosys) Q2 reports. Reflation in IT services could shift sentiment.
TCS Investor Engagements: Gen‑AI STEM program (Jul 9); presence at global fintech & life‑sciences events through Sep (SIBOS, COBA) .
📆 3. Catalysts Ahead :
Global IT Budget Trends (esp. U.S. and Europe) → direction for next‑quarter bookings.
Peer Q2 Results (HCL, Infosys) → could provide broader sector cues.
New Deal Wins from BFSI/USD clients → margin & growth potential.
Macro Developments: Trade policies, Fed signals, and inflation data.
Thank you.
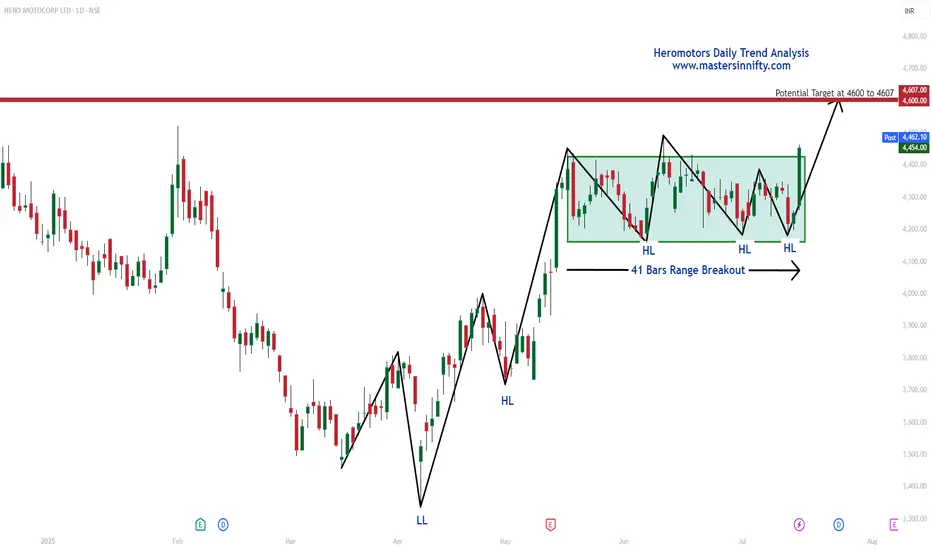
Heromotors Daily Trend Analysis"As per my Daily Trend Analysis, Heromotors Ltd has broken out of a 41-bar range and closed above it today. This breakout indicates a potential upward move toward the resistance zone of 4600 to 4607 in the coming sessions.
Traders are advised to perform their own technical analysis and ensure proper risk management before entering the trade."
Moving average has only one principle, solve the problem, earn mMoving average has only one principle, solve the problem, earn money,
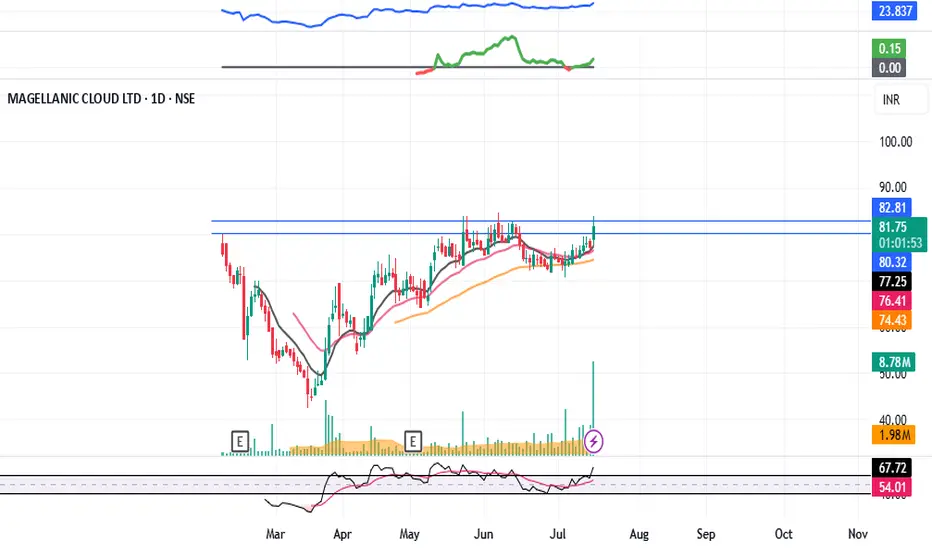
MCLOUD : Post IPO Base Breakout#MCLOUD #IPOstock #breakout #momentumstock #patterntrading #cupandhandle
MCLOUD : Swing Trade
>> Post IPO Base Breakout
>> Cup & Handle Pattern
>> Trending Stock
>> Good Strength & Volume Building-up
Swing Traders can lock profit at 10% and keep trailing
Pls Boost, Comment & Follow for more analysis
Disc : Charts shared are for Learning purpose not a Trade Recommendation, Take postions only after consulting your Financial Advisor or a SEBI Registered Advisor.
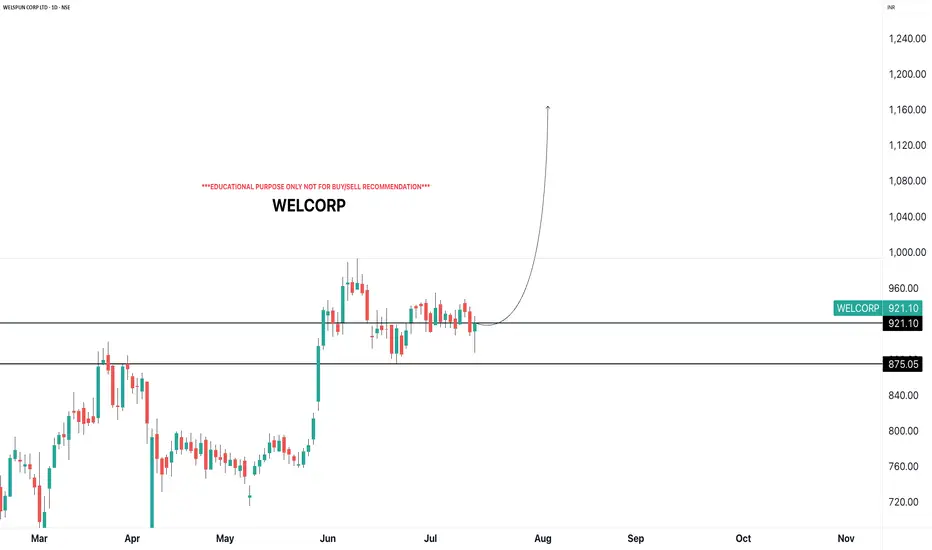
WELCORPi Observed these Levels based on Price Action and Demand & Supply which is my own Concept "PENDAM CONCEPTS"... Please don't take any trades based on this chart/post... Because this chart is for educational purpose only not for Buy or Sell Recommendation... Thank Q
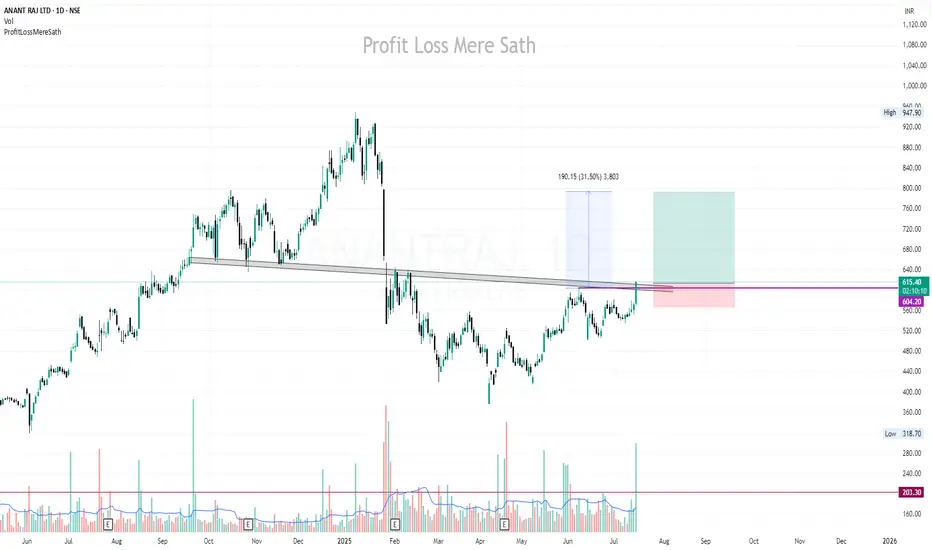
ANANTRAJ | Buy @LTP | SL below 560 | Target 790Disclaimer:
This is not financial advice. Please do your own research or consult with a financial advisor before making any investment decisions. Investments in stocks can be risky and may result in loss of capital.
Biocon: Heading for All-Time High?🚀 Biocon: Heading for All-Time High? 🚀
📉 CMP: ₹390
🔒 Stop Loss: ₹330
🎯 Targets: ₹428 | ₹478 | ₹560
🔍 Why Biocon Looks Promising?
✅ Weekly Rounding Bottom Breakout: Breakout triggered above ₹390
✅ Weekly Box Breakout: Confirmation above ₹398 strengthens the setup
✅ Final Confirmation: A weekly close above ₹402 will validate the breakout for a potential strong upside
💡 Strategy & Risk Management:
📈 Phased Entry: Build positions gradually post confirmation to manage risk effectively
🔒 Strict SL: Maintain stop loss at ₹330 to protect capital in case of reversal
📍 Outlook: Biocon is showing strong technical signals with an all-time high on the radar, making it a compelling positional trade setup.
📉 Disclaimer: Not SEBI-registered. Please do your own research or consult a financial advisor before investing.
#Biocon #PharmaStocks #TechnicalBreakout #AllTimeHigh #SwingTrading #StockMarket #InvestmentOpportunities

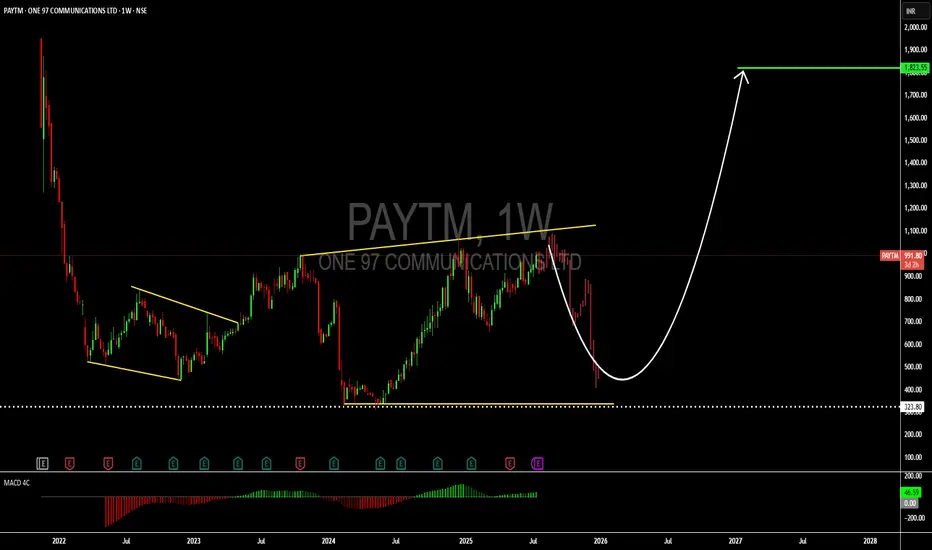
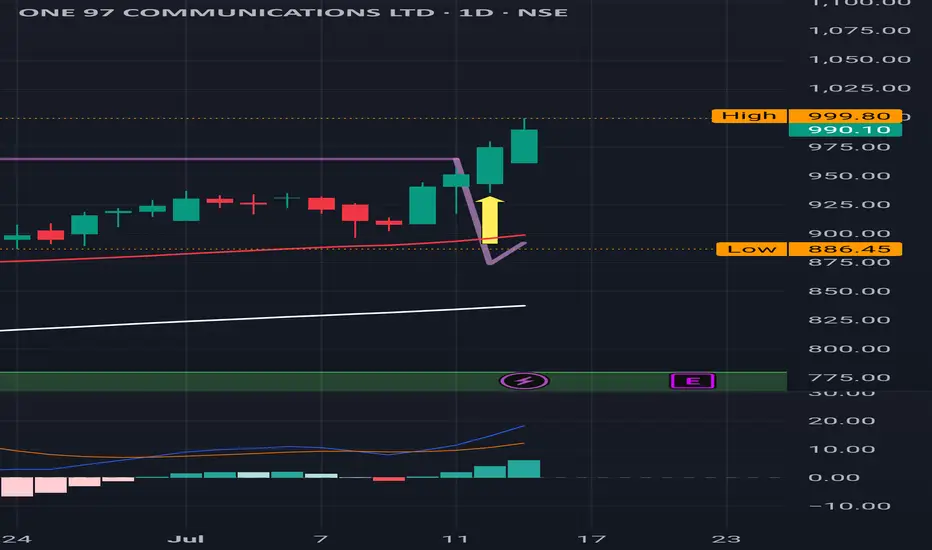
A long-term hold: PAYTM stockHello,
One 97 Communications Ltd. or PAYTM engages in the development of digital goods and mobile commerce platform. It operates through the following segments: Payment, Commerce, Cloud, and Others. The company was founded by Vijay Shekhar Sharma on December 22, 2000 and is headquartered in Noida, India.
The company's revenue continues to grow over time. During the 4th Quarter ended 31st March 2025, PAYTM reported revenu of $224M up from $214Mn in the previous quarter (Up 5% QoQ). The company is also now close to break-even from a profit after tax metric. PAT* of $(3) Mn, an improvement of $22 Mn QoQ. The business generated a net payment margin of $68mn including UPI incentive.
To continue driving value growth, the company states that they will be focusing on the below pillars;
Merchant payments
Consumer acquisition
International business
Financial services
Looking at the The Paytm Q4 FY25 report reveals several compelling opportunities for growth and profitability. The expanding merchant ecosystem, now at 12.4 million devices, provides a strong foundation for deeper financial services penetration, particularly merchant lending, which has seen consistent growth and high repeat rates. With India’s MSME sector largely underpenetrated in digital payments, there is a vast opportunity to deploy innovative payment solutions, especially in tier-2 and tier-3 cities. Additionally, the company’s focus on new products like the Solar and Mahakumbh Soundbox positions it well to enhance merchant engagement and retention. The financial services segment, buoyed by better asset quality and growing lender partnerships, offers room for scale in both lending and wealth management. Furthermore, regulatory prospects such as the introduction of MDR on UPI payments for large merchants could open new monetization pathways. International expansion, though longer-term, presents another avenue for replicating Paytm’s tech-driven financial services model in other markets.
While the situation looks positive, there are a few risks for this company.
Regulatory uncertainty
Credit cycle sensitivity
Competitive pressure
Security risks as Paytm scales its plartforms.
Dependence on incentives
The above risks are likely to delay or limit Paytm’s ability to achieve sustained profitability and growth across its payment, lending, and financial services segments. From a technical perspective, we see PAYTM as a long term buy or hold seeing long term opportunity for massive growth in the company.
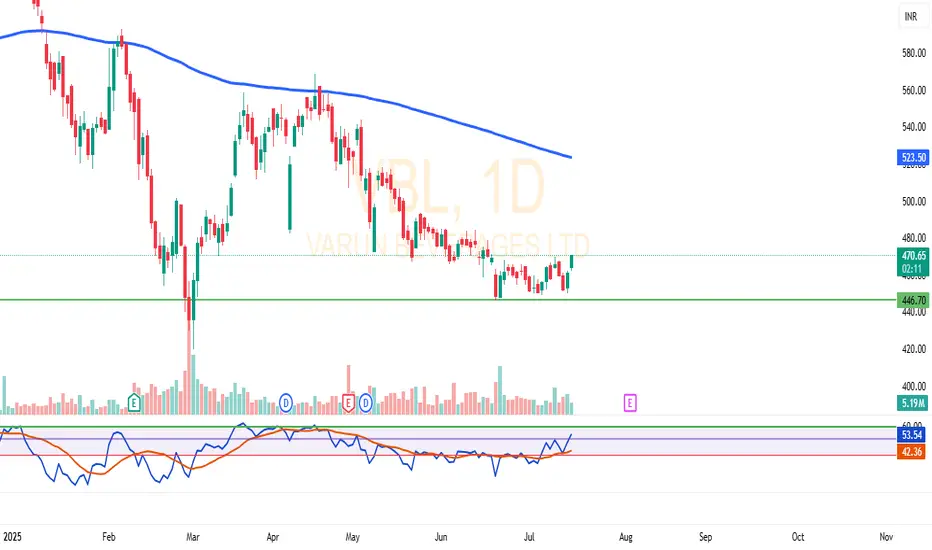
VBL Bounces from ₹446 Support – RSI Breakout with Volume SpikeVBL has shown multiple rebounds from the strong support zone around ₹446.
After several weeks of sideways consolidation, the stock is attempting a breakout with increased volume in the current session.
The RSI indicator has moved above the 50 level with a bullish crossover, indicating potential strength building up.
On the upside, the 200 EMA near ₹523 may act as a resistance level.
📊 This is a technical observation based on price structure, volume, and momentum — not a buy/sell recommendation.
The setup appears interesting for technical traders watching for a breakout from this range.
🔍 What’s your take on this pattern? Feel free to share your view in the comments.
PFC– At Resistance with Ascending Triangle PatternPower Finance Corporation (NSE: PFC) is forming a technically clean structure — trading within a rising trend channel and now testing a critical resistance zone around ₹430–₹440.
This is a make-or-break level, and the market could tip in either direction depending on how price reacts this week.
1. Chart Structure Overview
Support Zone: Defined by a rising green trendline connecting higher lows since March 2025.
Resistance Zone: Red band between ₹430–₹440, where price has previously reversed multiple times.
200 EMA (Blue Line): Currently hovering around ₹423, adding confluence as a dynamic support/resistance level.
This convergence makes the current price zone crucial for directional confirmation.
2. Two Trade Scenarios
Scenario 1: Bullish Breakout (Trend Continuation)
If the price breaks above ₹440 with strong bullish candles, traders can look for:
✅ Entry after a confirmed breakout + re-test of the ₹430–₹435 zone
🎯 Target Zones: ₹455, ₹470+
🛡️ Stop Loss: Below the swing low of the re-test (₹425 or as per price structure)
🔁 Risk/Reward: 1:2 or better
Scenario 2: Resistance Rejection (Short-Term Pullback)
If the price fails to break above ₹430–₹440 and shows reversal patterns:
✅ Entry on confirmation (e.g., bearish engulfing, rejection wick)
🎯 Target Zones: ₹410 (near rising trendline), possible extension to ₹400
🛡️ Stop Loss: Just above the resistance (~₹442–₹445)
🔁 Risk/Reward: 1:2 to 1:3 depending on entry
Thread>


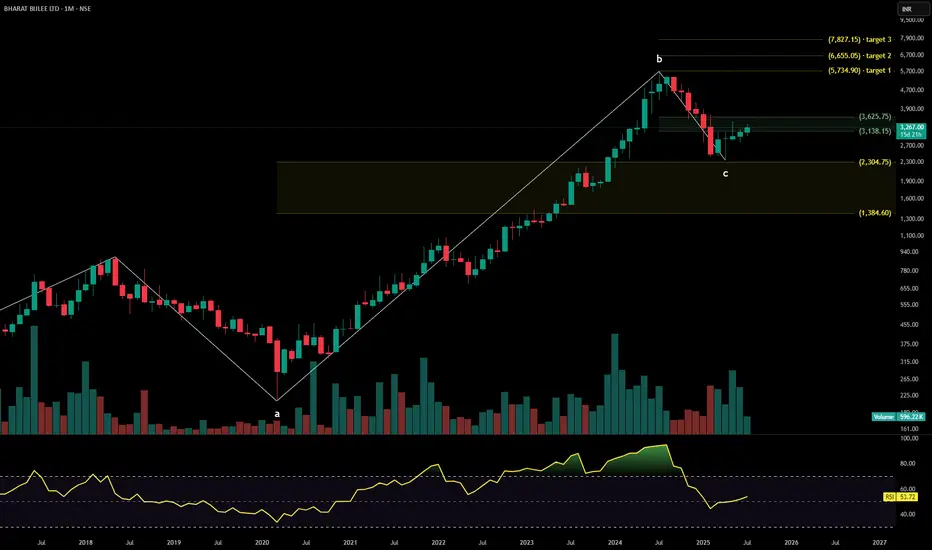
BHARAT BIJLEEBharat Bijlee Ltd. is a leading industrial electrical equipment manufacturer specializing in power transformers, electric motors, drives & automation, and project solutions. It caters to segments such as infrastructure, real estate, utilities, and OEMs. The stock is currently trading at ₹3,267 and is attempting a trend continuation post a broad consolidation, with fresh volume and Fibonacci alignment supporting breakout momentum.
Bharat Bijlee Ltd. – FY22–FY25 Snapshot
Sales – ₹750 Cr → ₹842 Cr → ₹923 Cr → ₹1,015 Cr – Steady growth driven by infra push and OEM demand
Net Profit – ₹58.3 Cr → ₹72.1 Cr → ₹84.6 Cr → ₹96.5 Cr – Margin expansion with operating scale
Company Order Book – Moderate → Strong → Strong → Strong – Solid pipeline in drives & automation
Dividend Yield (%) – 0.84% → 1.07% → 1.28% → 1.38% – Consistent payout with moderate yield
Operating Performance – Moderate → Strong → Strong → Strong – Increasing efficiency and utilization
Equity Capital – ₹5.69 Cr (constant) – Tight capital structure
Total Debt – ₹24 Cr → ₹19 Cr → ₹13 Cr → ₹10 Cr – Deleveraging over time
Total Liabilities – ₹302 Cr → ₹312 Cr → ₹319 Cr → ₹325 Cr – Stable with managed debt component
Fixed Assets – ₹123 Cr → ₹129 Cr → ₹136 Cr → ₹141 Cr – Conservative capex, efficiency-focused
Latest Highlights FY25 net profit grew 14.1% YoY to ₹96.5 Cr; revenue increased 10% to ₹1,015 Cr EPS: ₹169.54 | EBITDA Margin: 24.2% | Net Margin: 9.51% Return on Equity: 23.8% | Return on Assets: 12.7% Promoter holding: 68.73% | Dividend Yield: 1.38% New orders secured in industrial automation and high-efficiency motor vertical Capacity utilization improving across transformer and drives segments
Institutional Interest & Ownership Trends Promoter holding remains strong at 68.73%, with no dilution or pledging Recent quarters show consistent DII interest, particularly from infrastructure-focused mutual funds Delivery volume breakout confirms accumulation by mid-cap value portfolios HNI buying noted on trend continuation days aligned with breakout zones
Business Growth Verdict Yes, Bharat Bijlee is scaling gradually with deep infrastructure penetration and technical pedigree Margins improving through high-value products and services Balance sheet remains lean and de-risked with low debt levels Capex aligned with energy efficiency and industrial modernization trends
Company Guidance Management expects mid-teen revenue growth in FY26, driven by expansion in transformer orders, industrial automation, and OEM tie-ups Operating margins projected to sustain above 23% Strategic investments planned in digital controls and smart motor solutions
Final Investment Verdict Bharat Bijlee Ltd. represents a focused electrical capital goods play with consistent profitability, de-risked balance sheet, and high promoter alignment. Supported by trend continuation on monthly charts and volume strength near breakout zones, the stock is a candidate for staggered entry for investors seeking infrastructure-led manufacturing exposure with margin stability and institutional tailwinds.
FACT : Approaching a major Red Band Resistance FACT : Approaching a major Red Band Resistance .
Important Level to watch for is 1112 .
( Not a Buy / Sell Recommendation
Do your own due diligence ,Market is subject to risks, This is my own view and for learning only .)

Canara Bank FVG filled, Long TradeFVG created in Canara Bank is completely filled, if it sustains and breaks 116 then it may go up from here.
Entry at 116 on bullish candle stick pattern.
SL 112
Target 120+

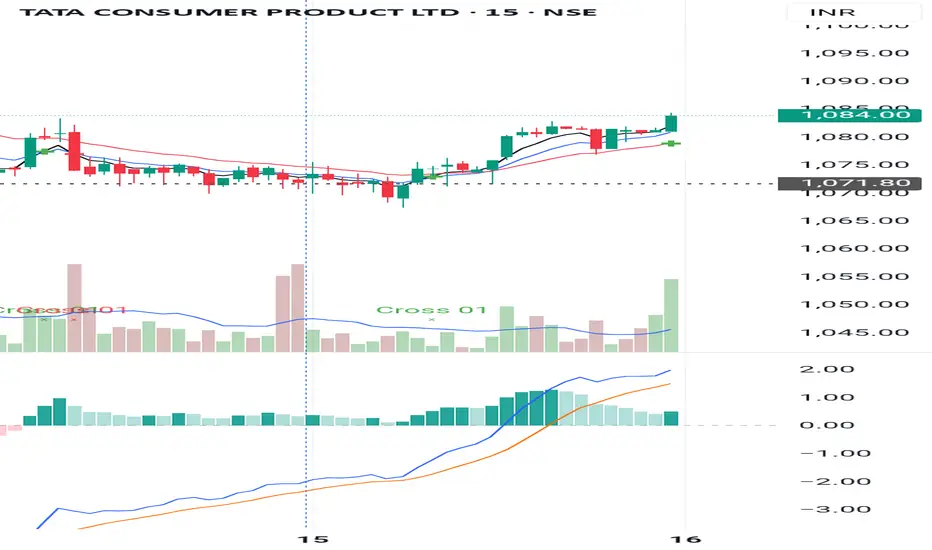
Paytm : Buy Triggered ,next level to watch for is 1062
Paytm : Buy Triggered ,next level to watch for is 1062.
( Not a Buy / Sell Recommendation
Do your own due diligence ,Market is subject to risks, This is my own view and for learning only .)
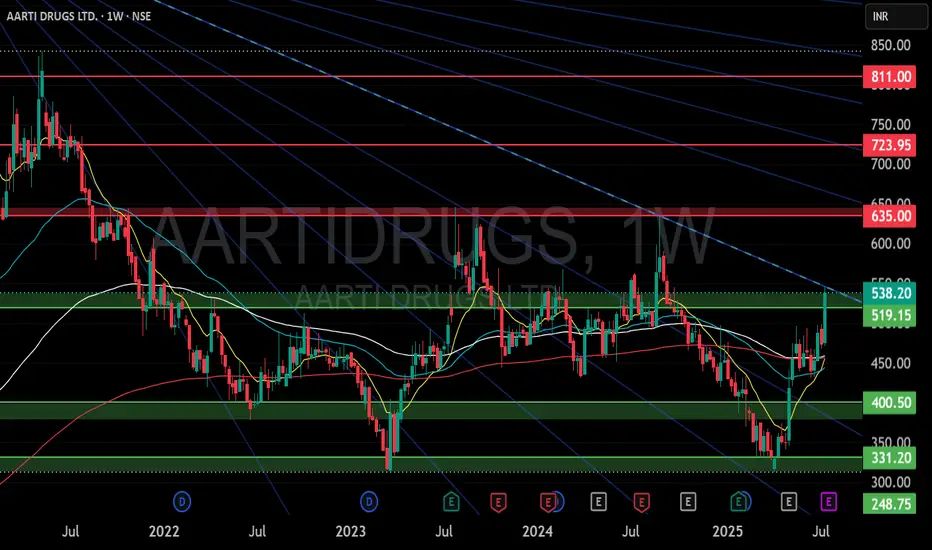
AARTI DRUGS LTD S/R Support and Resistance Levels:
Support Levels: These are price points (green line/shade) where a downward trend may be halted due to a concentration of buying interest. Imagine them as a safety net where buyers step in, preventing further decline.
Resistance Levels: Conversely, resistance levels (red line/shade) are where upward trends might stall due to increased selling interest. They act like a ceiling where sellers come in to push prices down.
Breakouts:
Bullish Breakout: When the price moves above resistance, it often indicates strong buying interest and the potential for a continued uptrend. Traders may view this as a signal to buy or hold.
Bearish Breakout: When the price falls below support, it can signal strong selling interest and the potential for a continued downtrend. Traders might see this as a cue to sell or avoid buying.
MA Ribbon (EMA 20, EMA 50, EMA 100, EMA 200) :
Above EMA: If the stock price is above the EMA, it suggests a potential uptrend or bullish momentum.
Below EMA: If the stock price is below the EMA, it indicates a potential downtrend or bearish momentum.
Trendline: A trendline is a straight line drawn on a chart to represent the general direction of a data point set.
Uptrend Line: Drawn by connecting the lows in an upward trend. Indicates that the price is moving higher over time. Acts as a support level, where prices tend to bounce upward.
Downtrend Line: Drawn by connecting the highs in a downward trend. Indicates that the price is moving lower over time. It acts as a resistance level, where prices tend to drop.
Disclaimer:
I am not a SEBI registered. The information provided here is for learning purposes only and should not be interpreted as financial advice. Consider the broader market context and consult with a qualified financial advisor before making investment decisions.
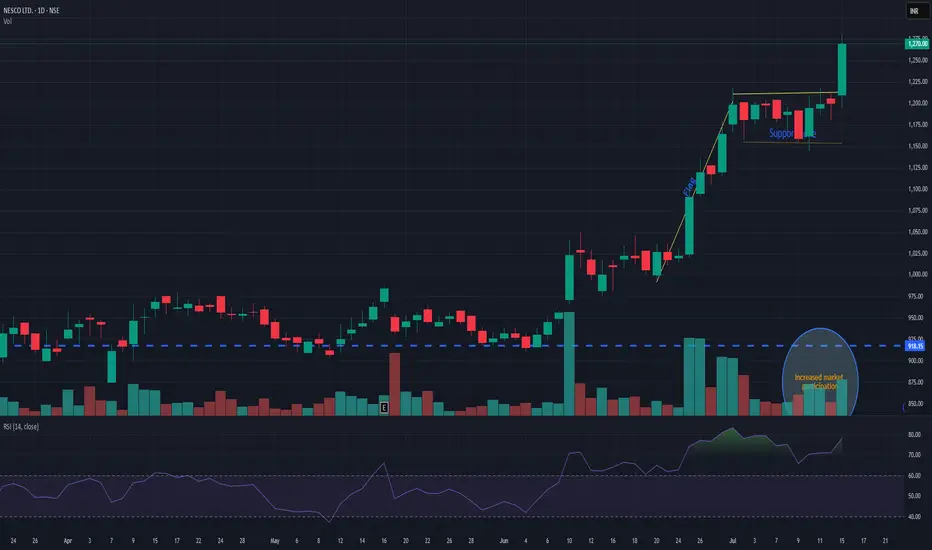
NESCONESCO giving flag pattern breakout with decent volume. Support is seen nr 1180. while pole initiation can be seen near 1010. Currently trading near 1270. It has a potential for new momentum. Keep it on radar.
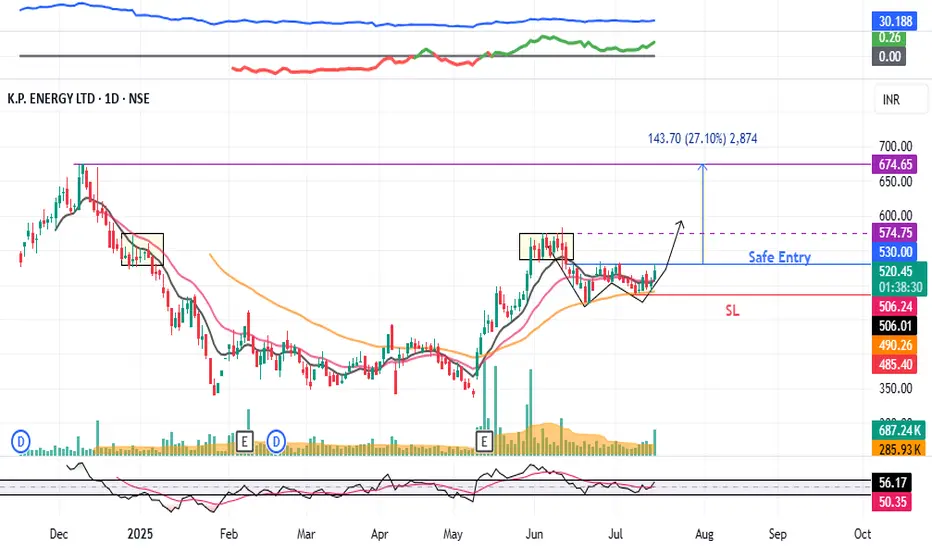
KPEL : Breakout stock#KPEL #swingtrade #breakoutstock #Wpattern #patterntrading
KPEL : Swing Trade
>> Trending Stock
>> W Pattern Breakout soon
>> Good Volumes & Strength
>> Good upside potential
Swing Traders can lock profit at 10% and keep trailing
Pls Boost, Comment & Follow for more analysis
Disc : Charts shared are for Learning purpose not a Trade Recommendation, Take postions only after consulting your Financial Advisor or a SEBI Registered Advisor.
shalby ltd at good risk reward ratioshalby ltd making good foundation near support area, minor spike can add more investor .
risk reward is good over the counter.

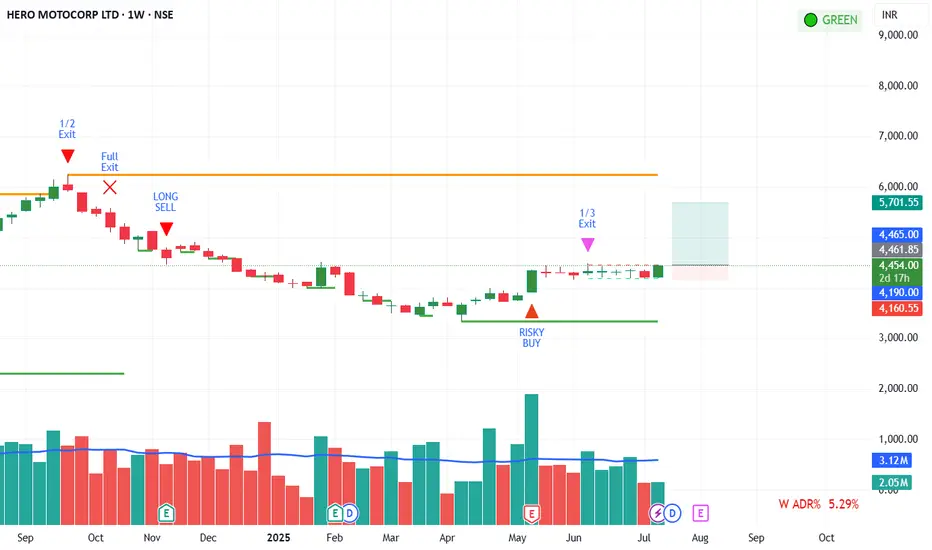
HERO MOTOCORP LTD looks Good HERO MOTOCORP LTD our Private indicator give signal earlier few weeks ago. Now it seems looks more constractive, and can be Take position stoploss according to chart.
CAMS Long_Support at 20 DEMA_Hidden Bullish DivergenceCAMS Long:
- Price takes support at 20 DEMA
- Hidden bullish Divergence
- First time price tests 50/ 20 DEMA after Golden Crossover
- Enter Long when the price is favorable in lower timeframe
- SL: close below 20 DEMA

Poonawalla Fincorp BuyPoonawalla Fincorp seems to take support at trend line. Buy @CMP (455) with SL of 445 and Target of 475 & 500.

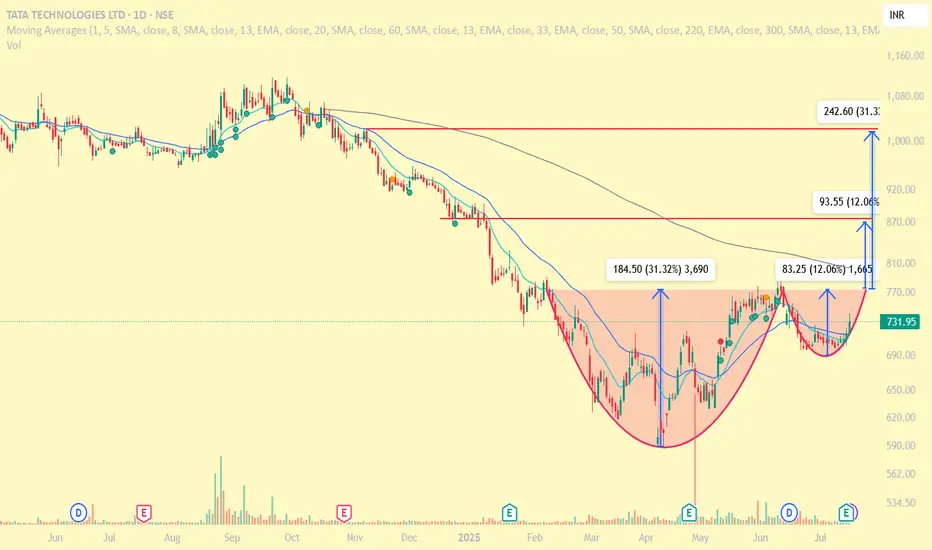
Tatatech: Formation of cup and handlethe chart shows the formation of cup and handle in progress. It may shoot the targets depending upon the market perception.