LOKESH MACHINES LTD S/RSupport and Resistance Levels:
Support Levels: These are price points (green line/shade) where a downward trend may be halted due to a concentration of buying interest. Imagine them as a safety net where buyers step in, preventing further decline.
Resistance Levels: Conversely, resistance levels (red line/shade) are where upward trends might stall due to increased selling interest. They act like a ceiling where sellers come in to push prices down.
Breakouts:
Bullish Breakout: When the price moves above resistance, it often indicates strong buying interest and the potential for a continued uptrend. Traders may view this as a signal to buy or hold.
Bearish Breakout: When the price falls below support, it can signal strong selling interest and the potential for a continued downtrend. Traders might see this as a cue to sell or avoid buying.
MA Ribbon (EMA 20, EMA 50, EMA 100, EMA 200) :
Above EMA: If the stock price is above the EMA, it suggests a potential uptrend or bullish momentum.
Below EMA: If the stock price is below the EMA, it indicates a potential downtrend or bearish momentum.
Trendline: A trendline is a straight line drawn on a chart to represent the general direction of a data point set.
Uptrend Line: Drawn by connecting the lows in an upward trend. Indicates that the price is moving higher over time. Acts as a support level, where prices tend to bounce upward.
Downtrend Line: Drawn by connecting the highs in a downward trend. Indicates that the price is moving lower over time. It acts as a resistance level, where prices tend to drop.
Disclaimer:
I am not a SEBI registered. The information provided here is for learning purposes only and should not be interpreted as financial advice. Consider the broader market context and consult with a qualified financial advisor before making investment decisions.

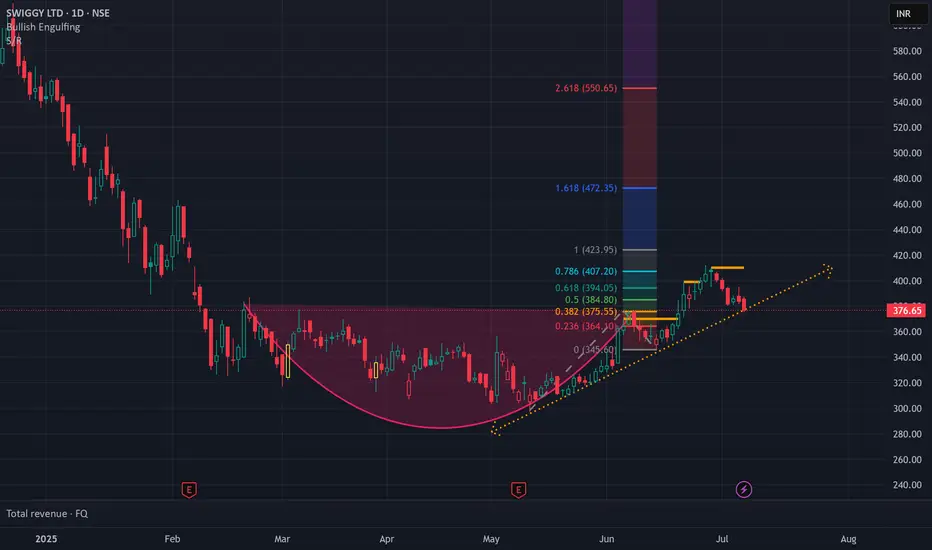
SWIGGY Breaking out of Rouding Bottom PatternNSE:SWIGGY is breaking out of Rouding Bottom Pattern. You can Buy at 398 and Target for 420. Keep Stop loss at 370. The Points that you will gain here is 22 points and since the stock price is less, you can invest a little more and try gaining more profit.
Adani Enterprises Weekly Chart Analysis: Bullish ScenarioAdani Enterprises Weekly Chart Analysis: Bullish Scenario
-June 23 Weekly candle close above 200EMA(Bullish)
-EMA 9/21 Bullish cross on May 26
-MACD signal line crossing above zero line -Bullish
-If next couple weeks candles close above Support level i am expecting 3070 as next Buyside target(Long)

BRITANNIA INDUSTRIES has formed Ascending Triangle PatternNSE:BRITANNIA has formed an Ascending Triangle Pattern. You can enter at current point . 1st target would be 6140, followed by Second target 6240 and finally Third target 6280. Kindly keep Stopp loss at 5605

Britania Notable Fluctuations In the last few days, Britannia's stock has experienced notable fluctuations, driven by market sentiment and recent earnings reports.
Following a positive outlook from analysts, the stock saw a brief rally, fueled by strong consumer demand and effective cost management strategies.
However, profit-taking and broader market trends led to slight pullbacks.
Overall, the stock remains a focus for investors watching for further developments in the FMCG sector and its ongoing recovery post-pandemic.
Buy at 5869
SL 1:- 5848
SL 2:- 5827
TGT1 :- 5910
TGT2:- 5980

Birlasoft - Ready to enter stage 2 - cautiously optimistic setupTechnically stock seems to be ready to enter stage 2, looking to buy on dips around 415 (support zone). It shows a cautiously optimistic technical setup. As long as it remains above Rs. 415 pivot/support zone, the bias is bullish with room to push into the Rs. 450–480 range. Keep an eye out for Birlasoft’s upcoming dividend on July 18, 2025 and the next earnings on August 6, 2025. Both events can trigger increased volatility.

TVS MOTOR CUP AND HANDLE FORMATION LONG TERM SWINGPattern: Cup and Handle (Bullish Continuation Pattern)
Trading Style: Long-Term Swing Trading (holding for several days to weeks, or even longer to capture significant moves)
Current Context (as of July 8, 2025):
TVS Motor Company (TVSMOTOR) last closed around ₹2876.90.
The 52-week high is ₹2960.30.
Recent analyst reports and technical analysis suggest that TVS Motor is near its all-time high (ATH) and there are discussions about a potential breakout above ₹2958 to ₹2960, which could confirm a bullish continuation if the cup and handle pattern is indeed forming.
Your Proposed Trade Setup:
Entry Level:
Safe Trader: Above ₹2960
Risky Trader: ₹2850
Stop Loss (SL):
Risky Trader: If weekly candle closing below ₹2800
Safe Trader: Weekly candle close below ₹2920
Target (TR):
1st Target: ₹3075
2nd Target: ₹3315
3rd Target: ₹4000

NAM_INDIA analysis TARGET 1090NAM India (Nippon Life India Asset Management Ltd.) is currently presenting a classic cup‑with‑handle breakout, supported by solid volume and pattern confirmation, positioning it for a potential 40% upside to ₹1,090 from current levels.
Current price: ₹779
Target price: ₹1,090 (~40% gain) based on technical formation
ROCE: ~41.6%
ROE: ~31–32%
Debt: Virtually zero debt
Dividend yield: ~2.3%
Profit growth: ~25% 5‑year CAGR
The levels of ₹730 now acts as a key support level and, if sustained, strengthens the case for a disciplined entry toward ₹1,090. With robust financials underlying the chart pattern, this setup qualifies as a buy recommendation, blending technical precision with fundamental strength.
Disclaimer: Please do your own analysis before making any investment decisions.
I hope you found this idea insightful and learned something new.
If you did, don’t forget to like, share, and follow for more such market insights.
Thank you for your time and support!

Indusind bank - Bullish setupIndusind bank - Bullish setup - expect the stock to hit the parallel and then stall for some time before it moves higher

Review and plan for 8th July 2025Nifty future and banknifty future analysis and intraday plan.
Swing ideas.
This video is for information/education purpose only. you are 100% responsible for any actions you take by reading/viewing this post.
please consult your financial advisor before taking any action.
----Vinaykumar hiremath, CMT

Granules - Looking Beautifull structure - short to long investorGranules -----Daily counts indicate Excellent bullish wave structure.
Both appear to be optimistic and this stock invalidation number (S L) wave 2 low
target short / long term are already shared as per charts
correction wave leg seems completed C
Investing in declines is a smart move for short/ long-term players.
Buy in DIPS recommended
Long-term investors prepare for strong returns over the next two to five years.
one of best counter
Every graphic used to comprehend & LEARN & understand the theory of Elliot waves, Harmonic waves, Gann Theory, and Time theory
Every chart is for educational purposes.
We have no accountability for your profit or loss.

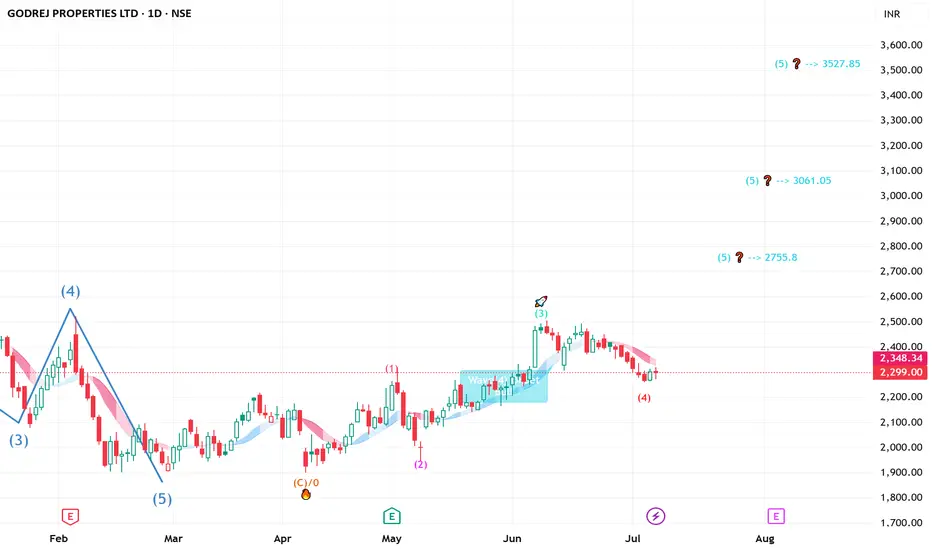
GODREJ PROPERTIES - Ready to FLY - short to long Elliot waveGODREJ PROPERTIES-----Daily counts indicate Excellent bullish wave structure.
Both appear to be optimistic and this stock invalidation number (S L) wave 2 low
target short / long term are already shared as per charts
correction wave leg seems completed
Investing in declines is a smart move for short/ long-term players.
Buy in DIPS recommended
Long-term investors prepare for strong returns over the next two to five years.
one of best counter
Every graphic used to comprehend & LEARN & understand the theory of Elliot waves, Harmonic waves, Gann Theory, and Time theory
Every chart is for educational purposes.
We have no accountability for your profit or loss.
GODREJ Industries Ready to Blast !! Short to Long term GODREJ Inndustries-----DAILY counts indicate Excellent bullish wave structure.
Both appear to be optimistic and this stock invalidation number wave 2 low
target short / long term are already shared as per charts
correction wave leg seems completed
Investing in declines is a smart move for short/ long-term players.
Buy in DIPS recommended
Long-term investors prepare for strong returns over the next two to five years.
one of best counter
Every graphic used to comprehend & LEARN & understand the theory of Elliot waves, Harmonic waves, Gann Theory, and Time theory
Every chart is for educational purposes.
We have no accountability for your profit or loss.

ESCORTS looking strong on weekly count ESCORTS KUBOTA-----WEEKLY counts indicate Excellent bullish wave structure.
Both appear to be optimistic and this stock invalidation number wave 2 low
target short / long term are already shared as per charts
correction wave leg seems completed
Investing in declines is a smart move for short/ long-term players.
Buy in DIPS recommended
Long-term investors prepare for strong returns over the next two to five years.
one of best counter
Every graphic used to comprehend & LEARN & understand the theory of Elliot waves, Harmonic waves, Gann Theory, and Time theory
Every chart is for educational purposes.
We have no accountability for your profit or loss.

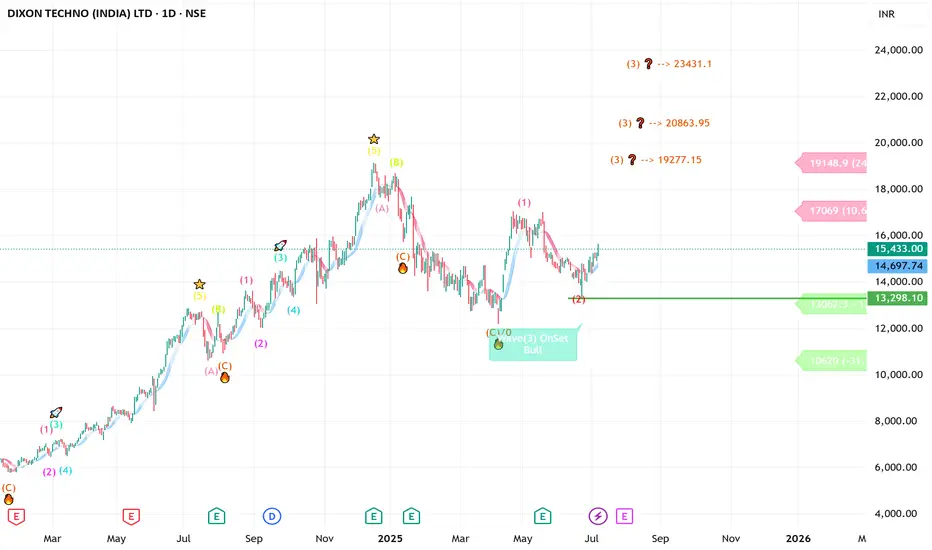
DIXON -----Daily counts Fresh Implus start anytime -UpsideDIXON -----Daily counts indicate Excellent bullish wave structure.
Both appear to be optimistic and this stock invalidation number wave 2 low
target short / long term are already shared as per charts
correction wave leg seems completed
Investing in declines is a smart move for short/ long-term players.
Buy in DIPS recommended
Long-term investors prepare for strong returns over the next two to five years.
one of best counter
Every graphic used to comprehend & LEARN & understand the theory of Elliot waves, Harmonic waves, Gann Theory, and Time theory
Every chart is for educational purposes.
We have no accountability for your profit or loss.
Technical Analysis: Price Breakout and BeyondHello Friends,
Welcome to RK_Chaarts,
Let's try to analyze a stock from the FMCG sector, "Dabur India Limited".
Elliott Wave perspective.
We can see that the correction is completed, which is the IVth wave of the monthly time frame of cycle degree in Red. Now, possibly the impulse wave Vth had start unfolding. If we go inside that, we'll see its five sub-divisions in black, labeled ((1))-((2))-((3))-((4))-((5)) of primary degree.
Possibly, wave ((1)) has started unfolding, and within wave ((1)), we'll see five sub-divisions in blue, which is the intermediate degree. Within this, waves (1) and (2) looks complete, and wave (3) has started, which has also broken out of the curve line.
Invalidation level
If our wave counts are correct, the bottom level of wave IV, which is 433, will be our main invalidation level. If the price goes below this level, it will trigger the invalidation level. If that happens, we'll need to re-analyze the chart from a wave count perspective.
But if the price stays above this invalidation level, then our view, which is based on the analysis, will remain bullish, and the chart will remain bullish.
Projected Target
As per Elliott wave theory, it can show new ATH in Long Term, only if Invalidation level is not breached.
Breakout with good Intensity of Volumes
The breakout has a good intensity of volume. The volume in the breakout candle is looking very good, which is 3-4 times higher than the average. This means that market participation is very good during this breakout. So, Conviction is high on this breakout.
We can clearly see that the price has closed above the 50 Exponential Moving Average (EMA), 100 EMA, and 200 EMA, which is a very good sign that the price has overcome all these hurdles along with Breakout.
Now, if there are any hurdles above, they could be the 200 EMA on the weekly time frame, which is coming near the level of 529, and the 50 EMA on the monthly time frame, which is coming near the price of 527. Currently, the price is trading around 513.
Once it crosses 529 or 530, it may show even more strength after that.
Dow Theory Trend confirmation
Based on Dow Theory, if we observe, the price which was falling and making lower highs and lower lows, has now started forming a Higher High and Higher Low pattern on the daily time frame, which is again a sign of bullishness.
Standard Deviation crossed
Price is trading above the mid-Bollinger Band on the weekly time frame, i.e., in the bullish territory. On the daily time frame, Prince has also crossed the upper Bollinger Band, meaning it has broken out and is expanding above the upper Bollinger Band, which is a bullish sign
Supporting Indicators
On the daily time frame, a very good breakout is visible inside RSI, and is also moving above 72. Additionally, on both the daily and weekly time frames, the MACD has given a positive crossover.
Before making any trading decisions, please conduct your own analysis or consult with a technical expert or financial consultant.
I am not Sebi registered analyst.
My studies are for educational purpose only.
Please Consult your financial advisor before trading or investing.
I am not responsible for any kinds of your profits and your losses.
Most investors treat trading as a hobby because they have a full-time job doing something else.
However, If you treat trading like a business, it will pay you like a business.
If you treat like a hobby, hobbies don't pay, they cost you...!
Hope this post is helpful to community
Thanks
RK💕
Disclaimer and Risk Warning.
The analysis and discussion provided on in.tradingview.com/u/RK_Chaarts/ is intended for educational purposes only and should not be relied upon for trading decisions. RK_Chaarts is not an investment adviser and the information provided here should not be taken as professional investment advice. Before buying or selling any investments, securities, or precious metals, it is recommended that you conduct your own due diligence. RK_Chaarts does not share in your profits and will not take responsibility for any losses you may incur. So Please Consult your financial advisor before trading or investing.

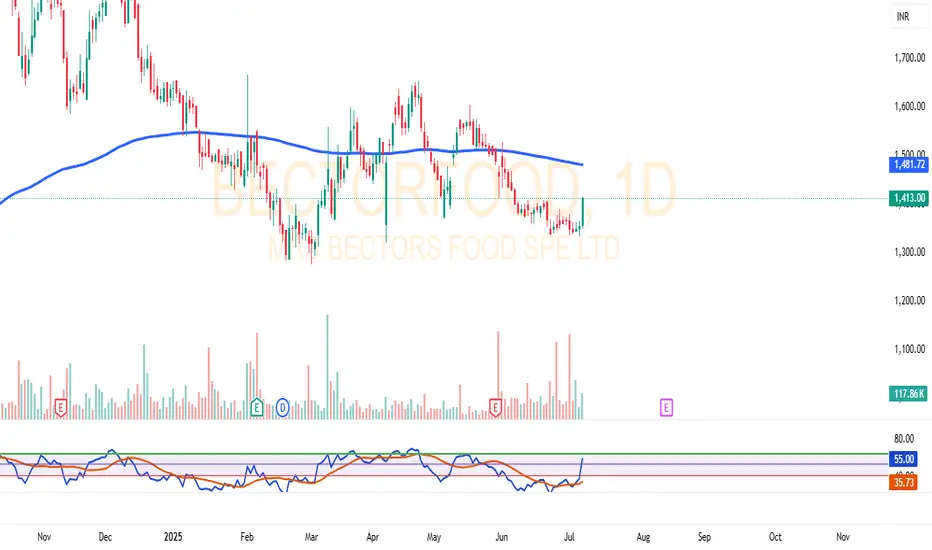
BECTORFOOD – RSI Strength with Volume Build-up |BECTORFOOD is showing strength on the daily chart after a prolonged consolidation. The price has formed a rounding bottom structure and is currently testing a key resistance zone.
🔍 Key Observations:
RSI has crossed the 55 level, indicating possible momentum buildup
Volume is rising along with price movement
200 EMA near ₹1480–1500 zone is acting as resistance
Traders and learners should observe how price behaves near this resistance. A close above this zone may indicate continuation of upward trend, while rejection may lead to consolidation or pullback.
🚫 No trading advice is being given here. This is only a technical chart study for educational discussion.
🔒 Disclaimer:
I am not a SEBI-registered advisor. This content is purely for educational and informational purposes. Please do your own research or consult a registered financial advisor before making any decisions.
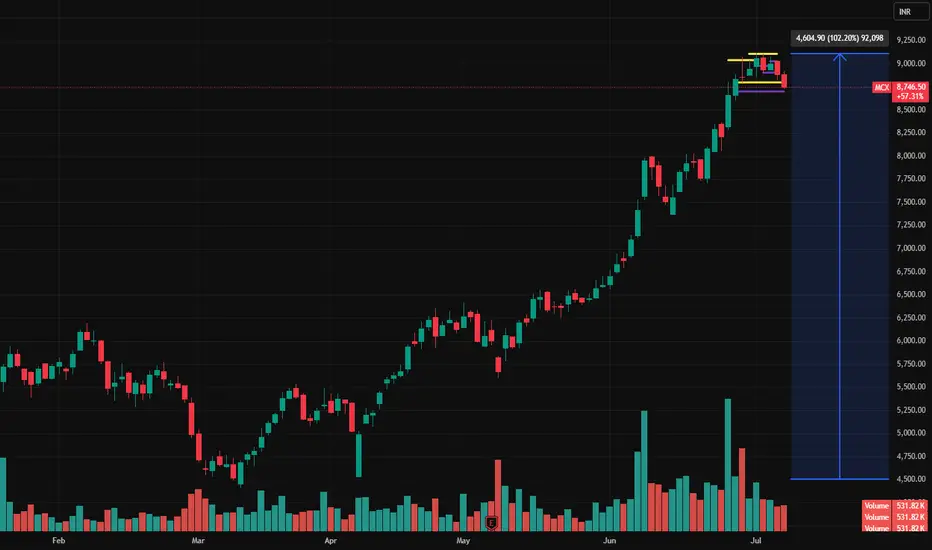
MCX – Breakdown After Strong Rally | Bearish Setup AlertAfter a massive uptrend from April to June, MCX formed a distribution zone near the ₹9000 mark. The price consolidated in a narrow range and finally broke down below key support (~₹8745) with strong volume.
🔍 Technical Highlights:
Structure: Distribution after uptrend (UTAD possibility)
Breakdown candle closes below consolidation support
Volume spike confirms selling pressure
Price rejection from the ₹9100 resistance zone
Potential downside projection: ₹4600 (as per range height)
📉 Bearish Bias Active
Breakdown below ₹8745 is a short signal
SL: Above ₹8900 (last swing high)
Targets: ₹7800 → ₹7000
💡 Watch for retests, but this setup suggests possible deeper correction if the structure sustains.
🔻 Momentum fading... Bulls should be cautious.

Long HDFC life:
-Price takes support at 20 Daily EMA
-Bullish Engulfing Candle
- Enter long when the price is favorable in lower time frame
- SL: Close below 20 Daily EMA

HDFC life Long _ Support @ 20 Daily EMAHDFC life:
-Price takes support at 20 Daily EMA
-Bullish Engulfing Candle
- Enter long when the price is favorable in lower time frame
- SL: Close below 20 Daily EMA

Adani Ports Long_ Support @ 20 Daily EMAAdani Ports Long:
1. After Golden Cross - Price first time pulled back
to 50 DEMA & then took support now at 20 DEMA
2. Enter Long when you get attractive Entry prices
based on lower timeframe
3. SL - Close below 20 DEMA
4. Caution: Today volume is not so great
