VISHNUSURYA INFRA techno-funda analysisVishnusurya Projects & Infra Ltd. is a Chennai-based construction and infrastructure company involved in civil contracting, roadwork, bridges, and earthmoving services. It also undertakes bitumen supply and mining contracts for state and national authorities. The stock is currently trading at ₹178.65 after a strong recovery from its recent base and is beginning to show structural trend formation.
Vishnusurya Projects & Infra Ltd. – FY22–FY25
Snapshot Sales – ₹232 Cr → ₹276 Cr → ₹321 Cr → ₹367 Cr – Consistent growth, healthy execution pipeline
Net Profit – ₹4.8 Cr → ₹7.1 Cr → ₹10.6 Cr → ₹14.8 Cr – Accelerating profitability, scale benefits emerging
Company Order Book – Moderate → Moderate → Strong → Strong – Increasing traction from infra contracts Dividend Yield (%) – 0.00% → 0.00% → 0.00% → 0.00% – No distributions, reinvestment-focused
Operating Performance – Weak → Moderate → Moderate → Moderate – Improving EBITDA visibility
Equity Capital – ₹27.55 Cr (constant) – Stable ownership base
Total Debt – ₹92 Cr → ₹88 Cr → ₹81 Cr → ₹75 Cr – Deleveraging progressing cautiously
Total Liabilities – ₹184 Cr → ₹196 Cr → ₹210 Cr → ₹225 Cr – Proportionate to execution scale
Fixed Assets – ₹88 Cr → ₹94 Cr → ₹101 Cr → ₹108 Cr – Ongoing capex to support order execution
Latest Highlights
FY25 net profit rose 39.6% YoY to ₹14.8 Cr; revenue up 14.3% to ₹367 Cr
EPS: ₹5.37 | EBITDA Margin: 13.6% | Net Margin: 4.03%
Return on Equity: 9.74% | Return on Assets: 6.58%
Promoter holding: 72.08% | Dividend Yield: 0.00%
Major road and civil contracts under execution in Tamil Nadu and Andhra Pradesh
Continued capex toward machinery, bitumen handling, and project mobility infrastructure
Technical Snapshot Vishnusurya is trading at ₹178.65 with an RSI of 50.76, showing early-stage trend strength near a long-term base. Volume activity is increasing steadily, pointing to institutional accumulation. Support levels are visible near ₹222.92, ₹156.98, and ₹273.60, while upside breakout zones exist at ₹397.60, ₹463.50, and ₹547.50 if the upward trend sustains.
Business Growth Verdict Yes, Vishnusurya is expanding its business on solid foundations
Profitability and margins are strengthening with better project mix
Debt is being managed conservatively amid revenue growth
Fixed asset expansion is paced well with project pipeline visibility
Final Investment Verdict Vishnusurya Projects & Infra Ltd. offers a compelling infrastructure turnaround story from the South Indian EPC space. The company’s rising revenue, expanding margins, and stable debt profile suggest disciplined execution and improving scale efficiency. Although dividend returns are absent, the reinvestment approach underlines long-term growth intent. For investors seeking a high-ROA infra bet with rising order flow and technical momentum, this stock merits active tracking for staggered accumulation.

JSW ENERGY LONG TERM SWINGJSW Energy (JSWENERGY) - Trading Idea
Action: Buy
Buy Above: ₹527
Stop Loss (SL): ₹490
Target (TR): ₹580 / ₹640 / ₹700 / ₹754

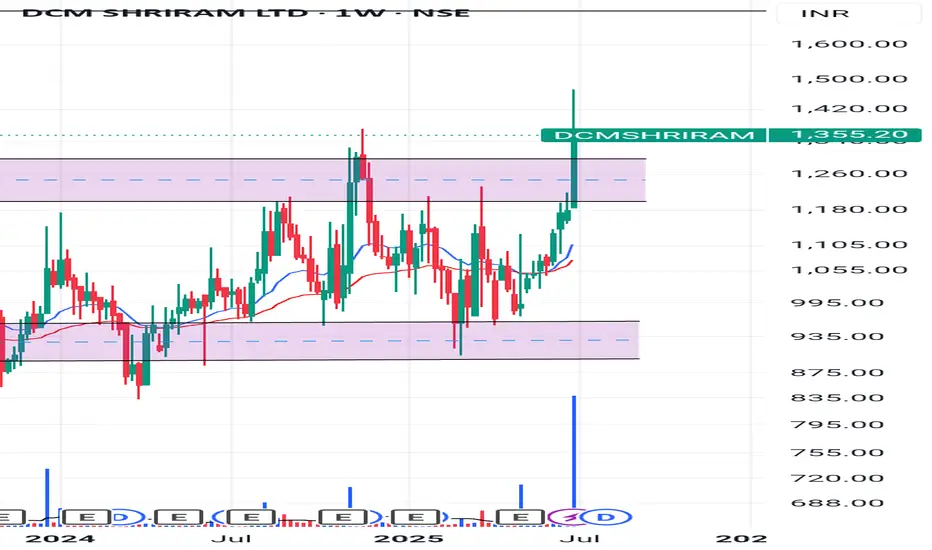
DCM shriramAfter 4 years cobsolidation with huge volume breakout
This is only for study purpose not any buy or sell.
Technical Analysis (Weekly Chart)Technical Analysis (Weekly Chart)
📊 Setup Details:
CMP: ₹2,796.60
Price has broken out above the ₹2,348 resistance and retested it successfully this week with a strong breakout (+7.4%) 🔥.
EMA Stack (5‑9‑20) trending up, reinforcing bullish momentum.
Volume increased significantly on the breakout — a positive signal.
💹 Key Levels & Trade Plan
Level Details
Support ₹2,348 (breakout retest)
Stop Loss Weekly close below ₹2,348
Target 1 ₹3,200 (near ATH)
Target 2 ₹3,600+ (if momentum continues)
🏢 Fundamental Overview (via Screener.in)
FY25 Revenue / Profit: ₹11,561 Cr / ₹836 Cr
Valuation Metrics: P/E ~47.6, P/B ~6.9, Dividend Yield ~0.3%
Profitability: ROCE ~18.2%, ROE ~15.5%
Debt Position: Virtually debt‑free with interest coverage high and Altman Z‑score strong
Growth Profile: 3‑yr sales CAGR ~15%, profit CAGR ~21%, TTM revenue growth ~29%
Pros:
Leading global auto‑ancillary focused on alloy wheels, suspensions, brake systems
markets.ft.com
Robust profitability with low debt and strong cash flows
Secular demand from 2W/3W OEMs (including European expansion)
Cons:
Valuation considered rich (~27–42% premium to intrinsic value)
ROE moderate (~15%), in line with peers

JSWSTEEL ' S Key Level | Big Breakout !This is the 4 hour chart of JSW STEEL.
JSWSTEEL having a good pattern support zone near at 980-1000 level .
JSW Steel has formed a Symmetrical Triangle pattern on the chart, and a breakout has occurred. The stock may retested the breakout level and then appears poised to move toward its projected target at 1180 - 1200 .
If the support zone level is sustain , then we may see higher prices in JSW Steel.
Thank You !!

HIND PETROHead and shoulder pattern, no further resistance , sky is clear. It may or may not retest the earlier resistance now its a support, fingers crossed


Ajanthpharma looking bullishAjanthpharma looking bullish - with debt resturcturing and expected good Year


SWING IDEA - AJANTA PHARMAAjanta Pharma , a mid-cap pharma player with strong branded generics in ophthalmology, dermatology, and cardiology, is showing a compelling swing trade setup backed by a high-probability technical breakout.
Reasons are listed below :
Bullish engulfing candle on the weekly timeframe, indicating reversal strength
2,500 zone acting as a crucial support
Holding above 0.382 Fibonacci retracement level , suggesting healthy correction
Price trading above 50 & 200 EMA on the weekly chart – long-term strength intact
Breakout from narrow consolidation near the 50-week EMA
Target - 3080 // 3400
Stoploss - weekly close below 2415
DISCLAIMER -
Decisions to buy, sell, hold or trade in securities, commodities and other investments involve risk and are best made based on the advice of qualified financial professionals. Any trading in securities or other investments involves a risk of substantial losses. The practice of "Day Trading" involves particularly high risks and can cause you to lose substantial sums of money. Before undertaking any trading program, you should consult a qualified financial professional. Please consider carefully whether such trading is suitable for you in light of your financial condition and ability to bear financial risks. Under no circumstances shall we be liable for any loss or damage you or anyone else incurs as a result of any trading or investment activity that you or anyone else engages in based on any information or material you receive through TradingView or our services.
@visionary.growth.insights

Buy above 817 fast target 873Everything mention about in my chart
buy price range cmp -811.85
stop loss - 797 day closing
fast target - 873
I am not sebi reg
is my own idea only

GRAPHITE NEAR TO BOGRAPHITE is about to break out, as it is moving in a tight range and volume has almost diminished, it shows no sellers left, can give good numbers in coming weeks.


TATA STEEL- NO DESCRIPTION NEEDEDsimple price action says everything on the chart- 200 is indeed looking good- track tata steel.

$varunBeveragesno brainer buy think this will starts its ascend from here
was some bad news about new players entering the market but this bubba will resurrect like a phoenix
shall allocate a bit more to this rsi looks bottomed and even if we target a attempt to reclaim previous parabolic rally we hit 62%

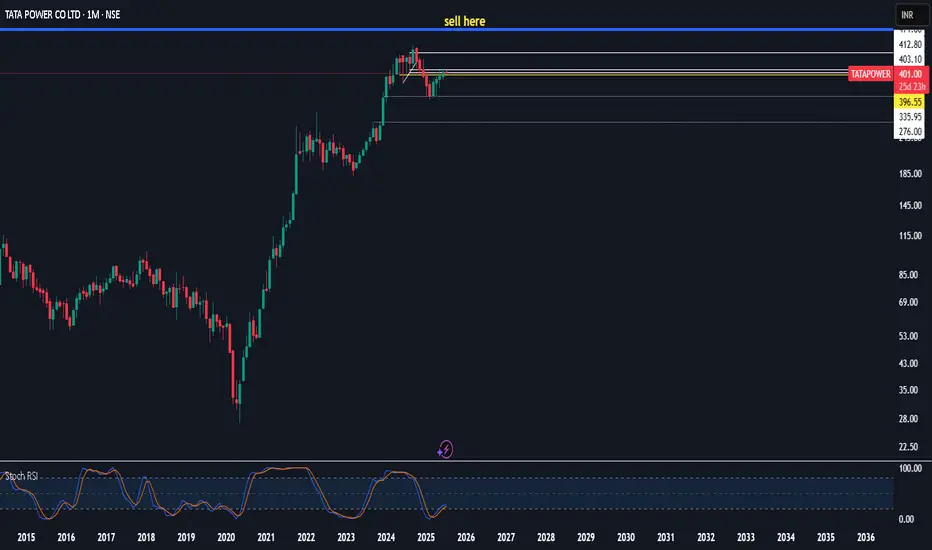
$tatapowerplease come back down i forgot to add u
rsi may dip one more time and give us a chance to reload but i doubt it since it has reclaimed the 7ema after deviating below it
dip was due to mangement getting off track stuff i belive is sorted now so to infinty and beyond!
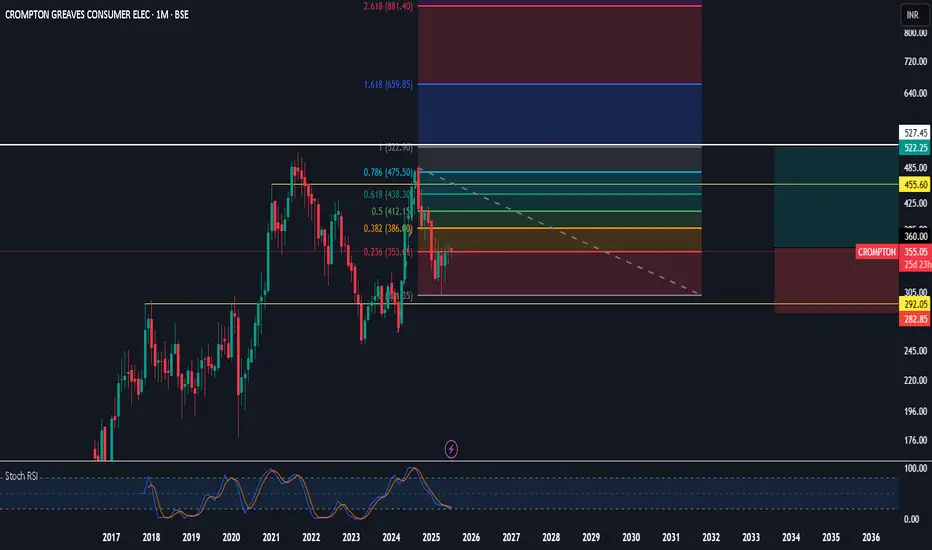
CROMPTON CONSUMER ELECTRIC45% Trade for the taking should move quick for now accumalate
rsi is showing signs of life so going to scale in on monday for a 5-6 month trade could goto 660 or rather deviate to 666 :)
lets see for now identifying some stocks to throw money at for end of Q3
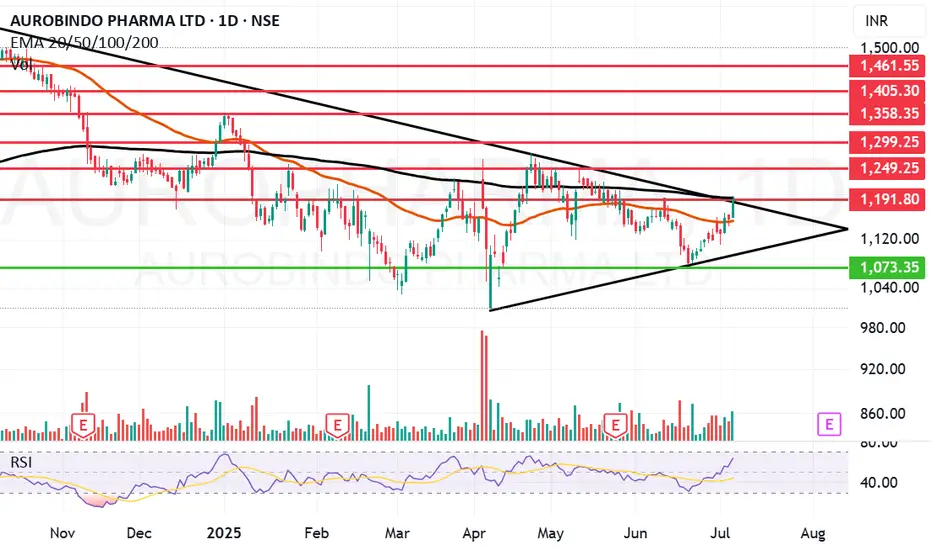
Aurobindo Pharma picking up momentum.Aurobindo Pharma Ltd. engages in the manufacturing of generic pharmaceuticals and active pharmaceutical ingredients. It operates under the following geographical segments: India, USA, Europe, and Rest of the World. Its portfolio includes antibiotics, anti-retroviral, cardiovascular, central nervous system, gastroenterological, anti-allergies, and anti-diabetics.
Aurobindo Pharma Ltd. Closing price is 1191.30. The positive aspects of the company are moderate Valuation (P.E. = 19.8), Strong cash generating ability from core business - Improving Cash Flow from operation, Companies with Low Debt, FII / FPI or Institutions increasing their shareholding, RSI indicating price strength and MFs increased their shareholding last quarter. The Negative aspects of the company are Stocks Underperforming their Industry Price Change in the Quarter and High promoter stock pledges.
Entry can be taken after closing above 1192 Historical Resistance in the stock will be 1249, 1299 and 1358. PEAK Historic Resistance in the stock will be 1403 and 1461. Stop loss in the stock should be maintained at Closing below 1073 or 986 depending upon your risk taking ability.
Disclaimer: The above information is provided for educational purpose, analysis and paper trading only. Please don't treat this as a buy or sell recommendation for the stock or index. The Techno-Funda analysis is based on data that is more than 3 months old. Supports and Resistances are determined by historic past peaks and Valley in the chart. Many other indicators and patterns like EMA, RSI, MACD, Volumes, Fibonacci, parallel channel etc. use historic data which is 3 months or older cyclical points. There is no guarantee they will work in future as markets are highly volatile and swings in prices are also due to macro and micro factors based on actions taken by the company as well as region and global events. Equity investment is subject to risks. I or my clients or family members might have positions in the stocks that we mention in our educational posts. We will not be responsible for any Profit or loss that may occur due to any financial decision taken based on any data provided in this message. Do consult your investment advisor before taking any financial decisions. Stop losses should be an important part of any investment in equity.
Niva Bupa gives a strong closing. Niva Bupa Health Insurance Co. Ltd. engages in the provision of health, travel, and corporate insurance services. It operates through the following segments: Health, Personal Accident, and Travel.
Niva Bupa Health Insurance Co. closing price is 85.05. The positive aspects of the company are Stocks Outperforming their Industry Price Change in the Quarter, Companies with Zero Promoter Pledge, Rising Net Cash Flow and Cash from Operating activity, RSI indicating price strength and FII / FPI or Institutions increasing their shareholding. The Negative aspects of the company are high Valuation (P.E. = 73.5), PE higher than Industry PE and MFs decreased their shareholding last quarter.
Entry can be taken after closing above 86 Historical Resistance in the stock will be 89.3, 94.8 and 99.2. PEAK Historic Resistance in the stock will be 102 and 106. Stop loss in the stock should be maintained at Closing below 79.58 or 75.2 depending upon your risk taking ability.
Disclaimer: The above information is provided for educational purpose, analysis and paper trading only. Please don't treat this as a buy or sell recommendation for the stock or index. The Techno-Funda analysis is based on data that is more than 3 months old. Supports and Resistances are determined by historic past peaks and Valley in the chart. Many other indicators and patterns like EMA, RSI, MACD, Volumes, Fibonacci, parallel channel etc. use historic data which is 3 months or older cyclical points. There is no guarantee they will work in future as markets are highly volatile and swings in prices are also due to macro and micro factors based on actions taken by the company as well as region and global events. Equity investment is subject to risks. I or my clients or family members might have positions in the stocks that we mention in our educational posts. We will not be responsible for any Profit or loss that may occur due to any financial decision taken based on any data provided in this message. Do consult your investment advisor before taking any financial decisions. Stop losses should be an important part of any investment in equity.

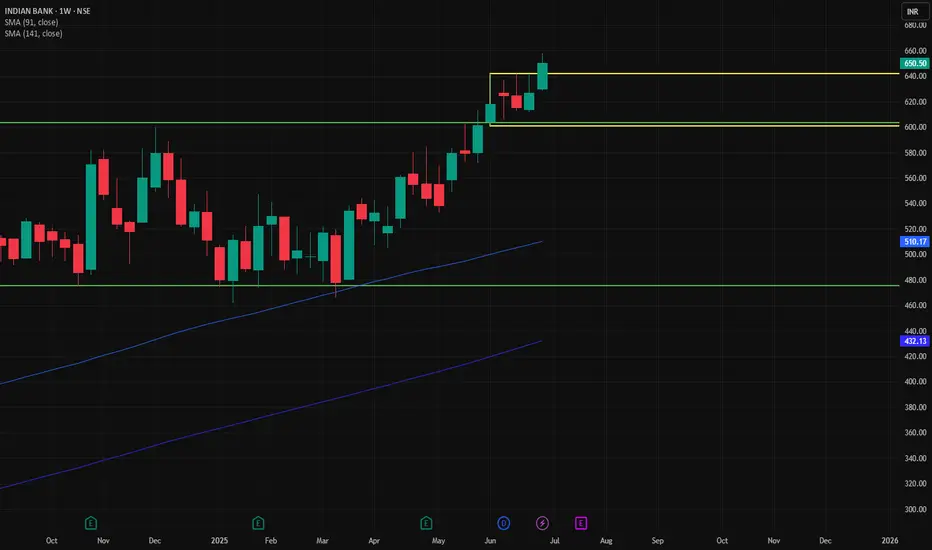
INDIAN BANK📊 Trade Plan: Long Setup
Entry Stop Loss (SL) Risk Target Reward RR
645 601 44 pts 744 99 pts 2.3
📌 Risk-Reward Ratio (RR) of 2.3 is healthy for a swing trade
📌 Entry aligns with 60M demand zone and near Daily/Weekly zones
🔄 Key Reference Points
Last High: 603
Last Low: 462
Point Variance: 141
🔔 Potential breakout above 603 (last high) supports further upside
✅ Conclusion
Buy Zone: 645 (entry near upper demand edge)
Stop-Loss Safety: Below multiple strong zones (601–618)
Target: 744 (next probable supply/target zone)
🧠 Suggestion: You may trail SL as it moves above 675 to lock partial gains. Ideal for positional traders aiming for breakout continuation.
🔍 Trend & Demand Zone Overview
Timeframe Trend Demand Zone Type Proximal Distal Avg.
HTF (Yearly, Half-Yearly, Qtrly) UP BUFL 603 471 537
MTF (Monthly, Weekly, Daily) UP RALLY RALLY, BUFL, DMIP 627 604 616
ITF (240M, 180M, 60M) UP DMIP 636 618 627
✅ Overall Trend: Bullish (UP) across all timeframes
✅ Strong Base Formation: Consistent demand between 601–645
✅ Multiple Timeframe Confluence: Reinforces bullish structure and buying opportunity
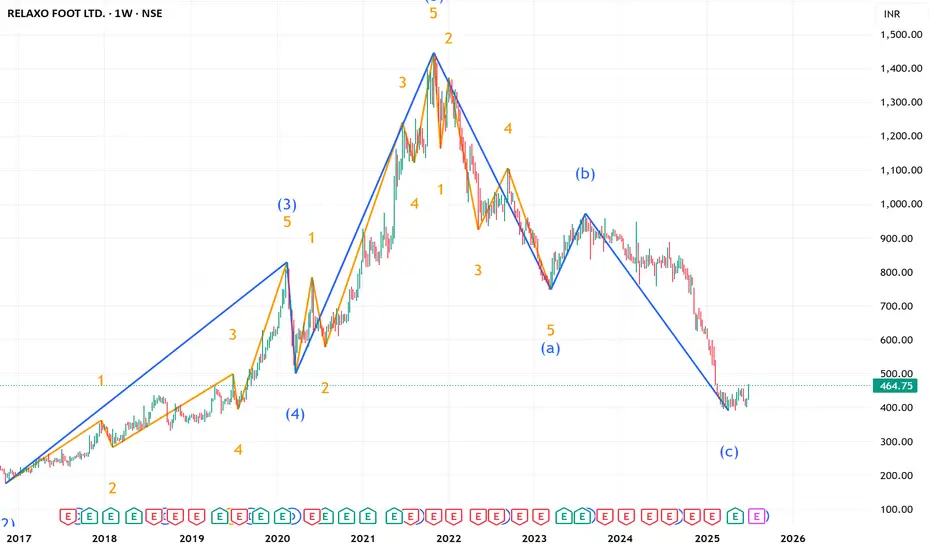
RELAXO ---Ready For UP SIDE---- ( LONG TERM Investment ) RELAXO Weekly counts indicate a Excellent bullish wave structure.
Both appear to be optimistic and this stock invalidation number 52 week low
target short / long term are already shared as per charts
correction wave leg seems completed
Investing in declines is a smart move for long-term players.
Buy in DIPS recommended
Long-term investors prepare for strong returns over the next two to five years.
Every graphic used to comprehend & LEARN & understand the theory of Elliot waves, Harmonic waves, Gann Theory, and Time theory
Every chart is for educational purposes.
We have no accountability for your profit or loss.