ASIAN PAINTS --- Ready to Rock ? Looking Wise InvestmentASIAN PAINTS
weekly counts suggests if 2179 weekly close maintain than we assume completion 2
so impulse wave may start soon!!!!
its monopoly stock in his sector
long term buyers should definitely do their own analysis
open to test levels already shown in picture
invalidation for this pattern 2179 ( weekly close)

Review and plan for 4th July 2025 Nifty future and banknifty future analysis and intraday plan.
Swing ideas.
This video is for information/education purpose only. you are 100% responsible for any actions you take by reading/viewing this post.
please consult your financial advisor before taking any action.
----Vinaykumar hiremath, CMT

VOLTAS in BreakoutNSE:VOLTAS in Breakout! Falling trendline breakout in Prices and RSI indicate Positive. Target would be 1350

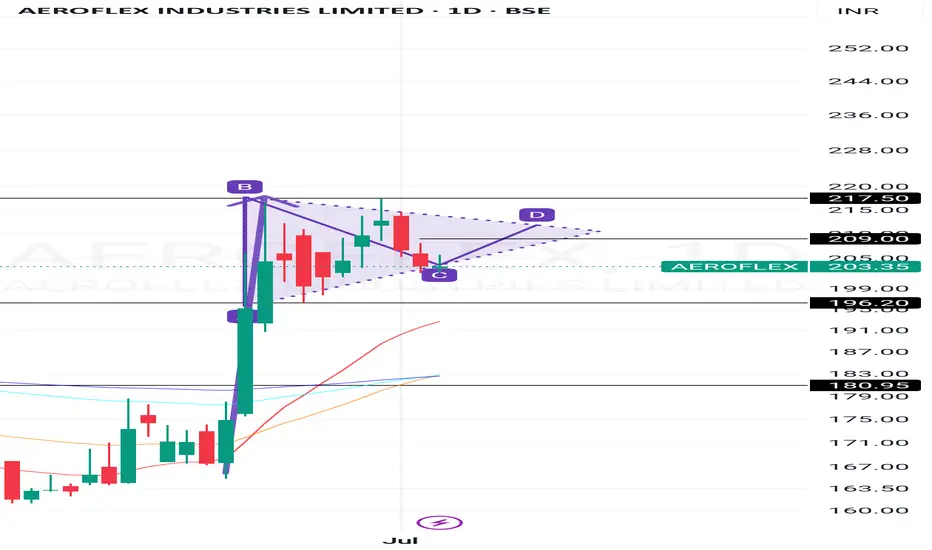
Aeroflex looking good to go Up direction There is a good signal moving average exponential shows that its treand changing down to up and the pole and flag pattern where when its berak the flag and retest we got a big move . Where we can enter at the point of 209 with the stop loss 196 our targets are 215 , 230 260, 280
KFINTECH Bullish Signals on Daily TimeframeKFINTECH is displaying multiple bullish signals with healthy volume on the daily timeframe. It is currently consolidating and may experience a slight dip, which could offer a good accumulation opportunity.
Stop loss: Your strategy

Syngene International BuySyngene International seems to take resistance at channel top, forming lower high. Sell @CMP (640) with SL of 655 and target of 600 and 550.

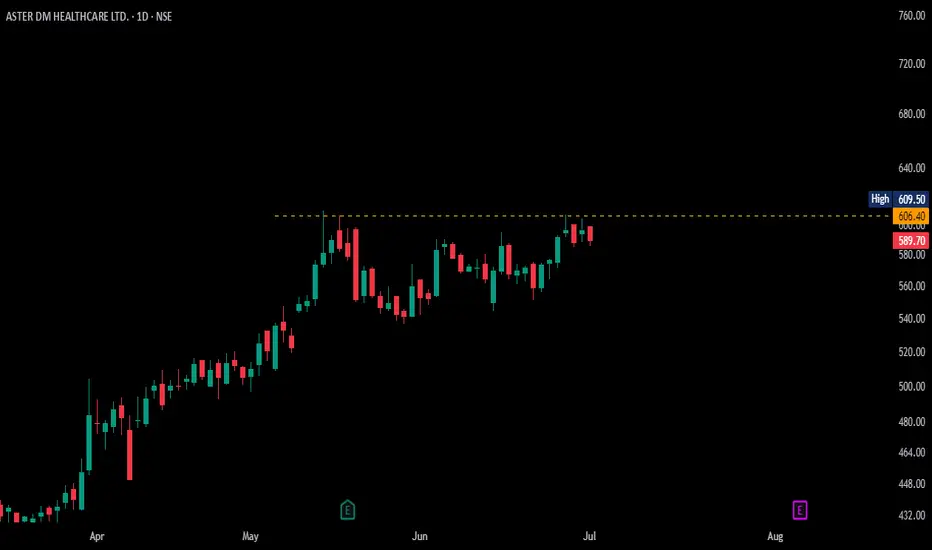
ASTERDM Ready to BOASTERDM after touching resistance, the current volume feature shows it is ready to Break Out
NBCC BuyNBCC breaks below trend line after forming a triangle pattern at the top. Sell @CMP (117) with SL of 122 and target of 114, 100 & 90.

[BUY] TATA MOTORS LTD WILL EARN 4 RUNSTata Motors Ltd 4hour candlestick chart shows
1. Clear Ascending Triangle Formation
2. Trendline connected everything.
3. There is no breakout yet on TL.
4. See chart for 1:1 ratio P/L.

OIL LONG_Support @ 20/50/ 200 Daily EMAOIL Long:
- Price takes support at 20/50/ 200 Daily EMA
- Forms Higher low & movement shows good Volume
- Enter Long when the prices are favorable in the lower timeframe
- Target: 485
- SL: Close below 20 Daily EMA or today's low

IGARASHI MOTORSIgarashi Motors India Ltd. – FY22–FY25 Snapshot
Sales – ₹610.0 Cr → ₹655.0 Cr → ₹725.0 Cr → ₹816.5 Cr – Moderate growth, steady trajectory
Net Profit – ₹7.2 Cr → ₹9.57 Cr → ₹12.4 Cr → ₹22.65 Cr – Improving profitability, favorable
Company Order Book – Weak → Weak → Moderate → Moderate – Improving demand outlook
Dividend Yield (%) – 0.00% → 0.14% → 0.14% → 0.14% – Very low, not ideal for income seekers
Operating Performance – Weak → Weak → Moderate → Moderate – Improving margins, still evolving
Equity Capital – ₹31.48 Cr (constant) – Stable, no dilution
Total Debt – ₹190.0 Cr → ₹180.0 Cr → ₹165.0 Cr → ₹151.5 Cr – Declining, well-managed
Total Liabilities – ₹710.0 Cr → ₹740.0 Cr → ₹765.0 Cr → ₹794.5 Cr – Stable, aligned with business scale
Fixed Assets – ₹580.0 Cr → ₹610.0 Cr → ₹640.0 Cr → ₹668.8 Cr – Gradual expansion, conservative
Land Investment – ₹90.0 Cr (unchanged) – Static, no growth intent
Building Investment – ₹75.0 Cr (unchanged) – No incremental investment
Machinery Investment – ₹120.0 Cr → ₹125.0 Cr → ₹130.0 Cr → ₹133.0 Cr – Minimal additions, modest capacity
Latest Highlights
- FY25 net profit rose 82.6% YoY to ₹22.65 Cr; revenue grew 10.5% to ₹816.5 Cr
- EPS: ₹7.19 | EBITDA Margin: 11.5% | Net Margin: 2.77%
- Return on Equity: 5.07% | Return on Assets: 2.99%
- Promoter holding: 75% | Dividend Yield: 0.14%
- Focus on EV components and export-led growth; strong Q1 FY25 performance with 472% YoY profit jump
Technical Snapshot
Igarashi Motors is trading at ₹534.90 (↑10.24%) with an RSI of 49.9, reflecting neutral momentum around the pivot zone. A significant pickup in monthly volume bars indicates fresh buying interest. Immediate support is visible at ₹478.50, with a deeper cushion near ₹377.80. If momentum sustains, the stock has visible upside potential toward ₹771.50, ₹872.20, and ₹1,000.50.
Business Growth Verdict
Yes, Igarashi Motors is making modest but consistent investments toward business growth
- Profitability and margins are improving steadily
- Debt is reducing and financial stability is strong
- However, asset expansion and topline growth remain conservative
Final Investment Verdict
Igarashi Motors has demonstrated consistent financial progress with improving margins, declining debt, and steady sales growth. While capex remains conservative, its pivot toward EV components and a robust Q1 FY25 performance signal an evolving growth narrative. Despite elevated valuations, further re-rating depends on sustained earnings momentum and execution.

CDSL MOVING TOWARDS NEW HIGHin coming weeks CDSL may create a new high, it is in the last leg to complete the C&H.

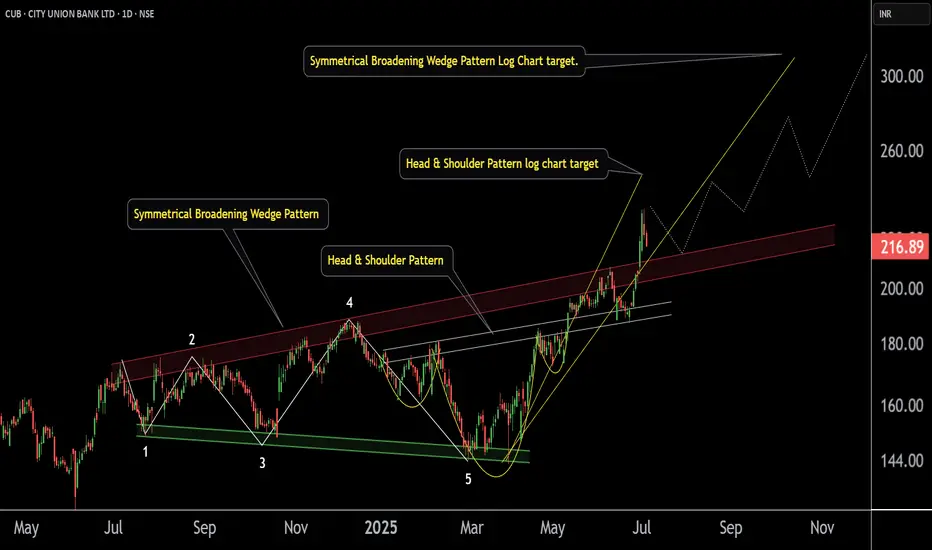
City Union Bank ' s Key level | Breakout |This is the Daily Chart of City Union Bank .
CUB has formed a Broadening Wedge pattern on the daily chart, with a breakout near the ₹200 support zone. Post breakout, the pattern suggests potential upside targets of ₹274 and ₹310
On the 4-hour chart, the stock has formed a Head and Shoulders pattern, with a breakout at ₹190, which has already been retested. The first target of the pattern has been achieved, while the next potential target is ₹250.
Thank You !!
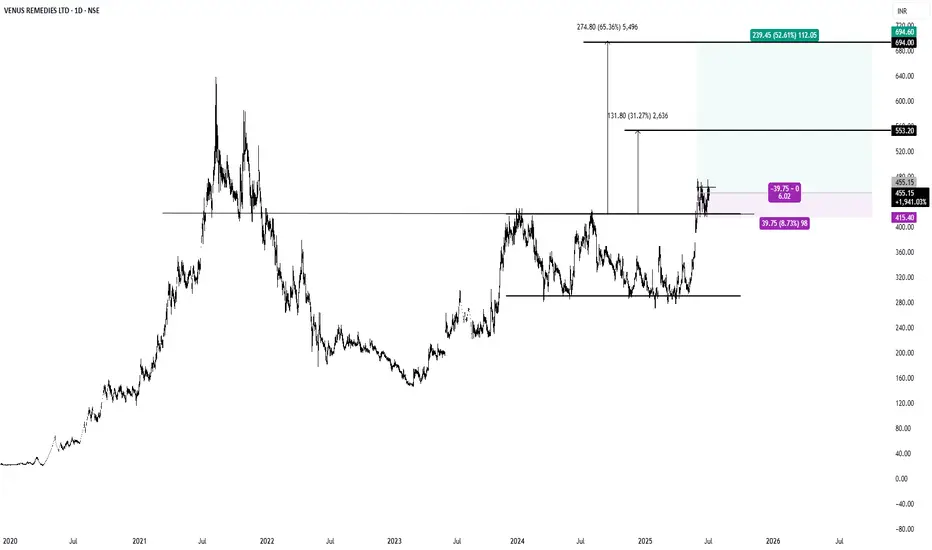
$VENUSREM #INDIA #NSE1. Cup and Handle Break Out.
2. Parallel Channel Break Out.
3.R:R >6 , Tight Stop Loss.
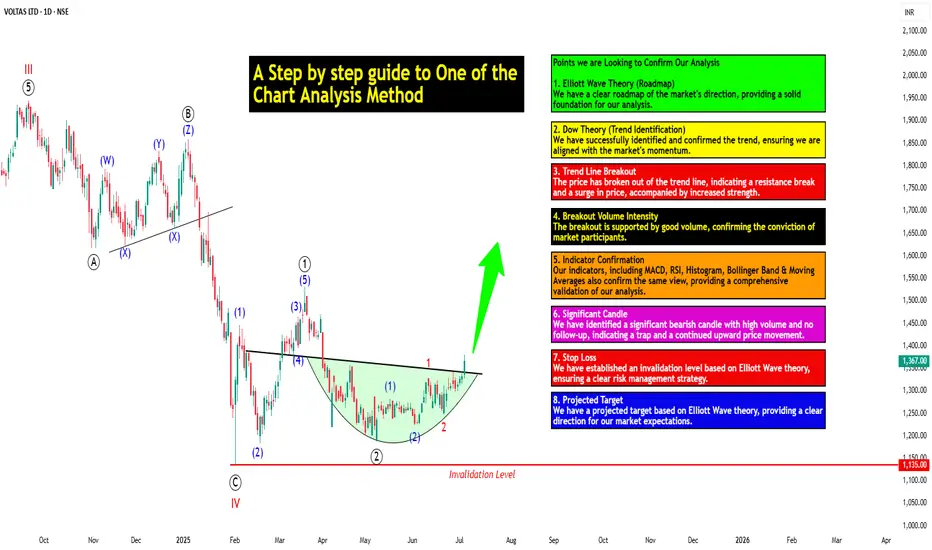
A Step-by-step Guide to One of the Chart Analysis Method: VOLTASHello Friends,
Welcome to RK_Chaarts,
Today we're going to learn step-by-step guide to one of the chart analysis Method by analyzing a chart of " VOLTAS LTD. " to identify a trend change opportunity.(Educational Post).
Let's get started!
Applying Elliott Wave Theory
According to Elliott Wave theory, we can see that the high of September 20, 2024, marked the end of the wave III of the cycle degree in Red. After that, a corrective wave unfolded, which reached its low on February 1, 2025. This was the wave IV of the cycle degree in Red, with a low of 1135.
The approximately 6 months correction ended here, and now the wave V of the cycle degree in Red has begun. Within this, there will be five sub-divisions of primary degree in black, which we can label as waves ((1)) to ((5)). Of these, waves ((1)) and ((2)) are complete, and we are possibly now in wave ((3)) of the Primary degree in Black.
Within wave ((3)), there will be five sub-divisions of intermediate degree in blue, of which waves (1) and (2) are complete, and the (3)rd intermediate degree in Blue is underway. Within this, there will be five sub-divisions waves of minor degree in red, of which 1 and 2 are complete, and today we saw the breakout of the 3 of the (3).
Possibly, this is a momentum move according to Elliott Wave theory, which we can call the third of the third of the third.
Now that we have this low of wave IV at ₹1135, it should not go below this level according to Elliott Wave theory. If it does, our current wave count will be invalidated. That's why we have an invalidation level within Elliott Wave, which according to this chart is at ₹1135. This low should not be breached. If it is breached for any reason, we'll have to re-analyze our entire count, and the counts could be different.
However, if this low holds, then the minimum target for wave V, based on the projection of wave theory, would be at least 100% to 123% of the fall from top III to bottom IV, which could take it to around ₹2000 to ₹2100. Shown in chart image below
Possible Elliott Wave Counts on Daily Time Frame Along with Invalidation level & Target levels.
Dow Theory Suggests now Up Trend
After forming the top of wave III, we can see that the price has moved downwards in a pattern of lower highs and lower lows. However, after completing the bottom of wave IV, the price has started forming a pattern of higher highs and higher lows, indicating that an uptrend has begun.
This is a clear signal that supports our wave counts moving upwards, i.e., towards an impulse move, based on Dow theory. The successful completion of wave IV and the initiation of the higher highs and higher lows pattern suggest a strong bullish trend, and we can expect the price to continue moving upwards. Shown in chart image below
Breakout with good intensity of Volumes
In this chart, we've observed a rounding bottom type chart pattern, and today, we've seen a breakout above the upper resistance trend line. Today's candle volume is also significantly higher than the average. Shown in chart images below
Chart Pattern: Rounding Bottom
Resistance Trendline Breakout with Good Intensity of Volumes
Supporting Indicators & Moving Averages
Also we can see that the current price has closed above the 50-day EMA and 100-day EMA. Additionally, indicators like RSI is above 60 and showing momentum, MACD is positive and above the zero line, and the histogram is also showing a breakout. Shown in chart images below
Breakout above 50DEMA & 100DEMA
RSI Breakout above 60+ on Daily Time Frame
Bullish side Breakout in Histogram on Daily Time Frame
MACD running Positive & above zero line on Daily Time Frame
Bollinger Band on Weekly
If we look at the weekly time frame, the current week's candle is above the middle Bollinger Band, indicating that the price is above the 20-period simple moving average on the weekly time frame. which is very good sign. Shown in chart image below
Price Trading above 20 SMA on Weekly Time Frame (Mid.Bollinger Band)
Significant Observation in Price Action & Volumes
Before the breakout, the rounding bottom chart pattern that was forming at the bottom can be interpreted as accumulation, as a red bearish candle with high volume appeared, marking the highest volume. Notably, no candle has closed below the low of that candle since then.
Although a gap-down candle occurred, it opened and closed bullish, indicating no selling pressure below that level. The absence of bearish follow-up and the subsequent breakout today are significant observations, combining price action and volume. This is a positive sign suggesting the price may move upwards. Shown in chart image below
This is how chart analysis is done for investment purposes. We've seen many signs in our favor, and yet we still use a stop loss to prevent significant losses in case the stock or market moves unexpectedly. This is what stop loss is all about - minimizing potential losses.
We've also discussed the target projection based on Wave theory, 123.6% level, which we explained through an image. So, friends, I hope you've understood the entire conclusion and learned how to analyze charts using different methods, one of which we shared with you today.
I am not Sebi registered analyst.
My studies are for educational purpose only.
Please Consult your financial advisor before trading or investing.
I am not responsible for any kinds of your profits and your losses.
Most investors treat trading as a hobby because they have a full-time job doing something else.
However, If you treat trading like a business, it will pay you like a business.
If you treat like a hobby, hobbies don't pay, they cost you...!
Hope this post is helpful to community
Thanks
RK💕
Disclaimer and Risk Warning.
The analysis and discussion provided on in.tradingview.com/u/RK_Chaarts/ is intended for educational purposes only and should not be relied upon for trading decisions. RK_Chaarts is not an investment adviser and the information provided here should not be taken as professional investment advice. Before buying or selling any investments, securities, or precious metals, it is recommended that you conduct your own due diligence. RK_Chaarts does not share in your profits and will not take responsibility for any losses you may incur. So Please Consult your financial advisor before trading or investing.
BULLISH PATTERN IN IDEANSE:IDEA
Trend Line Crossed, after strong consolidation.
Crossed successful 1st Lower Point 6.47.
Again closed above 6.77 (May be again Support, if any correction)
Successful closed above 7.01 (Previous 2nd wave low)
Finally Succeeded close above 7.21.

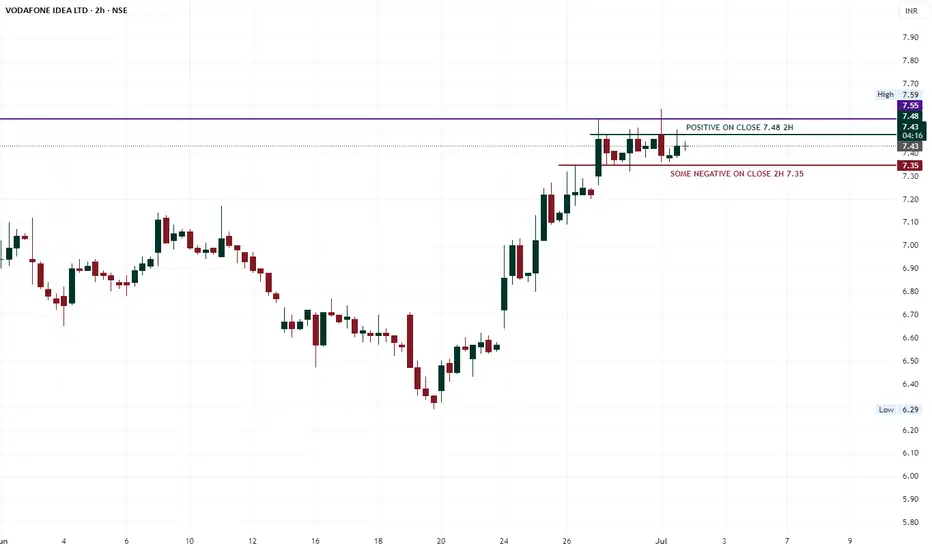
IDEA PATTERN ON PRICE ACTIONNSE:IDEA
If price run & close above only 7.48, then again possible move to up side.
But ma be some correction, if close below only 7.35 (2H)
May be very good sign, if close 7.61 (W)
BSE-Swing trade-Very bullish-Is profit booking over?
Buy-2820
Target-2943
SL-2688
Buy-2820
Target-2943
SL-2688
Positives
Trend, Pullback
Fairvalue gaps
0.5 Fibonacci
21 EMA
Resistance turned to support pullback

THELEELATHELEELA is giving resistance + cup and handle breakout above 414 level. Market participation has also increased in recent sessions. So if it sustains and closes above 414 then it looks very attractive and may start new momentum rally. 398 seems very good support. On upper side we may see momentum of 10-12%. Make sure that it sustain and closes above 414!

OIL Range Breakout with Strong Volume Confirmation Timeframe: Daily (1D)
📌 Chart Observed: Appears to be a stock forming higher lows after a strong recovery from
bottom.
🔍 Pattern Noticed:
• Price breakout above 200 EMA – typically a strong trend reversal signal.
• Today’s candle shows a bullish engulfing move with a volume spike, indicating buyer interest.
• RSI bouncing from 50 zone – suggests momentum revival.
📊 Volume: Higher than last 10-day average, confirming breakout interest.
🧭 Support Zone: ~₹425–₹430
🚀 Potential Upside (If trend continues): ₹470–₹500 zone
⚠️ Caution: Avoid entry if price falls below 200 EMA again or if volume fades on follow-up candles.
⸻
📌 Disclaimer:-
“I am not a SEBI registered advisor. This is just my personal analysis shared for educational and observational purposes. Please consult your financial advisor before making any trading or investment decisions.”

Pricol (Swing):Pricol (Swing):
Pricol is getting ready for an up move by breaking the past supply levels.
Script has well consolidated and formed a strong base.
Trade offers a RR of more than 1:5.
Check out my earlier views for a better understanding.
Note: Do your own due diligence before taking any action.

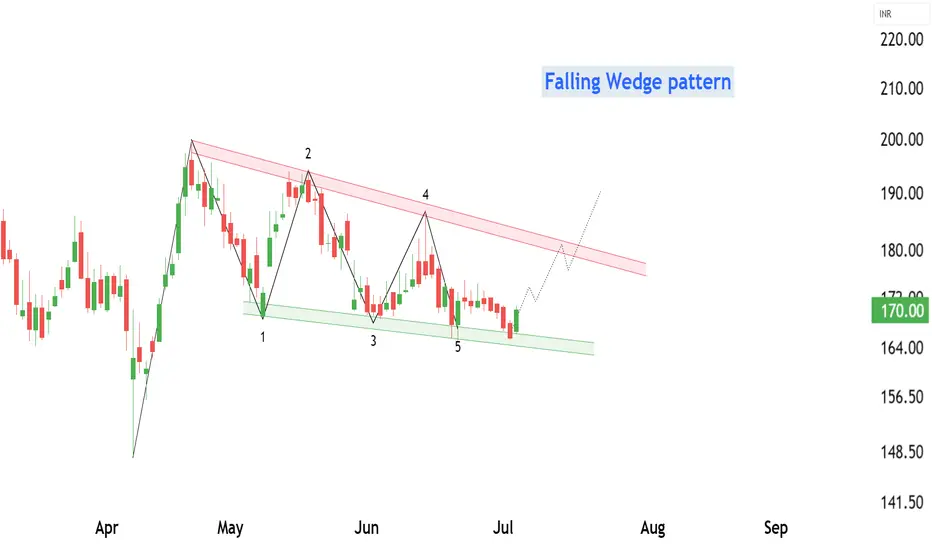
HINDUSTAN OIL EXPLORATION at Best Support !!This is daily chart of HINDUSTAN OIL EXPLORATION .
HINDOILEXP having a good Support zone at 162-165 level.
HINDOILEXP has formed a Falling Wedge Pattern with Support near at 165 level.
If this level is sustain , then we may see higher prices in HINDOILEXP .
Thank You !!
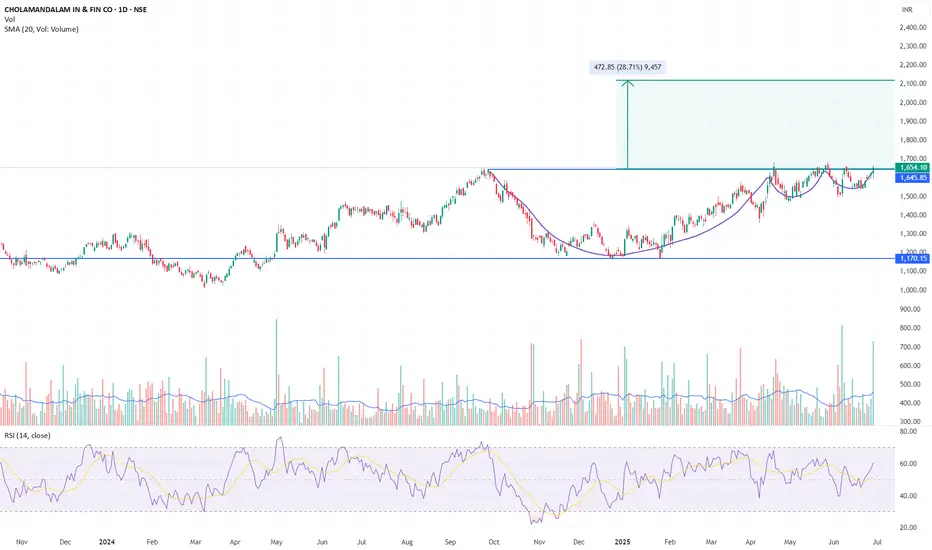
CHOLAFIN – Cup & Handle Breakout | Target ₹2120 (28% Upside)CHOLAMANDALAM FIN has confirmed a classic Cup and Handle breakout after 9 months of base formation. The neckline at ₹1645.85 has been cleanly crossed with strong follow-through and high volume.
Pattern Structure:
Cup Base: Formed between Sep–Dec 2024, bottomed near ₹1170
Handle: Shallow, corrective structure in May 2025 — ideal proportion
Breakout Zone: ₹1645.85 (horizontal resistance since Sep 2023)
Breakout Candle: Strong close at ₹1654.10 with high conviction volume (5.84M vs 2.3M avg)
Trade Setup:
Entry: Confirmed on breakout close above ₹1645
Target: ₹1645.85 + ₹472.85 = ₹2120
Stop Loss: ₹1545 (below handle low)
Risk-Reward: ~1:2.5 for positional traders
Indicators:
Volume: Significant spike, validating breakout
RSI: 60.2 and rising — bullish, not overbought
Moving Averages: Price well above 20 SMA, momentum aligned
Bias & Strategy:
Structure favours long-only positioning. Ideal for trend followers. Breakout is supported by volume and proper consolidation. Short-term pullbacks toward ₹1645–₹1620 can offer re-entry. Avoid shorting — this is the start of a fresh leg higher.
Disclaimer:
This analysis is shared strictly for educational and informational purposes. It does not constitute investment advice, nor is it a recommendation to buy, sell, or hold any securities. You are advised to perform their own due diligence, assess risk tolerance, and consult a registered financial advisor before making any investment decisions.