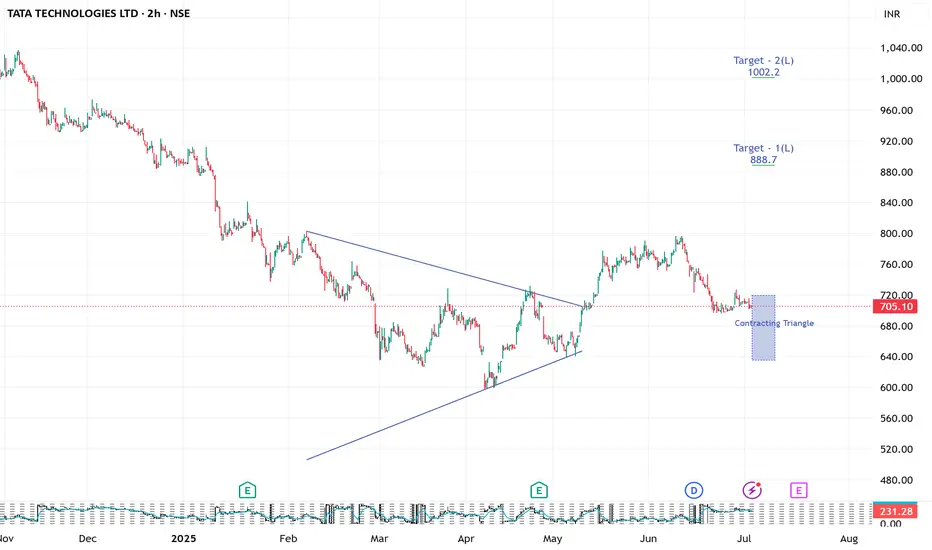
TATA TECHNOLGIES looking strong 2 hrs ( short to medium term
LOOKING stable and strong bullish contracting triangle
pattern suggest us abv 722 closing
price action may show some strength
These classic patterns sometime shows sparkle in price action
pattern may be wrong
do your analysis
this is for educational purpose
Review and plan for 3rd July 2025 Nifty future and banknifty future analysis and intraday plan.
Swing ideas.
This video is for information/education purpose only. you are 100% responsible for any actions you take by reading/viewing this post.
please consult your financial advisor before taking any action.
----Vinaykumar hiremath, CMT

Aditya Birla Fashion BuyAditya Birla Fashion break above channel resistance. Buy @CMP (78) with SL of 73 and target of 81, 86 & 105

PI Industries BuyPI Industries seems to take support at trend line. Buy @CMP (4170) with SL of 4000 and target of 4340 and 4700.

IREDA Short_Price Rejection @ 20/ 50 Daily EMAIREDA Short:
- Price rejection @ 20/ 50 Daily EMA
- Enter Short when price favorable at lower timeframe
- Target 159
- SL - Today High or close above 20/ 50 Daily EMA

TCS Short_Rejection From 20 & 50 Daily EMATCS Short:
- Rejection from 20/ 50 Daily EMA
- Bearish Engulfing Candle
- Enter when the prices are favorable in lower time frame.
- SL: Today's High or close above 20/ 50 Daily EMA

Mount Fuji Series- Old runners waking upMount Fuji Series- Old runners waking up -
TARC - started running after 50-70 levels.. hope getting ready again.
Realty company with good land holding. Funda strong company.

VENUS PIPESVenus Pipes & Tubes Ltd. is a stainless steel pipe manufacturer catering to diverse sectors such as oil & gas, petrochemicals, pharmaceuticals, and water desalination. The company operates an integrated facility and emphasizes high-quality, precision-engineered products. Currently trading at INR 1,461.70, the stock has shown a strong rebound and is testing key technical levels after a corrective phase.
Key Levels
Support Levels: INR 776.75, INR 1,134.45, INR 1,346.35, INR 1,557.30
Swing Level: INR 1,461.70
Possible Upside: INR 2,318.85, INR 2,675.95, INR 3,130.80
Technical Indicators
RSI (Relative Strength Index): Currently at 52.15, indicating balanced momentum. While not decisively bullish, the RSI suggests the stock has shifted out of oversold territory and could build strength above the current base.
Volume: With volume at 1.17M, there is visible participation accompanying the recent price up-move. Sustained higher volumes near swing level would help confirm a broader trend continuation.
Sector and Market Outlook
Operating in the metal tubes and industrial materials space, Venus Pipes is positioned to benefit from:
Strong capex trends in infrastructure, chemical processing, and renewables
Import substitution and rising demand for precision stainless steel products
Expansion in exports to Europe, Southeast Asia, and the Middle East
Headwinds include volatility in nickel and alloy prices, global logistics fluctuations, and customer concentration risks in certain end-use sectors.
Latest Developments
Capacity Expansion: Commissioned additional production lines for seamless pipes and tubes
Export Growth: Reported robust YoY increase in export contribution to total revenue
Financials: Improved margins driven by premium product mix and better utilization rates
Dividend Update
Venus Pipes & Tubes has declared a dividend of ₹3.50 per share, reflecting strong cash flow generation and a balanced capital return policy.
Analysis Summary
Venus Pipes & Tubes is transitioning from a correction phase to a potential recovery cycle, underpinned by stable technicals and structural tailwinds in its core markets. While some consolidation may persist, the improving volume and RSI suggest growing interest. The company’s expansion initiatives and strengthening fundamentals support a constructive long-term outlook for disciplined investors.

BUY 5 PAISA ABOVE 415 ON CLOSING BASIS ON WEEKLY CHART.Buy above 415 with daily closing and with the stop loss of 400 on the closing basis, stock is ready to fly with a potential swing target of 480. Technical indicators suggesting a good buy. Fundamentals are also fine.

BANDHANBANKNSE:BANDHANBNK
Note :
1. One should go long with a Stop Loss, below the Trendline or the Previous Swing Low.
2. Risk :Reward ratio should be minimum 1:2.
3. Plan your trade as per the Money Management and Risk Appetite.
Disclaimer :
>You are responsible for your profits and loss.
>The idea shared here is purely for Educational purpose.
>Follow back, for more ideas and their notifications on your email.
>Support and Like incase the idea works for you.

Bullish patterns & Monthly Breakouts in Alkyl AminesGood afternoon Folks, This stock has given us a breakout from falling wedge pattern and from inverse H & S pattern and with a strong green candle
- The next step is either you can enter now as a big green candle without rejection shows bulls strength.
- Next is to wait for the 2nd green candle closes around high which acts as confirmation and the classical way to trade breakouts.
- Now as per the John Murphy's book the target for Inverse H&S Breakout will be the size of head which I have marked in yellow which suggest 44% upmove or else you can use pivots which gives you support and resistance which can help you to understand from where price is taking support or where it is facing rejection.
- it will also helps you with target and stoploss.
THIS ARE MY PERSONAL VIEWS OR ANALYSIS NOT ANY RECOMMENDATIONS.

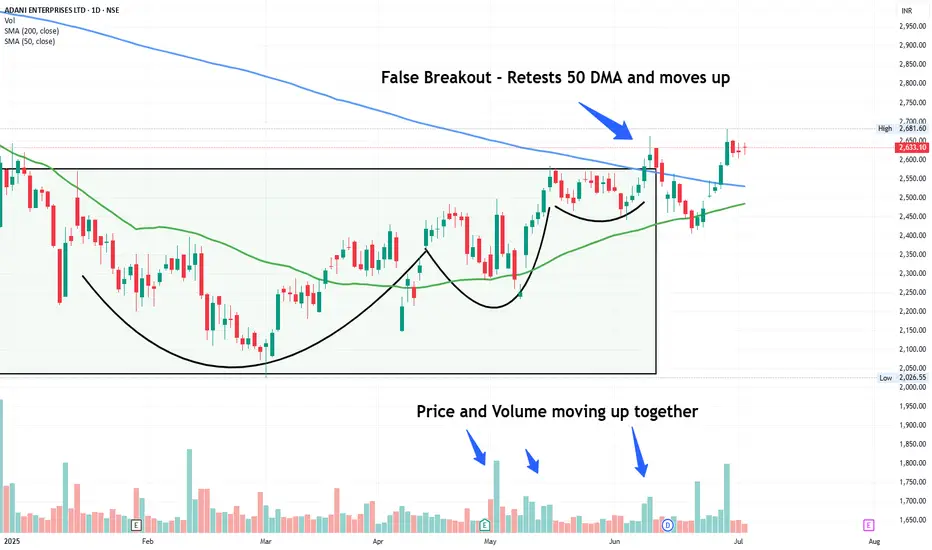
ADANIENT - time for a comeback?Thoughts mentioned on chart. It can attempt to fill the gaps it made while moving down. Good Risk reward on offer
IDBI : Red band Resistance on a monthly time frame IDBI : Red band Resistance on a monthly time
frame.
There is a Buy triggered on a daily time frame at 100 but on a monthly time frame there is a major Red Band Resistance.
On a 3 Month frame also it is almost sitting just above and around Red band Resistance.
To continue the rally these Red Band resistances needs to be cleared off for IDBI.
( Not a Buy / Sell Recommendation
Do your own due diligence ,Market is subject to risks, This is my own view and for learning only .)

Positional Setup: Fine Organic Industries Ltd (FINEORG)📌 CMP: ₹5,177.90
📈 Technical Structure:
Stock has cleared a multi-month resistance around ₹5,090–5,100
Strong bullish momentum, with increasing volume
Clean rounded base breakout, suggesting trend reversal
📊 Indicators:
Trading above TEMA 5/9/20 – bullish signal
Supertrend also likely supporting a buy signal (though visually hidden)
RSI in bullish territory (not overbought)
📌 Key Levels:
Immediate Support: ₹5,090
Strong Base: ₹4,815
Resistance/Targets:
🎯 T1: ₹5,660
🎯 T2: ₹5,970
🎯 T3: ₹6,200+ (if momentum sustains)
🛡️ Stop Loss: ₹5,090 (daily closing basis)

ULTRACEMCO - 1 year INVERTED TRIANGLE══════════════════════════════
Since 2014, my markets approach is to spot
trading opportunities based solely on the
development of
CLASSICAL CHART PATTERNS
🤝Let’s learn and grow together 🤝
══════════════════════════════
Hello Traders ✌
After a careful consideration I came to the conclusion that:
- it is crucial to be quick in alerting you with all the opportunities I spot and often I don't post a good pattern because I don't have the opportunity to write down a proper didactical comment;
- since my parameters to identify a Classical Pattern and its scenario are very well defined, many of my comments were and would be redundant;
- the information that I think is important is very simple and can easily be understood just by looking at charts;
For these reasons and hoping to give you a better help, I decided to write comments only when something very specific or interesting shows up, otherwise all the information is shown on the chart.
Thank you all for your support
🔎🔎🔎 ALWAYS REMEMBER
"A pattern IS NOT a Pattern until the breakout is completed. Before that moment it is just a bunch of colorful candlesticks on a chart of your watchlist"
═════════════════════════════
⚠ DISCLAIMER ⚠
Breakout Area, Target, Levels, each line drawn on this chart and any other content represent just The Art Of Charting’s personal opinion and it is posted purely for educational purposes. Therefore it must not be taken as a direct or indirect investing recommendations or advices. Entry Point, Initial Stop Loss and Targets depend on your personal and unique Trading Plan Tactics and Money Management rules, Any action taken upon these information is at your own risk.
═════════════════════════════

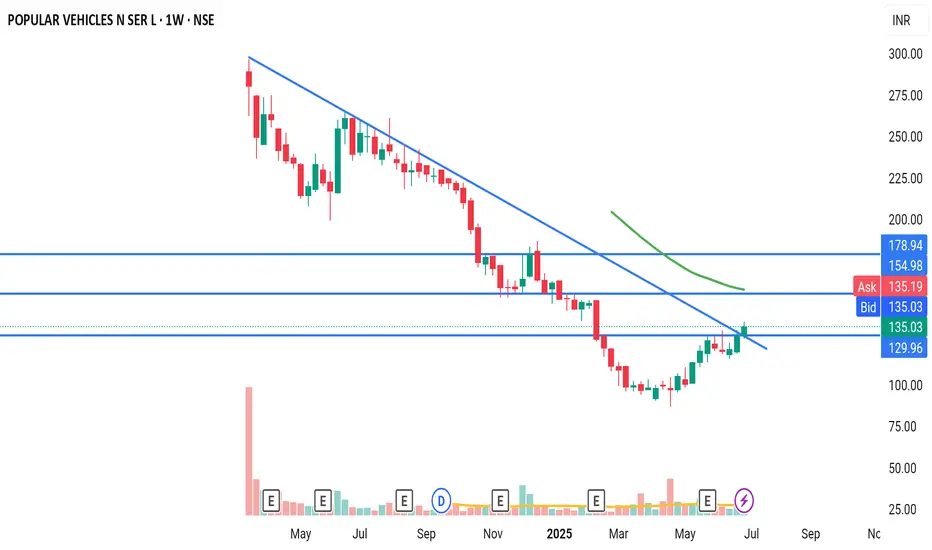
PVSLStrong upmove expected from CMP. Breakout of Cup and Handle pattern in daily timeframe, crossed trendline in daily and weekly timeframe.
OLAFire, Fire, Fire
get Out. Get out, Get out
Mcap : 20,000 cr
Mcap Lost in 9 months: 60,000 cr
Results: Unreliable
High time Investment bankers and Auditors are hauled for Capital Market Losses.

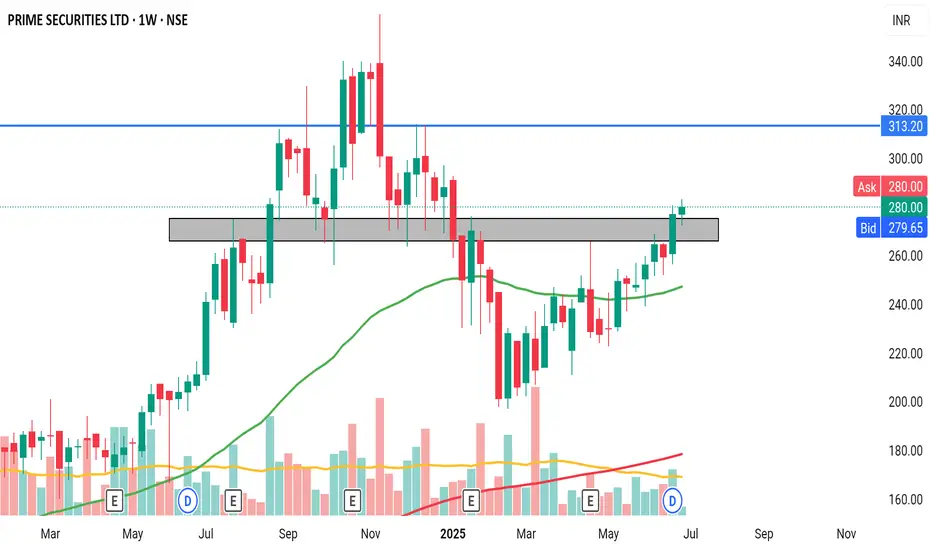
PRIME SECURITIES Crossed resistance with good volume in weekly timeframe. Price above 50 EMA indicates bullishness.
Kalyan Jewellers is going to touch the target soon.kalyan jewellers stock is on bullish structure now and our next target is marked with green line ,just waiting for the target.

Swing Trade Plan: MAN Industries (NSE: MANINDS)
A classic Cup & Handle Pattern bullish continuation pattern showing accumulation and a breakout from resistance. Indicates renewed buying interest.
Breakout supported by rising volume, confirming buyer strength.
Price holding above 20 and 50 EMA, indicating bullish trend continuation.
Company has consistent order inflows and is part of infra/pipe supply chain, aligning with current government spending themes.
This is my personal swing trade plan based on price action and fundamental analysis. Please do your own research before taking any investment decision.


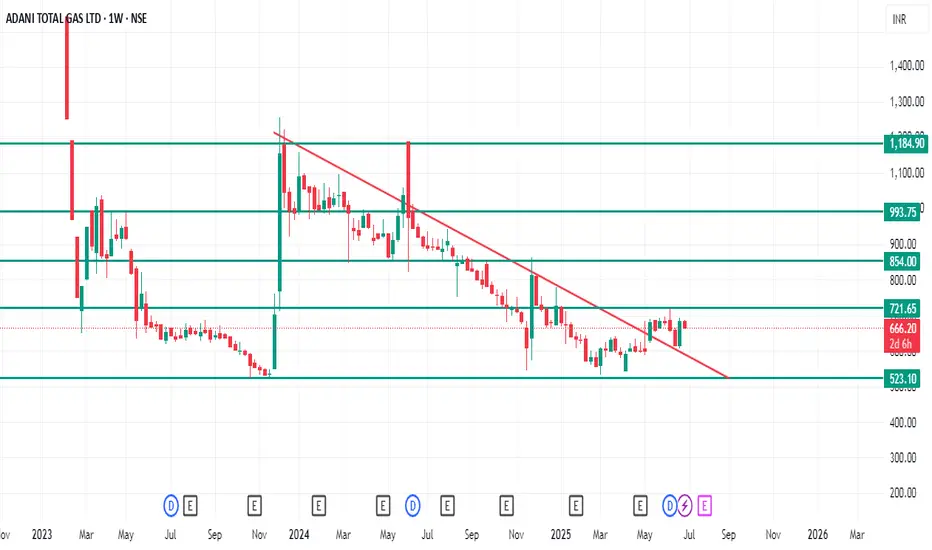
Go long in ATGL with SL 520ATGL is almost 83% down from it's all time high of 4000. From here we can see that there is a weekly breakout in this stock and from here we can expect targets of 720,850,990 & 1185.
Being a ADANI GROUP COMPANY, it can be a volatile stock in upcoming weeks. So go long in this stock with a strict SL of 520. It can be a good opportunity as stock has fallen 83% from it's top.